1245
Altered patterns of neural activity and functional connectivity revealed by dynamic rsfMRI in the Q175 mouse model of Huntington's disease
Tamara Vasilkovska1, Bram Callewaert1, Somaie Salajeghe1, Dorian Pustina2, Longbin Liu2, Mette Skinbjerg2, Celia Dominguez2, Ignacio Munoz-Sanjuan2, Annemie Van der Linden1, and Marleen Verhoye1
1Department of Biomedical Sciences, University of Antwerp, Antwerp, Belgium, 2CHDI Foundation, Princeton, NJ, United States
1Department of Biomedical Sciences, University of Antwerp, Antwerp, Belgium, 2CHDI Foundation, Princeton, NJ, United States
Synopsis
Static FC changes in neurodegeneration can indicate underlining neural mechanism pathology present in pre-manifest disease stage. In addition to the spatial FC component, quasi-periodic patterns (QPPs) implement spatiotemporal information of neural activity, allowing integrated assessment of possible initial changes in large-scale brain dynamics. We measured Low Frequency (LF) BOLD changes using rsfMRI in Q175 HD mouse model at 3 and 12 months of age. Results indicate decreased FC between specific regions in heterozygous compared to wild-type mice at 12 months. Both at 3 and 12 months, additional QPPs are present in the heterozygous group, deviating from the wild type group.
Introduction
Resting state fMRI (rsfMRI) is a method that uses the LF fluctuations of Blood Oxygenated Level Dependent (BOLD) signal within the brain, indicating changes in brain activity at rest, due to blood flow and oxygenation changes. Furthermore, the correlation of these LF BOLD changes between specific neuro-anatomically defined outlined brain regions, represents the static FC of the putative brain areas. FC has been shown to be sensitive to discrete pathological processes in neurodegenerative diseases, such as Huntington’s Disease.1 However, FC does not provide temporal information of the BOLD changes, leading to the need for a more sophisticated approach – the Quasi Periodic Patterns (QPPs). The QPPs represent spatiotemporal patterns of recurring brain dynamics correlated to neural activity.2 QPPs have been shown to indicate aberrant changes in large-scale brain networks in an Alzheimer’s disease mouse model.3Huntington’s disease (HD) is an inherited neurodegenerative disease, involving mutations in the huntingtin gene (HTT). Abnormal and increasing (>40) repeat expansion of the CAG (cytosine-adenine-guanine) in HTT causes the mutant variant of HTT (mHTT). The underlying HD mechanisms are still not clear and require further research. HD animal models allow a more in-depth investigation of the HD pathogenesis which can potentially facilitate translating preclinical findings to clinical studies. The Q175 Heterozygous (HET) mouse model imitates human development of HD. Accumulation of mHTT protein species in this model increases in size and density as a function of aging.4-6 Furthermore, this is seen in the striatum and cortex at 4 and 6 months of age, respectively. In this study, we aim to investigate connectivity changes and differential QPPs in Q175 mice using dynamic rsfMRI. To the best of our knowledge, this is the first study in which FC and QPP in an HD rodent model are assessed.
Methods
rsfMRI data was acquired in 24 3-month and 35 12-month old Q175 HET and wild type (WT) male mice (two groups at each age, N HET/N WT (age): 12/12 (3M) and 19/16 (12M)) using a 9.4T Biospec MRI scanner with a head cryo-coil. Mice were anesthetized using a mixture of medetomidine (0.075mg/kg s.c. bolus; 0.15 mg/kg/h s.c. infusion) and 0.5% isoflurane. Physiological parameters were continuously monitored and kept stable throughout the procedures. rsfMRI scans were acquired 40min post-bolus for 10min. The rsfMRI was measured using a T2*-weighted single shot EPI sequence (Matrix dimensions [90x70], TR/TE 500/15ms, 12 horizontal slices of 0.4mm (see Fig.1), 1200 repetitions, pixel dimensions of (300x300x400) µm3). After the rsfMRI scan, 3D RARE images were acquired, in order to create a study specific 3D template (TR 2000 ms, TE 42ms, MD [256 128 32], resolution (78 x 156 x 312) µm3). Pre-processing of the data including: debiasing, realignment, co-registration, normalization and smoothing were performed using SPM12 software (Statistical Parametric Mapping). Static FC and all QPP-related analyses (hierarchical clustering, phase sorting, global signal regression, selection and visualization) were performed using MATLAB 2018b. The FC matrices were calculated limiting the included ROIs to those reported to be affected in HD.7 A two-sample t-test was performed on only those connections that were found to be significant in at least one of both groups to evaluate potential FC changes in the HD group compared to WT group (p-value <0.05, FDR corrected). The spatiotemporal dynamics of BOLD patterns were extracted with a specific pattern finding algorithm.8Results
Fig. 2 shows the FC differences between the two groups (HET and WT) at 3 (Fig.2a) and 12 months (Fig.2b). At 12 months (Fig.2b), the FC profiles indicate significantly lower connectivity between: CPu(L)-CPu(R), CPu(R)-Piri(R), Ctx_Cl(R)-M1(R) and Ctx_Cl(R)-S1(R) in HET compared to WT mice, while at 3 months (Fig.2a) there was no significant FC difference between the two groups. A representative QPP segment from a long sliding window of 20TR (10s) is shown in Fig.3. Fig.4 shows a representative spatiotemporal QPP segment for both HET and WT at 3 months, indicating connectivity patterns which differ between the groups. Fig.5 shows representative QPP pattern segments at a given time point for 12 months for both HET and WT. We observed qualitatively different patterns as well as lateralization in the HET compared to WT group.Discussion and Conclusion
Our results suggest significant decrease in FC between HET-related regions at 12 months, as well as differential QPP patterns starting at 3 months and with a more distinctive QPP pattern alteration between groups at 12 months. The affected regions in both methods suggest connectivity changes in HET in both the striatum and cortical regions and additionally, in areas linked to the olfactory processing system.9 Therefore, further histological assessment is needed to link the changes in functional connectivity and altered quasi-periodic patterns of brain activity with mHTT deposition.Acknowledgements
No acknowledgement found.References
- Werner, C.J., Dogan, I., Sab, C., et al. Altered resting-state connectivity in Huntington’s Disease. Human Brain Mapping. 2013; 35(6): 2582-2593
- Thompson, G.J., Pan, W.-J., Magnuson, M.J., et al. Quasi-periodic patterns (QPP): Large-scale dynamics in resting state fMRI that correlate with local infraslow electrical activity. Neuroimage.2014; 84, 1018-1031
- Belloy, M.E., Shah, D., Abbas, A., et al. Quasi-Periodic Patterns of Neural Activity improve Classification of Alzheimer’s Disease in Mice. 2018; 8 (1): 10024
- Menalled L., Kudwa AE, Miller S, et al. Comprehensive behavioral and molecular characterization of a new knock-in mouse model of Huntington's disease: zQ175. PLoS One. 2012; 7(12): e49838.
- Heikkinen T, Lehtimaki K, Vartiainen N, et al. Characterization of neurophysiological and behavioral changes, MRI brain volumetry and 1H MRS in zQ175 knock-in mouse model of Huntington's disease. PLoS One. 2012; 7 (12), e50717.
- Carty N, Berson N, Tillack K, et al. Characterization of HTT inclusion size, location, and timing in the zQ175 mouse model of Huntington's disease: an in vivo high-content imaging study. PLoS One. 2015; 10 (4), e0123527.
- Georgiou-Karistianis N, Poudel G R, Domínguez, D J F, et al. Functional and connectivity changes during working memory in Huntington's disease: 18-month longitudinal data from the IMAGE-HD study. Brain and Cognition, 83 (1) (2013), pp. 80-91
- Majeed, W., Magnuson, M., Hasenkamp, W., et al. Spatiotemporal dynamics of low frequency BOLD fluctuations in rats and humans. Neuroimage. 2010; 54(2): 1140-1150
- Ferris, C.F., Kulkarni, P., Steven, T., et al. Studies on the Q175 Knock-in Model of Huntington’s Disease Using Functional Imaging in Awake Mice: Evidence of Olfactory Dysfunction. Frontiers in Neurology. 2014; 5: 94
Figures
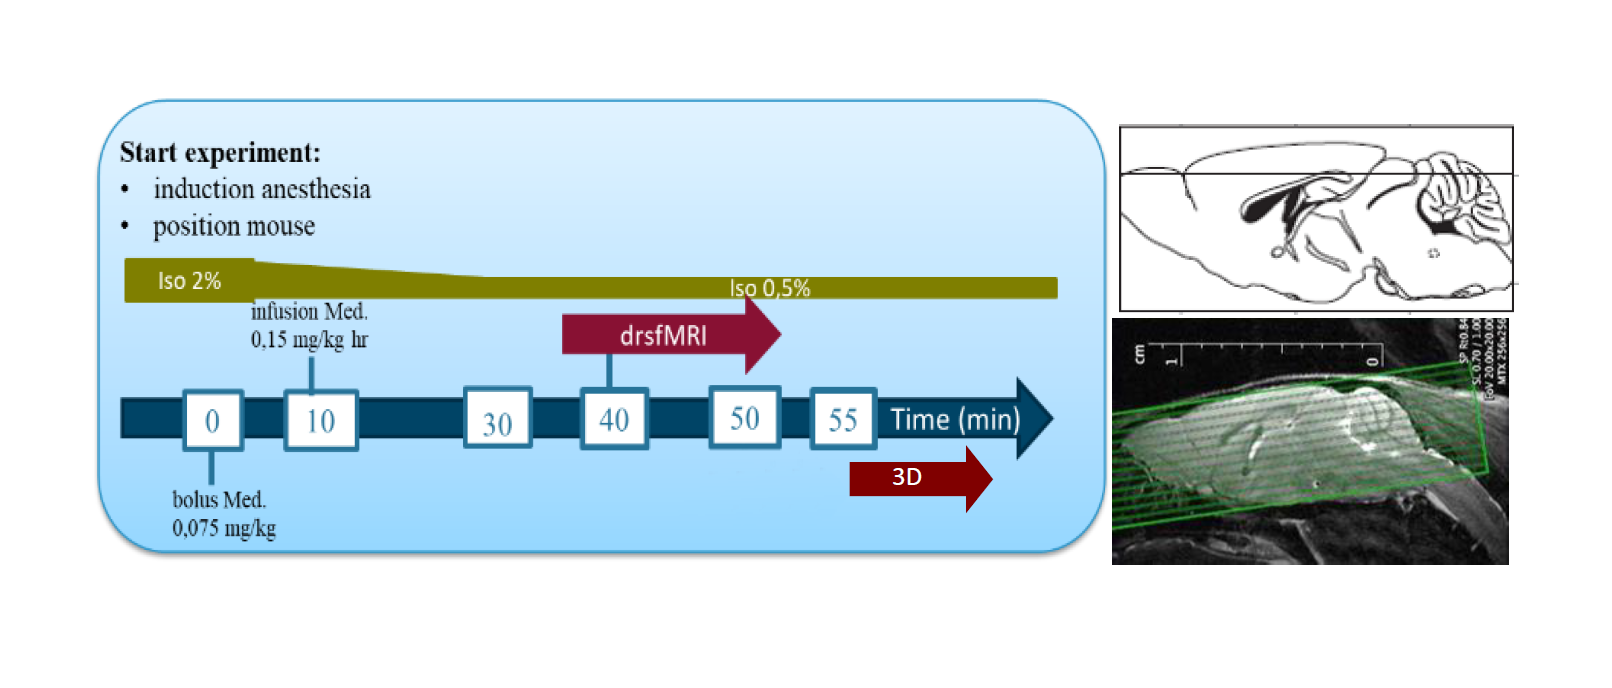
Fig.1: The acquisition scheme of a drsfMRI scan, with repetition time of
500ms and effective Echo time of 15ms (left) The slice horizontal
positions of the rsfMRI data are overlaid on a sagittal section (right).
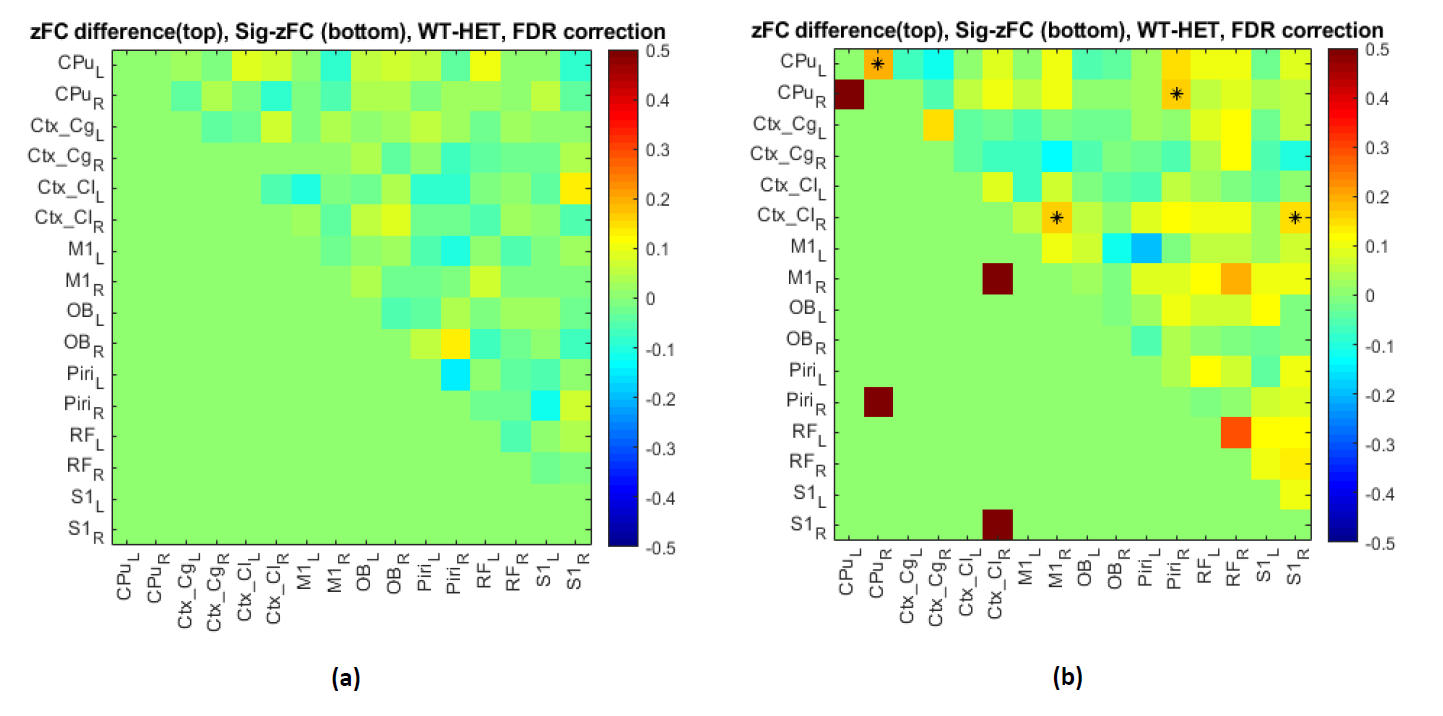
Fig.2: ROI-based approach reveals changes in FC between
different regions in HET compared to WT at 3 (a) and 12 months (b). Top right: mean
FC difference of WT-HET and significant FC (*) obtained by two-sample t-test of
T-value matrix; Bottom left: red squares - brain region pairs present a significant
genotype difference of FC (two-sample t-test, p-value <0.05, FDR corrected).
Abbreviations: CPu – Caudate Putamen; Ctx_Cg–Cingulate cortex; Ctx_Cl – Claustrum;
M1 – Motor cortex 1; OB – Olfactory Bulb; Piri – Piriform Cortex; RF – Reticular
Formation; S1 - Somatosensory cortex 1
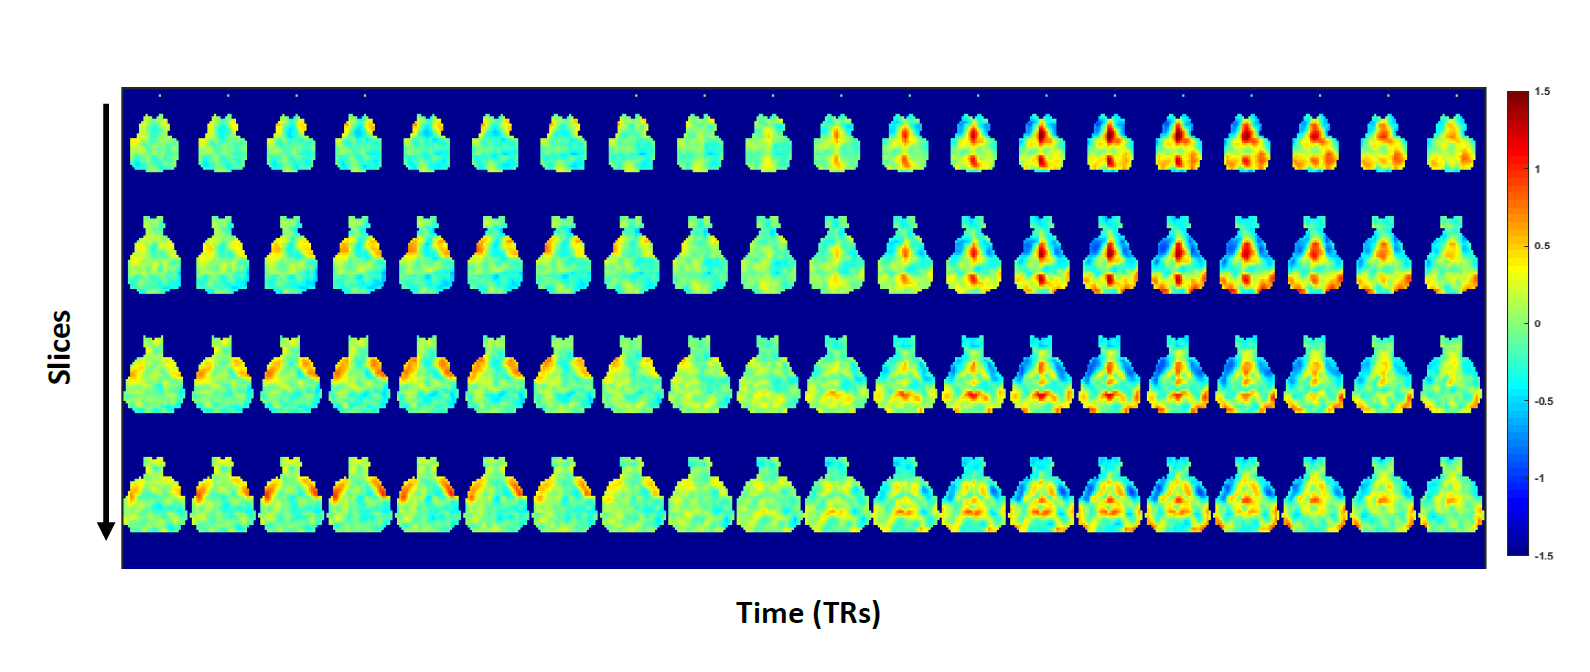
Fig.3: Representative QPP for a sliding window of 20TR (10s)
at 4 brain levels. Mean BOLD color maps show BOLD activity over all QPP
occurrences. higher (red)/lower (blue) BOLD activity relative to the global mean BOLD signal.
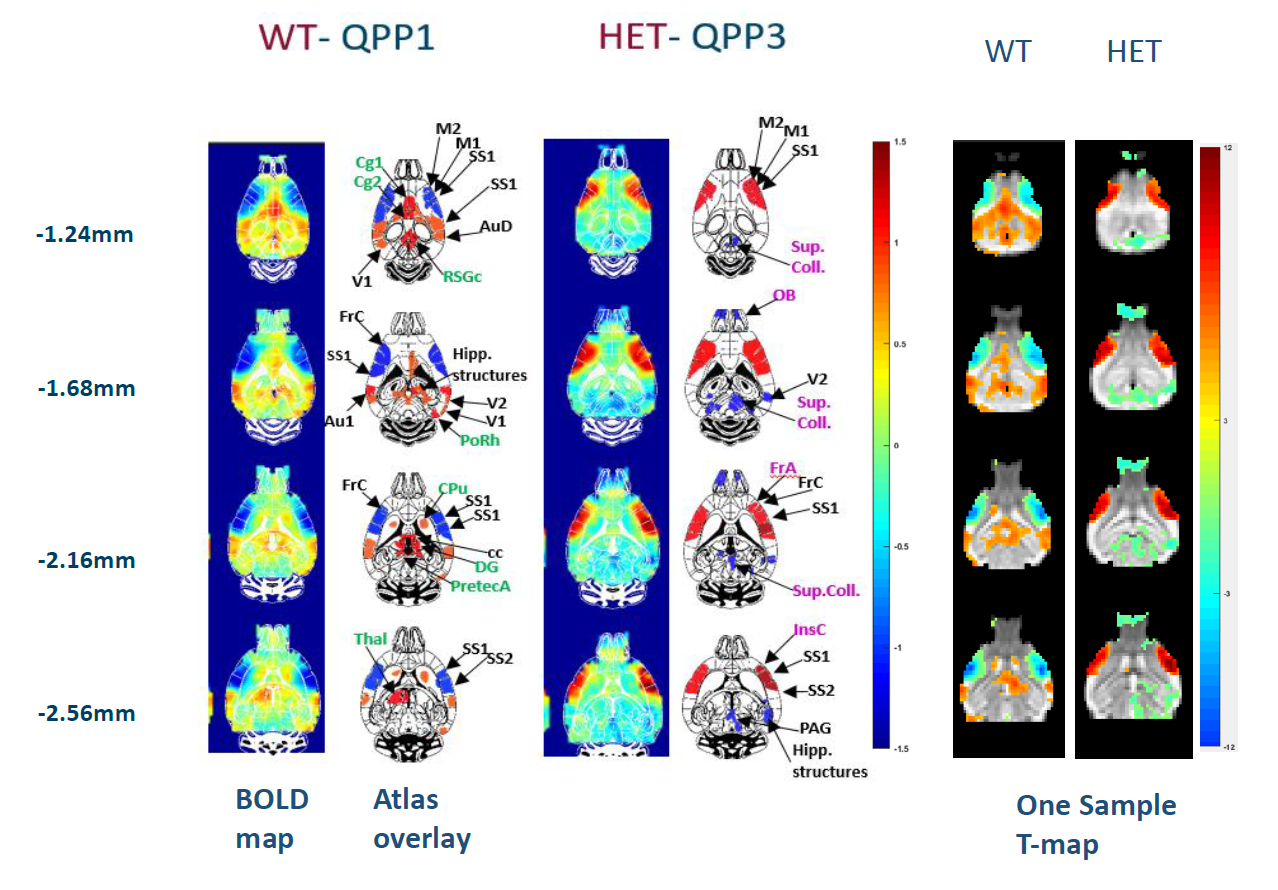
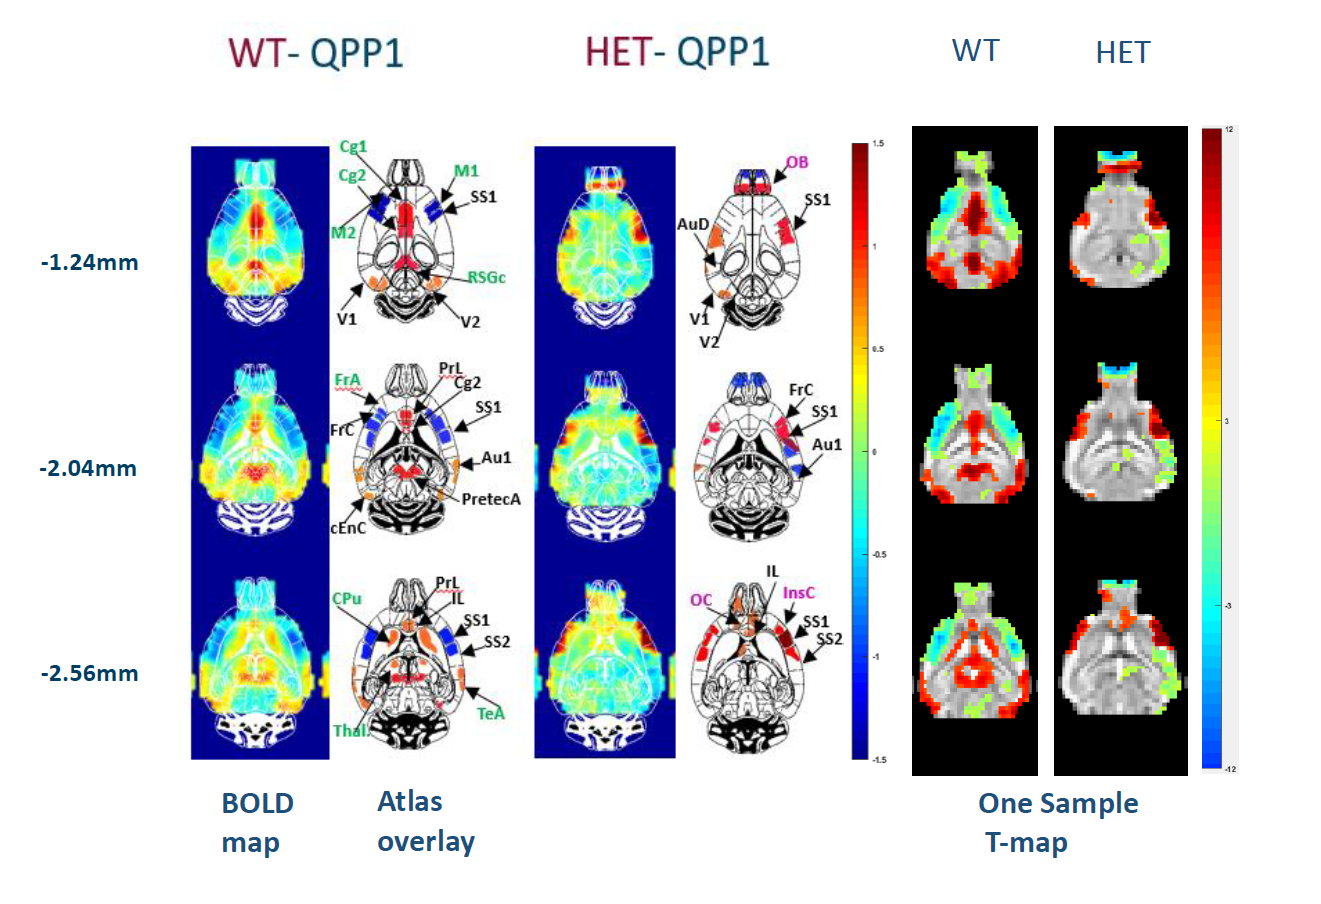
Fig.4: QPP representative pattern segments at different brain
levels for WT and HET at 3 months. Mean BOLD color maps show BOLD activity over
all QPP occurrences. higher (red)/lower (blue) BOLD activity relative to the global mean BOLD signal. The
major ROIs are marked in the adjacent mouse brain atlas overlays - identical
regions (black labels), several regions only in WT (green) or HET QPP (pink);
Corresponding two-tailed one sample T-test maps of the QPP patterns (FDR
corrected, p-value <0.05) for WT and HET mice. Accompanying scale of the
T-maps for both groups.
QPP representative pattern segments at different
brain levels for WT and HET at 12 months. Mean BOLD color maps show BOLD
activity over all QPP occurrences.higher (red)/lower (blue) BOLD activity relative to the global mean BOLD
signal. The major ROIs are marked in the adjacent mouse brain atlas overlays - identical
regions (black labels), several regions only in WT (green) or HET QPP (pink);
Corresponding two-tailed one sample T-test maps of the QPP patterns (FDR
corrected, p-value <0.05) for WT and HET mice. Accompanying scale of the
T-maps for both groups.