1240
Diminished default mode network connectivity in older individuals is associated with aberrant brain metabolism1The Russell H. Morgan Department of Radiology, Johns Hopkins University School of Medicine, Baltimore, MD, United States, 2Department of Neurology, Johns Hopkins University School of Medicine, Baltimore, MD, United States
Synopsis
Cerebral metabolic rate of oxygen (CMRO2), the rate at which O2 is consumed in the brain, is thought to be a direct index of energy hemostasis and brain health. Recent studies have suggested that CMRO2 is elevated but functional connectivity is declined with age. In this work, we demonstrated the diminished default network was associated with aberrant CMRO2 in older healthy subjects. Network analysis indicated that the increasing amount of CMRO2 was used to compensate for the inefficiency of degraded networks.
Introduction
With age, brain activity and its connectivity undergo profound change. One of the most replicated observations is that functional connectivity in the default mode network (DMN) decreases with age. However, the underlying physiological mechanism of this change is not fully understood. On the other hand, several studies have shown that cerebral metabolic rate of oxygen (CMRO2), the rate of oxygen consumption by the brain, is paradoxically elevated with age1,2. Since oxidative metabolism is the primary form of energy production in the brain and that most of the energy consumed by the brain is used to support neural activity, it is plausible to hypothesize that elevated oxygen consumption and diminished functional connectivity are related. If tested, it would suggest that reduced functional connectivity in aging can be attributed to the notion that the brain is overly active and that the inhibitory neural system may be insufficient thereby brain activation becomes less specific (i.e. the de-differentiation hypothesis brain aging3,4). Therefore, in this work, we sought to investigate the relationship between functional connectivity and brain metabolism, two complementary aspects of brain activity, in a group of 116 cognitively normal older participants.Methods
Participants116 cognitively normal elderly subjects (Male/Female: 41/75; Age: 68.65 ± 8.50 yrs, range 34-89 yrs) from a longitudinal cohort of BIOCARD (Biomarkers for Older Controls at Risk for Dementia) study were recruited. All subjects were studied on a 3T Philips System.
MRI Experiment
CMRO2 was quantified based on the Fick principle of arteriovenous difference in oxygen content CMRO2 = CBF×(Ya−Yv)×Ch, where CBF is cerebral blood flow; Ya and Yv are oxygen saturation percentage in arterial and venous blood, respectively; Ch is a constant representing the capacity of blood to carry O2.
In the above equation, global CBF was quantified with phase-contrast MRI and normalized by the brain volume. Acquisition parameters of phase-contrast MRI included: FOV = 200×200mm2 voxel size= 0.5×0.5mm2, velocity-encoding = 40cm/s. Global Yv was measured from the superior sagittal sinus (SSS) using a T2-relaxation-under-spin-tagging (TRUST) MRI with the following parameters TR=3s, TI=1.02s and scan time=1.2min5. Ya was assumed to be 0.98.
BOLD fMRI data were collected using the following parameters voxel size = 3.3×3.3×3.3mm3, TR/TE= 3000/30ms and flip angle = 75°, scan time 7 minutes.
Image Processing
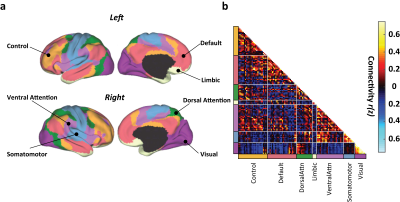
The BOLD images were subjected to standard resting-state data preprocess. The preprocessed BOLD images were parcellated into 114 ROIs (Figure 1a) and were grouped into 7 functional connectivity (FC) networks (Figure 1b) based on an established atlas6. Cross-correlation coefficients were calculated between all pairs of ROIs after factoring out nuisance covariates. To quantify network-wise FC strength, the FC matrix was averaged over the ROI pairs within the same network. Seed-based analysis was also performed by placing a seed in major brain nodes. Additionally, network properties, including modularity, global efficiency, and cluster coefficient, were computed for individual network based on graph theory7.
Statistics
A multi-linear regression model was used to examine the relationship between FC strength (dependent variable) and CMRO2 (independent variable). Age and sex were included as covariates.
Results and Discussion
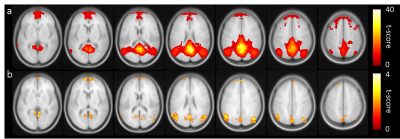
Figure 1b shows the group-averaged functional connectivity matrix, illustrating the segregation of the brain ROIs into 7 networks. Table 1 summarizes the associations between within-network FC and CMRO2. In the default mode network (DMN), FC and global CMRO2 revealed a significantly negative association (Bonferroni corrected p=0.02, uncorrected p=0.003). Older individuals with a weaker DMN FC tend to have a higher brain oxygen metabolic rate. The DMN FC also showed an age decrease, consistent with previous reports8. FC in other brain regions did not reveal an association with global CMRO2.Next, we examined, within the DMN, which brain regions had the strongest association with CMRO2. We placed a seed in the posterior cingulate cortex (PCC) and obtained connectivity map for each individual. Voxel-wise multi-linear analysis between FC and CMRO2 was then performed (with age and sex as covariates). The results are shown in Figure 2. FC in all major regions in DMN, including prefrontal cortex, posterior cingulate cortex, and angular gyrus, showed voxels that are negatively correlated with CMRO2. Given the important role of default mode network in brain aging and neurodegenerative diseases9,10, our results suggested that CMRO2 may also be a useful marker in dementia.
We also assessed how network properties of DMN may be related to CMRO2 (Table 2). Network modularity indicates the extent to which nodes of the same network cluster together but are separate from nodes of other networks. Age is known to be associated with reduced modularity8, a finding also noted in our data (Table 2). We observed that individuals with lower DMN modularity tended to have a higher CMRO2 (Table 2), consistent with the notion that diminished FC is associated with hypermetabolism in older individuals. Another network property, efficiency, indicated the strength of intra-network connectivity, which was also negatively associated with CMRO2. It suggested that hypermetabolism can be attributed to the inefficient energy use within brain network.
Conclusion
Findings from this work suggest that, with age, the brain activity may become non-specific, resulting in excessive but inefficient energy use, which may further damage cellular metabolic machinery and lead to neurodegeneration.Acknowledgements
No acknowledgement found.References
1. Lu H, Xu F, Rodrigue KM, Kennedy KM, Cheng Y, Flicker B, Hebrank AC, Uh J, Park DC. Alterations in cerebral metabolic rate and blood supply across the adult lifespan. Cereb Cortex 2011;21:1426-1434.
2. Peng SL, Dumas JA, Park DC, Liu P, Filbey FM, McAdams CJ, Pinkham AE, Adinoff B, Zhang R, Lu H. Age-related increase of resting metabolic rate in the human brain. Neuroimage 2014;98:176-183.
3. Park DC, Polk TA, Park R, Minear M, Savage A, Smith MR. Aging reduces neural specialization in ventral visual cortex. Proc Natl Acad Sci U S A 2004;101:13091-13095.
4. Park J, Carp J, Kennedy KM, Rodrigue KM, Bischof GN, Huang CM, Rieck JR, Polk TA, Park DC. Neural broadening or neural attenuation? Investigating age-related dedifferentiation in the face network in a large lifespan sample. J Neurosci 2012;32:2154-2158.
5. Lu HZ, Ge YL. Quantitative evaluation of oxygenation in venous vessels using T2-Relaxation-Under-Spin-Tagging MRI. Magnetic Resonance in Medicine 2008;60:357-363.
6. Yeo BT, Krienen FM, Sepulcre J et al. The organization of the human cerebral cortex estimated by intrinsic functional connectivity. J Neurophysiol 2011;106:1125-1165.
7. Rubinov M, Sporns O. Complex network measures of brain connectivity: Uses and interpretations. Neuroimage 2010;52:1059-1069.
8. Betzel RF, Byrge L, He Y, Goni J, Zuo XN, Sporns O. Changes in structural and functional connectivity among resting-state networks across the human lifespan. Neuroimage 2014;102 Pt 2:345-357.
9. Pasquini L, Benson G, Grothe MJ, Utz L, Myers NE, Yakushev I, Grimmer T, Scherr M, Sorg C, Initi AsDN. Individual Correspondence of Amyloid-beta and Intrinsic Connectivity in the Posterior Default Mode Network Across Stages of Alzheimer's Disease. J Alzheimers Dis 2017;58:763-773.
10. Buckner RL, Sepulcre J, Talukdar T, Krienen FM, Liu HS, Hedden T, Andrews-Hanna JR, Sperling RA, Johnson KA. Cortical Hubs Revealed by Intrinsic Functional Connectivity: Mapping, Assessment of Stability, and Relation to Alzheimer's Disease. Journal of Neuroscience 2009;29:1860-1873.
Figures

Figure 1. Group-averaged FC matrix organized by resting-state networks. (a) The brain was parcelled into 114 regions grouped into 7 networks (Yeo et al., 2011). (b). Averaged FC matrix over 116 subjects.


