1237
Disrupted Small-World Networks and Differences in Metabolite Concentration in Healthy Adults with Low and High Genetic Risk1Department of Diagnostic Radiology, The University of Hong Kong, Hong Kong, Hong Kong, 2Alzheimer's Disease Research Network, Hong Kong, Hong Kong, 3State Key Laboratory of Brain and Cognitive Sciences, Hong Kong, Hong Kong, 4Department of Educational Psychology, the Chinese University of Hong Kong, Hong Kong, Hong Kong, 5Department of Social Work and Administration, The University of Hong Kong, Hong Kong, Hong Kong, 6Department of Biochemistry, The University of Hong Kong, Hong Kong, Hong Kong, 7Philips Healthcare, Hong Kong, Hong Kong, 8Alzheimer Disease Research Centre, University of Pittsburgh, Pittsburgh, PA, United States
Synopsis
To identify the relationship between the topological properties and glutamate in genetic-related subgroups (ApoE4 carriers and non-ApoE4 carriers), combined resting state fMRI (rs-fMRI) and MRS were applied in this study. Graph theory metrics of subgroups were calculated and compared. In the results, ApoE4 carriers had worse network segregation and integration. However, there was significant correlation between [Glx]abs in left hippocampus and topological metrics in high-risk group. We postulated that glutamatergic synaptic transmission modulates rs-fMRI activities in ApoE4 carriers.
Introduction
Genetic risk is a risk factor of AD, but how to identify the differences of neurodegenerative changes between normal and early Alzheimer’s disease (AD) is still a question to be answered.1 As a high risk genetic factor, Apolipoprotein E4 (ApoE4) carriers accounted for over 65% of AD.2 Many clinical studies found that ApoE4, as the most neurotoxic isoform, could induce neuropathology through couples of cellular pathways.3 The aim of our study is to investigate the neuronal and biochemical mechanisms underlying this genetic risk. Resting state functional MRI (rs-fMRI) depicts blood oxygenation level dependent (BOLD) neuronal activities in the resting state. Graph theory is a method which detects the differences of the properties of small-world network of neuronal connections, which could be modulated by glutamatergic system in the hippocampus.Methods
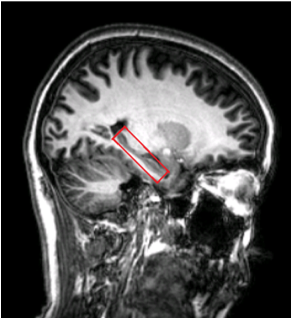
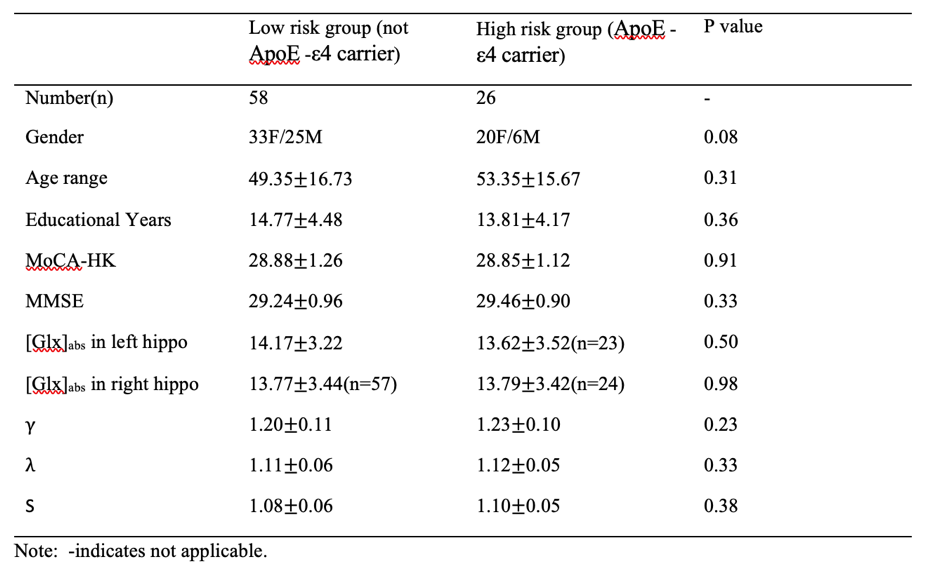
In total 91 healthy, cognitively normal subjects (age: from 20 to 84, average:51±16.6 years old, gender:58F/33M) were studied. Seven subjects were excluded due to the excessive head motion during scanning. All subjects underwent an MRI examination with a Phlips-3T MR scanner using a standard 8 channel head coil. Structural images were acquired with 3D fast field echo sequence (3D-T1-FFE sagittal, TR=7ms, TE=3.2ms, Flip angle=8, voxel size=111). Functional images were collected by using a gradient-echo echo-planar sequence (parameters: TR=2000ms, TE=30ms, flip angle=90, voxel size=3×3×4) sensitive to blood-oxygen-level-dependent (BOLD) contrast. During the functional scanning, participants were instructed to open their eyes to watch the cross in the mirror and not to think of anything. Single Voxel Spectroscopy (SVS) was performed on left and right hippocampus (Fig. 1) with the following parameters (TR/TE=2,000/39 ms, number of signals averaged=128, phase cycles=16, spectral width=2,000 Hz with spectral resolution of 1.95 Hz per point, and free induction decay=1024). Absolute concentration of Glx ([Glx]abs) (summation of glutamate and glutamine) was measured and quantified using internal water as reference by QUEST in jMRUI (4.0) with cerebrospinal fluid, grey matter and white matter water content corrected.The analysis of fMRI data was performed using the Data Processing Assistant for Resting-State fMRI (DPARSF) and Statistical Parametric Mapping (SPM12). Based on the Automated Anatomical Labeling(AAL) template4, the preprocessed fMRI data were segmented into 90 regions (each hemisphere has 45 regions). For every individual subject, the regional time series was obtained by averaging the time series over all voxels of this region. We applied the Fisher Z-Transformation to covert the correlation coefficients so that the data became normally distributed. Then the transformed FC matrix was used to perform the small-world network. We respectively calculated the small-world properties of the ApoE4 carriers and non-ApoE4 carriers with connection densities from 37% to 50%5. In the analysis, the cost of the network below 37% would start to fragment, and more than 50% the network becomes more random. The 90×90 FC matrix consisted of a collection of undirected vertices(nodes) and edges(links) between pairs of vertices. The properties considered were computed using brain connectivity toolbox (BCT, http://www.brain-connectivity-toolbox.net/).
Hub is the centrality identified region with high degree of connectivity to other parts of the brain. The local betweenness centrality and local degree were applied together to pick out the hubs of a network.6 The values of the two indexes were averaged between two hemispheres and then were ranked in descending order respectively. The top 20% of sum of the ranking score were selected as the network hubs.
The relationships between topological measurements (clustering coefficients and characteristic path length of hubs) and [Glx]abs in the left and right hippocampus were estimated based on the Pearson correlation method in SPSS package (SPSS Inc., Chicage, USA).
Results
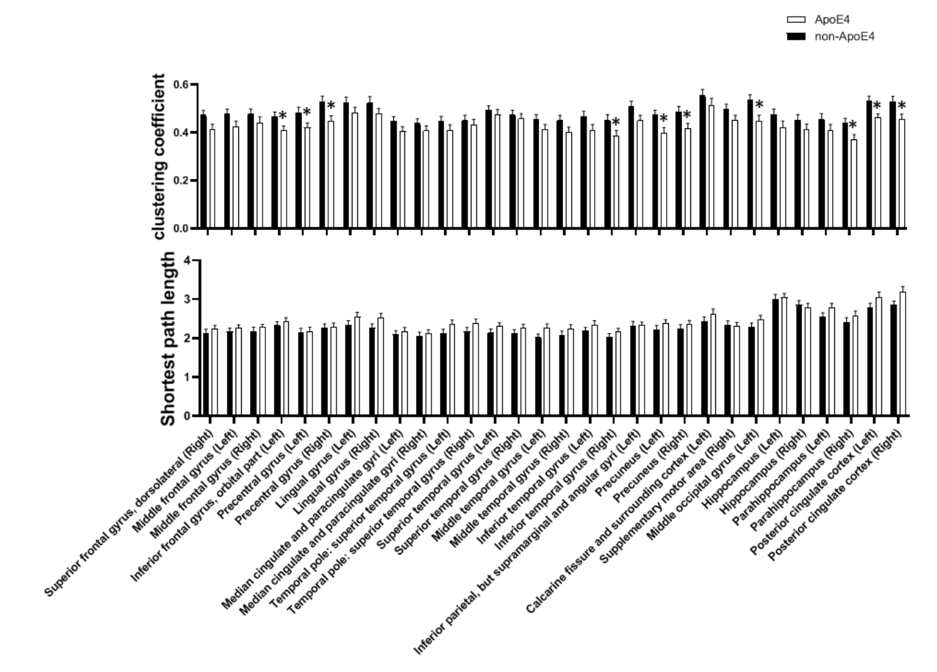
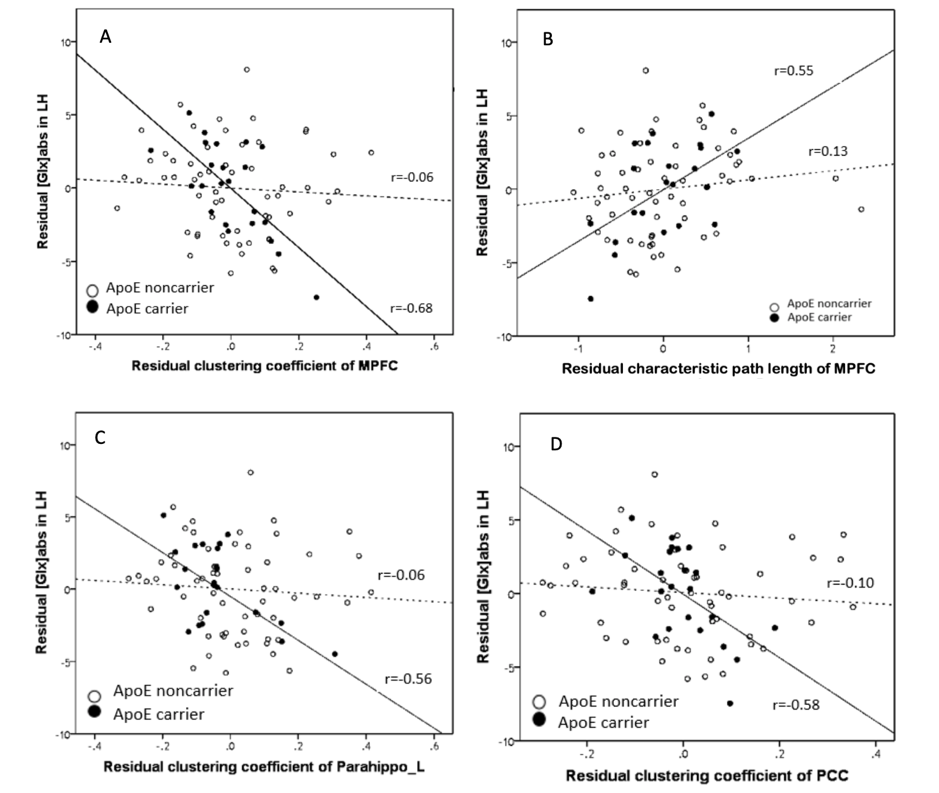
The significant differences in function were found in cluster coefficients in hubs of right inferior frontal gyrus, bilateral precentral gyrus, right inferior temporal gyrus, bilateral precuneus, occipital region, right parahippocampus and bilateral posterior cingulate cortex (PCC). No significant difference was detected in the characteristic path length, but an increased trend of path length could be detected in the carriers (Figure 2). ApoE4 carriers had worse network segregation and possibly integration. In addition, there is significant relationship between [Glx]abs in left hippocampus and topological metrics in high-risk but not low risk group (Figure 3)., i.e. between the [Glx]abs in left hippocampus and clustering coefficient of MPFC (ApoE carrier: r=-0.68, p=0.001*; ApoE noncarrier: r=-0.06, p=0.696), characteristic path length of MPFC (ApoE carrier: r=0.55, p=0.012*; ApoE noncarrier: r=0.13, p=0.368), clustering coefficient of left parahippocampus (ApoE carrier: r=-0.56, p=0.012*; ApoE noncarrier: r=-0.06, p=0.674) and clustering coefficient of PCC(ApoE carrier: r=-0.58, p=0.009*; ApoE noncarrier: r=-0.10, p=0.507).Discussion and conclusion
Small-world network represented the balance of local segregation and global integration in a real network compared to a random network7. The results suggested that ApoE ε4 carriers exhibited poorer local interconnectivity. It is tempting to speculate that the function of the brain networks could be affected by the genetic variations. Moreover, the close relationship between glutamate and topological properties in ApoE ε4 carriers might reflect the compensation of the impaired cortical communication efficiency.Acknowledgements
This work was supported by Research Grants Council of Hong Kong (GRF grant number: 17108315) and the State Key Laboratory of Brain and Cognitive Sciences, the University of Hong Kong.References
1. West MJ, Coleman PD, Flood DG, Troncoso JC. Differences in the pattern of hippocampal neuronal loss in normal ageing and alzheimer's disease. The Lancet. 1994;344:769-772
2. Huang Y. Roles of apolipoprotein e4 (apoe4) in the pathogenesis of alzheimer's disease: Lessons from apoe mouse models. Biochem Soc Trans. 2011;39:924-932
3. Mahley RW, Huang Y. Apolipoprotein e sets the stage: Response to injury triggers neuropathology. Neuron. 2012;76:871-885
4. Tzourio-Mazoyer N, Landeau B, Papathanassiou D, Crivello F, Etard O, Delcroix N, et al. Automated anatomical labeling of activations in spm using a macroscopic anatomical parcellation of the mni mri single-subject brain. Neuroimage. 2002;15:273-289
5. Lynall ME, Bassett DS, Kerwin R, McKenna PJ, Kitzbichler M, Muller U, et al. Functional connectivity and brain networks in schizophrenia. J Neurosci. 2010;30:9477-9487
6. Xu X, Hui ES, Mok MY, Jian J, Lau CS, Mak HK. Structural brain network reorganization in patients with neuropsychiatric systemic lupus erythematosus. AJNR Am J Neuroradiol. 2017;38:64-70
7. Brown JA, Terashima KH, Burggren AC, Ercoli LM, Miller KJ, Small GW, et al. Brain network local interconnectivity loss in aging apoe-4 allele carriers. Proc Natl Acad Sci U S A. 2011;108:20760-20765
Figures