1235
Simultaneous fMRI and multi-channel, spectrally resolved fiber-photometry reveals the neural basis of default mode network modulation in rats1University of North Carolina at Chapel Hill, Chapel Hill, NC, United States
Synopsis
This study establishes a novel MR-compatible multi-channel fiber-photometry platform and demonstrates 1) photometry-CBV measured in PrL and Cg co-fluctuate with global DMN signal derived from CBV-fMRI, 2) significantly enhanced 0.6-0.8 Hz GCaMP power in PrL, Cg, and RSC, but not AI, between two DMN states, 3) significantly enhanced 0.25-0.45 Hz GCaMP power in PrL, Cg and RSC precedes DMN activation peak by 3-5 s, but not AI, and 4) significantly enhanced 0.6-0.8 Hz GCaMP power in AI precedes DMN deactivation valley by 11 s.
Introduction:
Non-invasive fMRI has revolutionized our understanding of macroscopic functional brain organization[1,2]. However, the inherent constraints of current fMRI methodologies limit our ability to probe the mechanisms underlying brain networks. The overarching goal of this project is to shed light on the cellular and circuit mechanisms underlying the dynamic functional organization of the default-mode network (DMN) – a large-scale brain system that is crucial for a wide range of behaviors[3,4]and has similar functional organization across humans, non-human primates and rodents[5-12]. In both humans and animals, the DMN is anchored in the medial prefrontal cortex/prelimbic region (PrL), cingulate cortex (Cg) and retrosplenial cortex (RSC), and these nodes are reportedly anti-correlated with the anterior insula (AI) during tasks[5]. Understanding DMN functional topology across species would enable us to causally model and make predictions about brain states, and bring insight into the network basis of behaviors and neuropsychiatric disorders[7,13-15]. To probe the DMN, we implemented a multi-channel, spectrally resolved fiber-photometry platform and measured neuronal activity via a genetically encoded calcium indicator (GCaMP) and hemodynamics via a blood-pool contrast agent (Rhodamine B), in four distinct brain regions in real-time. We took an empirical approach and implanted optical fibers to PrL, Cg, RSC, and AI of Thy1-GCaMP6f transgenic rats, conducted concurrent fMRI-photometry recordings during resting-state, and performed a series of time-frequency analyses to reveal causal relationships between cellular output activities in these brain areas and DMN derived from hemodynamic measurement.Methods:
Adult Thy1-GCaMP6f transgenic rats were used in this study. Optical fibers were implanted in 3 DMN nodes – PrL (AP=3.2mm, ML=0.7mm, DV=4.5mm), Cg (AP=1.7mm, ML=0.7mm, DV=2.0mm) and RSC (AP=-2.2mm, ML=0.4mm, DV=0.8mm). An additional optical fiber was implanted in the AI (AP=3.2mm, ML=4.2mm, DV=3.5mm). All recordings began one week after fiber implantation. Rhodamine B isothiocyanate–Dextran was injected intravenously for CBV measurements (40mg/kg). All fMRI data were collected on a Bruker 9.4T MRI using a custom RF coil. Each rat was endotracheally intubated for ventilation, and body temperature, ETCO2, heart rate, and oxygen saturation were continuously monitored and maintained within normal ranges. Dexmedetomidine (0.05mg/kg/hr) and rocuronium (5mg/kg/hr) were continuously infused and supplemented with 0.5% isoflurane to maintain proper sedation.Results & Discussion:
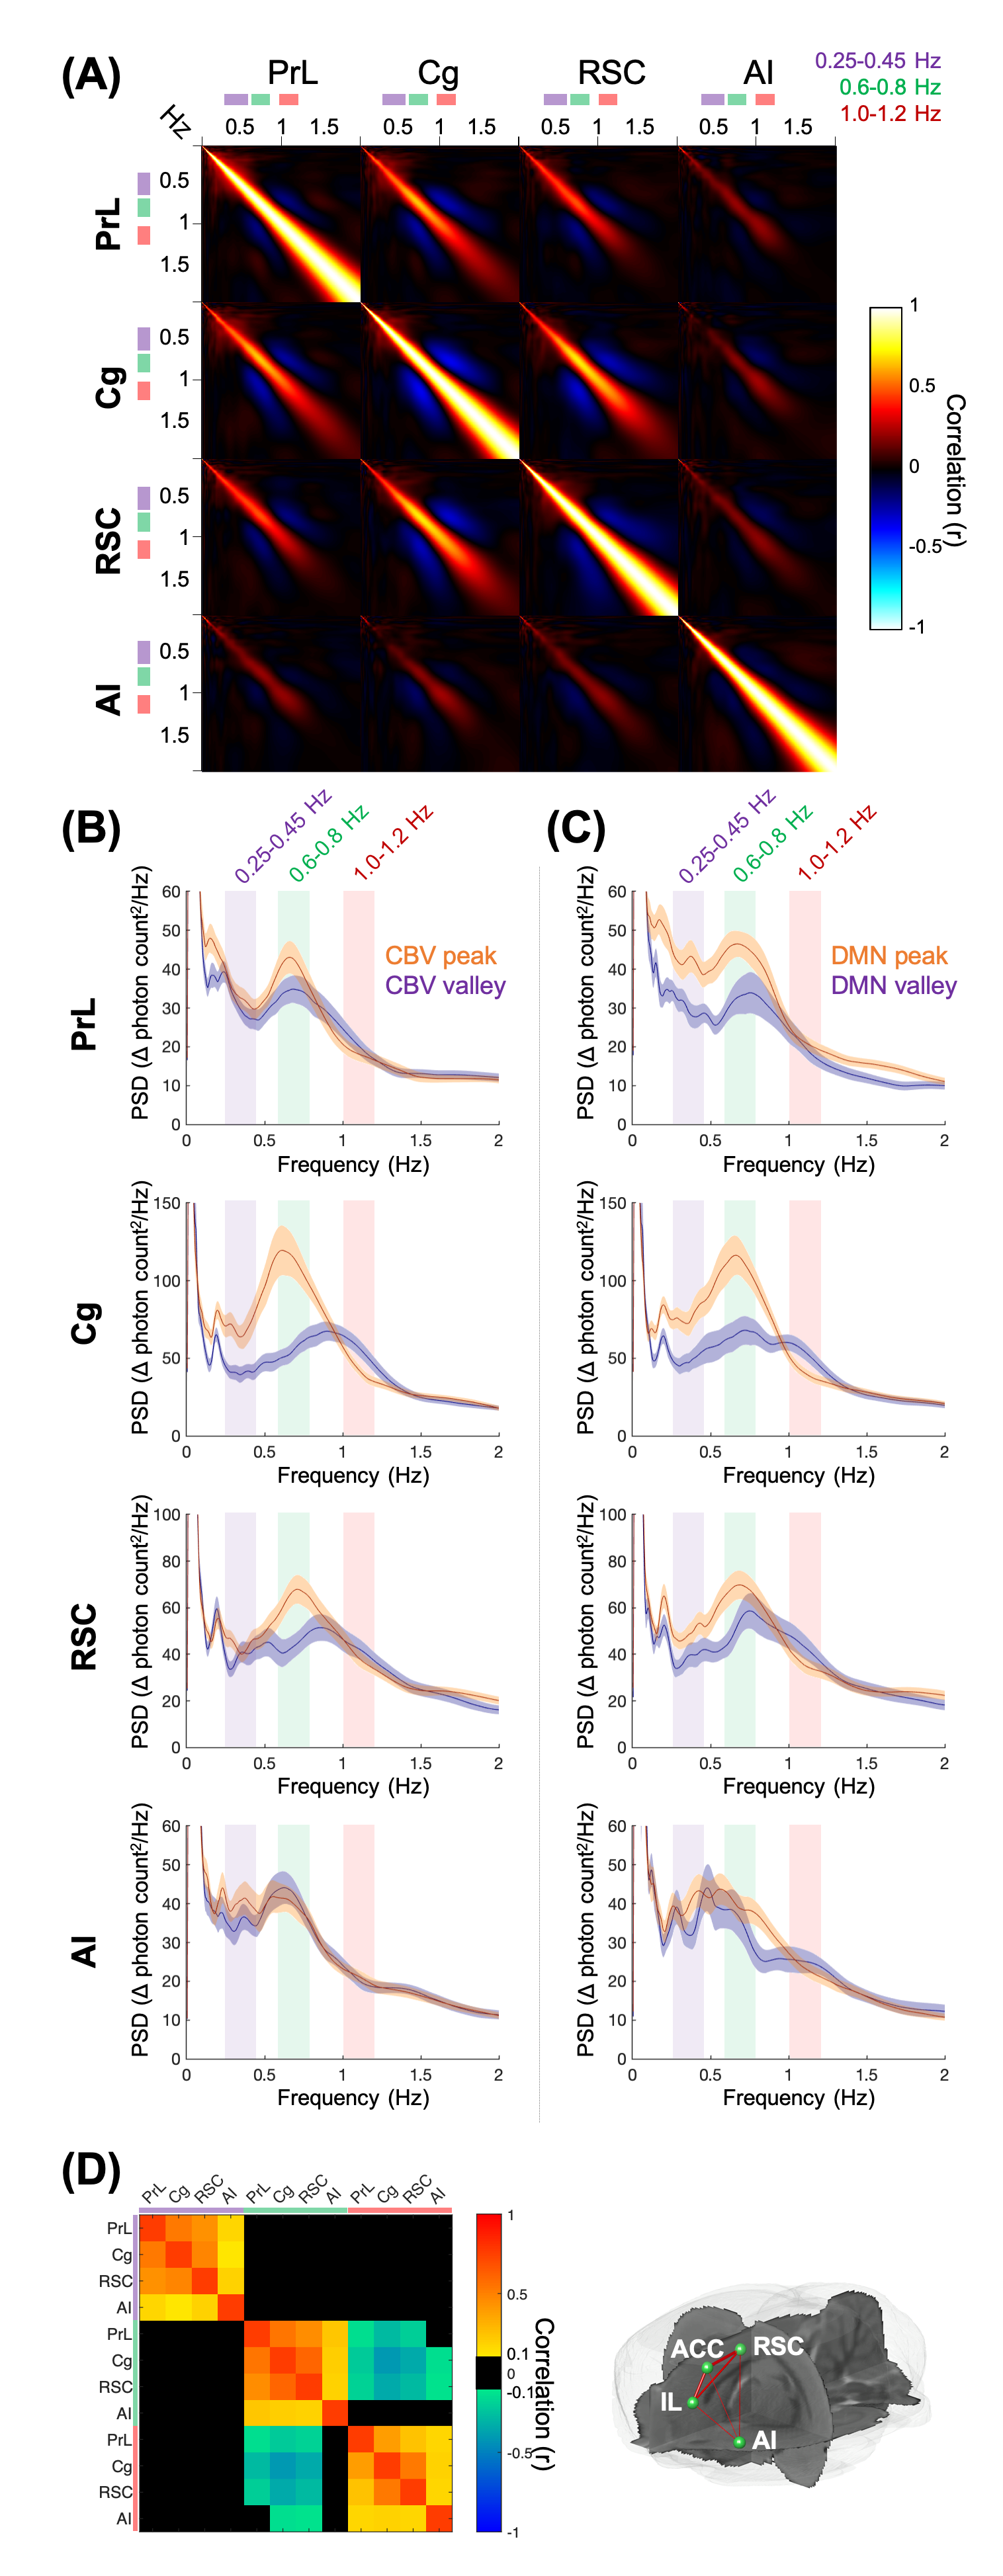
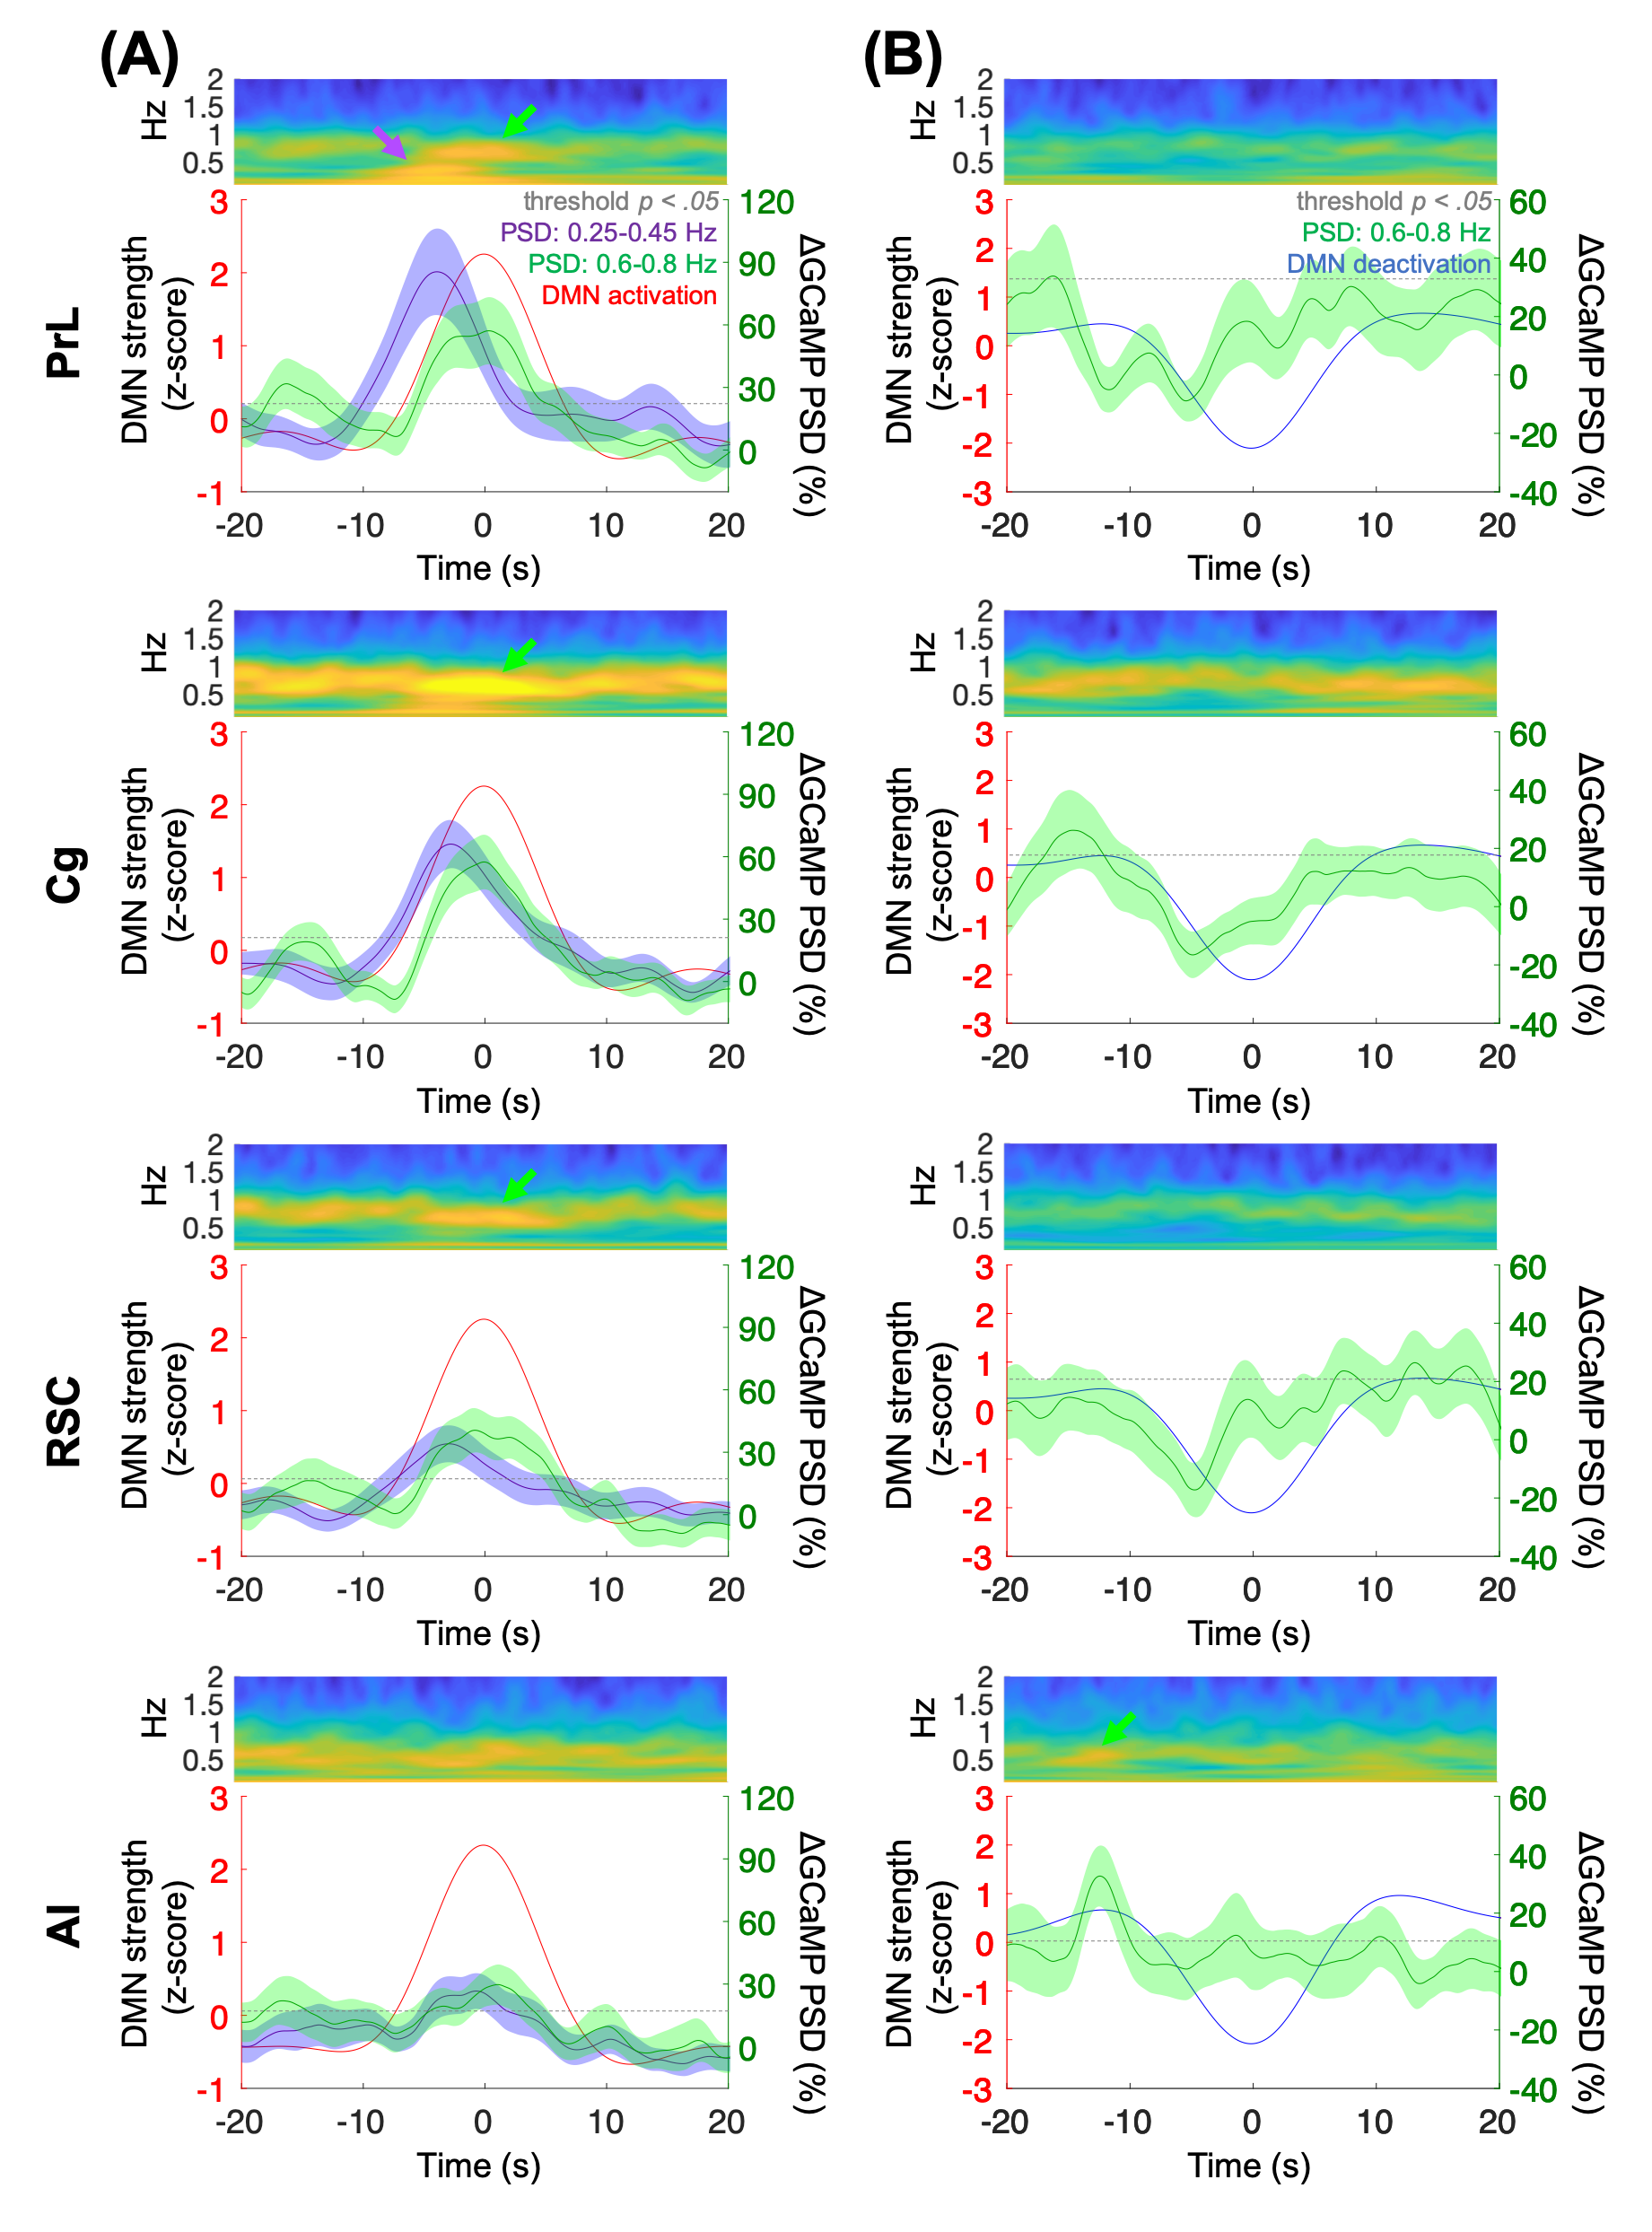
FFig.1 shows the multi-channel, spectrally resolved fiber-photometry platform, targeted network nodes, and representative GCaMP6f and Rhodamine B spectra representing neuronal activity and hemodynamic response, respectively. Using this platform, we performed concurrent CBV-fMRI and photometry recordings in rats underwent established animal preparation protocol known to exhibit DMN[16]. We extracted DMN fluctuations (black traces, Fig.2B) via a mask derived from seed-based analysis (Fig.2A) – a method commonly used in the literature[17]. Fig.2B also shows representative, raw photometry-CBV data (red traces) from each fiber location and their respective correlations with DMN fluctuations. Corresponding GCaMP power changes computed from a wavelet-based time-frequency analysis are also displayed. We reported significant correlations between DMN fluctuations and photometry-CBV in PrL and Cg, but not RSC and AI. The high correlations indicate that photometry signal measured at select locations can be used as a surrogate measure of the DMN from fMRI. Next, we showed the GCaMP cross-frequency correlation within and between the four measured areas (Fig.3A). Based on this matrix we identified three frequency bands of interest due to their prevalent positive and negative correlations (0.25-0.45Hz, 0.6-0.8Hz, and 1.0-1.2Hz). Fig.3B summarizes the GCaMP power spectra at PrL, Cg, RSC, and AI at local CBV peaks and valleys. Under distinct local CBV states, we observed significant dissociations between GCaMP power at 0.6-0.8Hz in all DMN nodes (PrL, Cg, and RSC). This data also indicates strong GCaMP-neurovascular coupling at 0.6-0.8Hz. We then computed DMN activation and deactivation from photometry-CBV in DMN nodes and similarly extracted corresponding GCaMP power spectra (Fig.3C). Interestingly, we found significantly augmented GCaMP power in PrL at a lower frequency band during DMN activation which was not observed in Fig.3B (0.25-0.45Hz). Fig.3D shows a GCaMP correlation matrix among the sampled areas and their power bands. While strong positive correlations were observed among DMN nodes in all three selected frequency bands, apparent anti-correlations were observed when comparing 0.6-0.8Hz to 1.0-1.2Hz GCaMP power within DMN nodes. These data imply that two distinct functional clusters might exist – one switching between two anti-correlated firing states (i.e., 0.6-0.8Hz and 1.0-1.2Hz), and the other operating more independently under the frequency of 0.25-0.45Hz. To better understand the causal role of the aforementioned functional clusters to DMN, we then performed additional analyses to extract peri-event time-frequency signal changes. The two distinct functional clusters are also visible in the time-frequency spectrogram centered to DMN activation (see two arrows in Fig.4A). Our results demonstrated that significantly enhanced 0.25-0.45Hz GCaMP power in PrL, Cg and RSC precedes DMN activation peak by 3-5s, but not AI, and that significantly enhanced 0.6-0.8Hz GCaMP power in Cg and AI precedes DMN deactivation valley by 11s (Fig.4). Because GCaMP measures only neuronal outputs, but not synaptic inputs, our data highlights the causal role of selected cellular outputs activities on DMN activation. Our results also confirmed the widely hypothesized role of AI in antagonizing DMN activity[18].Acknowledgements
We thank UNC CAMRI members for their helpful discussions and critiques. This work is supported in part by NIH grants RF1MH117053, R01MH111429, R01NS091236, P60AA011605, and U54HD079124.References
1. Bressler SL, and Menon V. Large-scale brain networks in cognition: emerging methods and principles. Trends Cogn Sci 14, 277, (2010).
2. Glasser MF et al. The Human Connectome Project's neuroimaging approach. Nat Neurosci 19, 1175, (2016).
3. Sridharan D, Levitin DJ & Menon V. A critical role for the right fronto-insular cortex in switching between central-executive and default-mode networks. PNAS 105, 12569, (2008).
4. Menon V. Large-scale brain networks and psychopathology: a unifying triple network model. Trends Cogn Sci 15, 483, (2011).
5. Raichle ME, The brain’s default mode network. Annu Rev Neurosci 35:433, (2015).
6. Lu H et al. Rat brains also have a default mode network. PNAS 109, 3979, (2012).
7. Hsu LM et al., Constituents and functional implications of the rat default mode network. PNAS 113, 4541, (2016).
8. Mantini D et al. Default mode of brain function in monkeys. J Neurosci 31, 12954, (2011).
9. Stafford JM et al., Large-scale topology and the default mode network in the mouse connectome. PNAS 111, 18745-19850, (2014).
10. Gozzi A & Schwarz AJ. Large-scale functional connectivity networks in the rodent brain. Neuroimage 127, 496, (2016).
11. Ma Z and Zhang N, Temporal transitions of spontaneous brain activity. eLife 7:e33562, (2018).
12. Grandjean J et al., Common functional networks in the mouse brain revealed by multi-centre resting-state fMRI analysis. Neuroimage 205:116278 (2019).
13. Seeley W et al. Dissociable intrinsic connectivity networks for salience processing and executive control. J Neurosci 27, 2349, (2007).
14. Menon V. Large-scale brain networks and psychopathology: a unifying triple network model. Trends Cogn Sci 15, 483, (2011).
15. Goodkind, M. et al. Identification of a common neurobiological substrate for mental illness. JAMA psychiatry 72, 305, (2015).
16. Broadwater MA et al., Adolescent alcohol exposure decreases frontostriatal resting-state functional connectivity in adulthood. Addict Biol 23 (2), pp. 810-823 (2018).
17. Van Dijk, KR et al., Intrinsic functional connectivity as a tool for human connectomics: theory, properties, and optimization. J neurophy 103,1, (2010).
18. Zhifeng L et al., Anticorrelated Resting-state Functional Connectivity in Awake Rat Brain. Neuroimage 16; 59(2): 1190–1199. (2012).
Figures
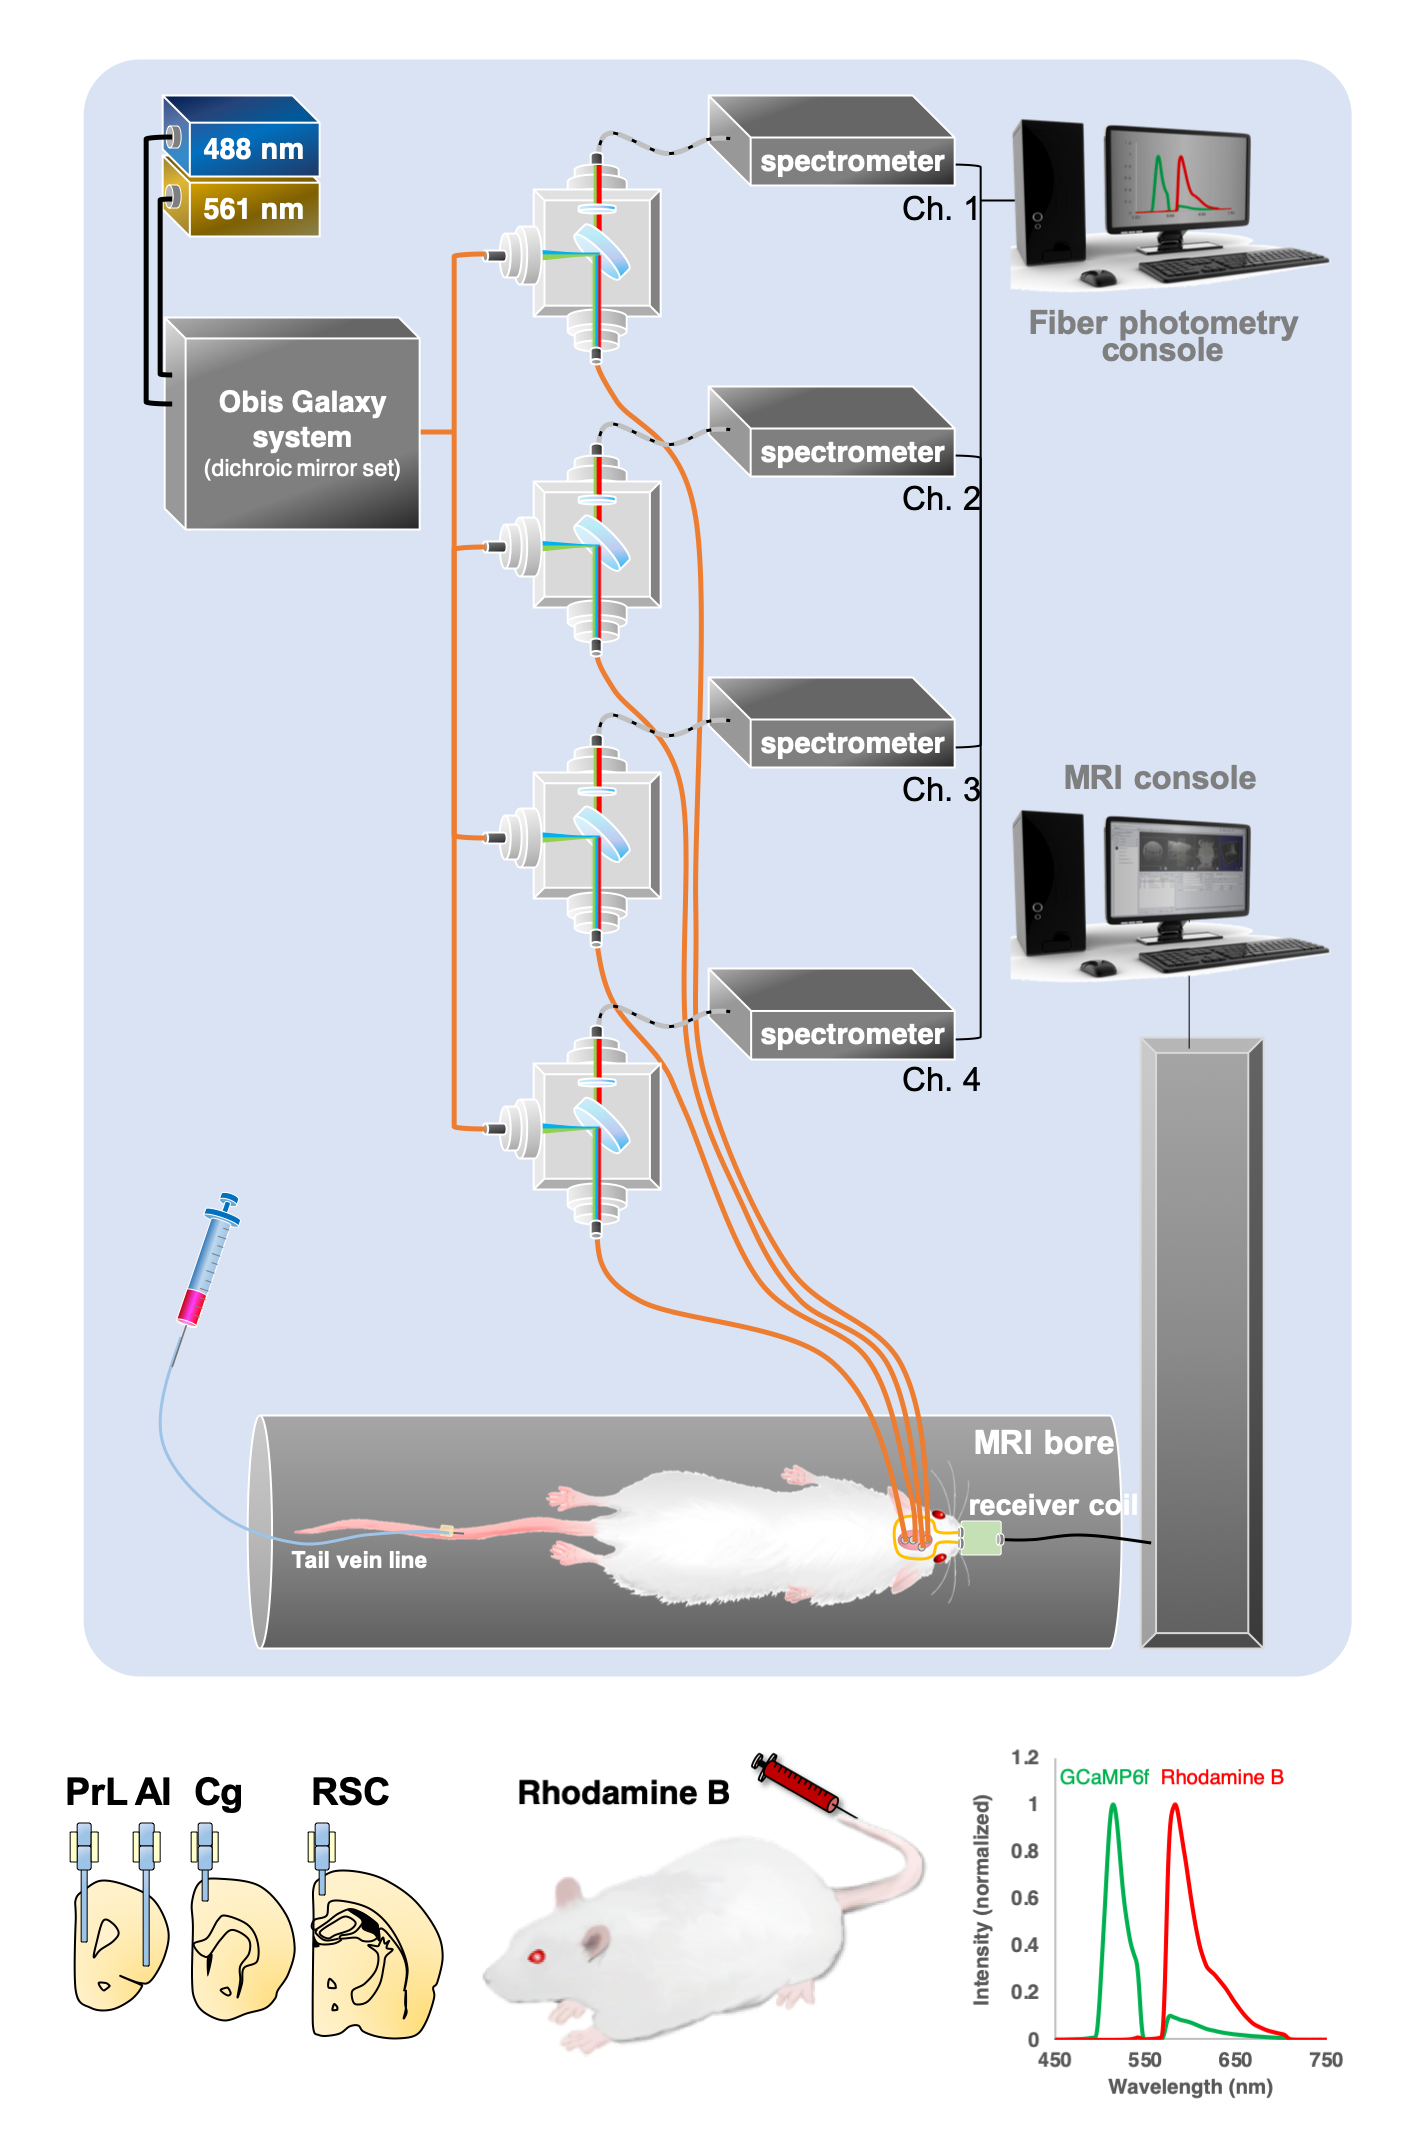
Figure 1. The diagram of our experimental platform. The 488 nm laser is used for GCaMP excitation and optogenetic stimulation, and the 561 nm laser is used for Rhodamine excitation. Combined laser beams launched into the rat via a multimode optic fiber. The emission fluorescent signal travels back through the same fiber and launched into an AR-coated cable to the spectrometer. Targeted network nodes are including PrL, Cg, RSC and AI. The lower right shows the representative GCaMP6f and Rhodamine B spectra representing neuronal activity and hemodynamic response, respectively.
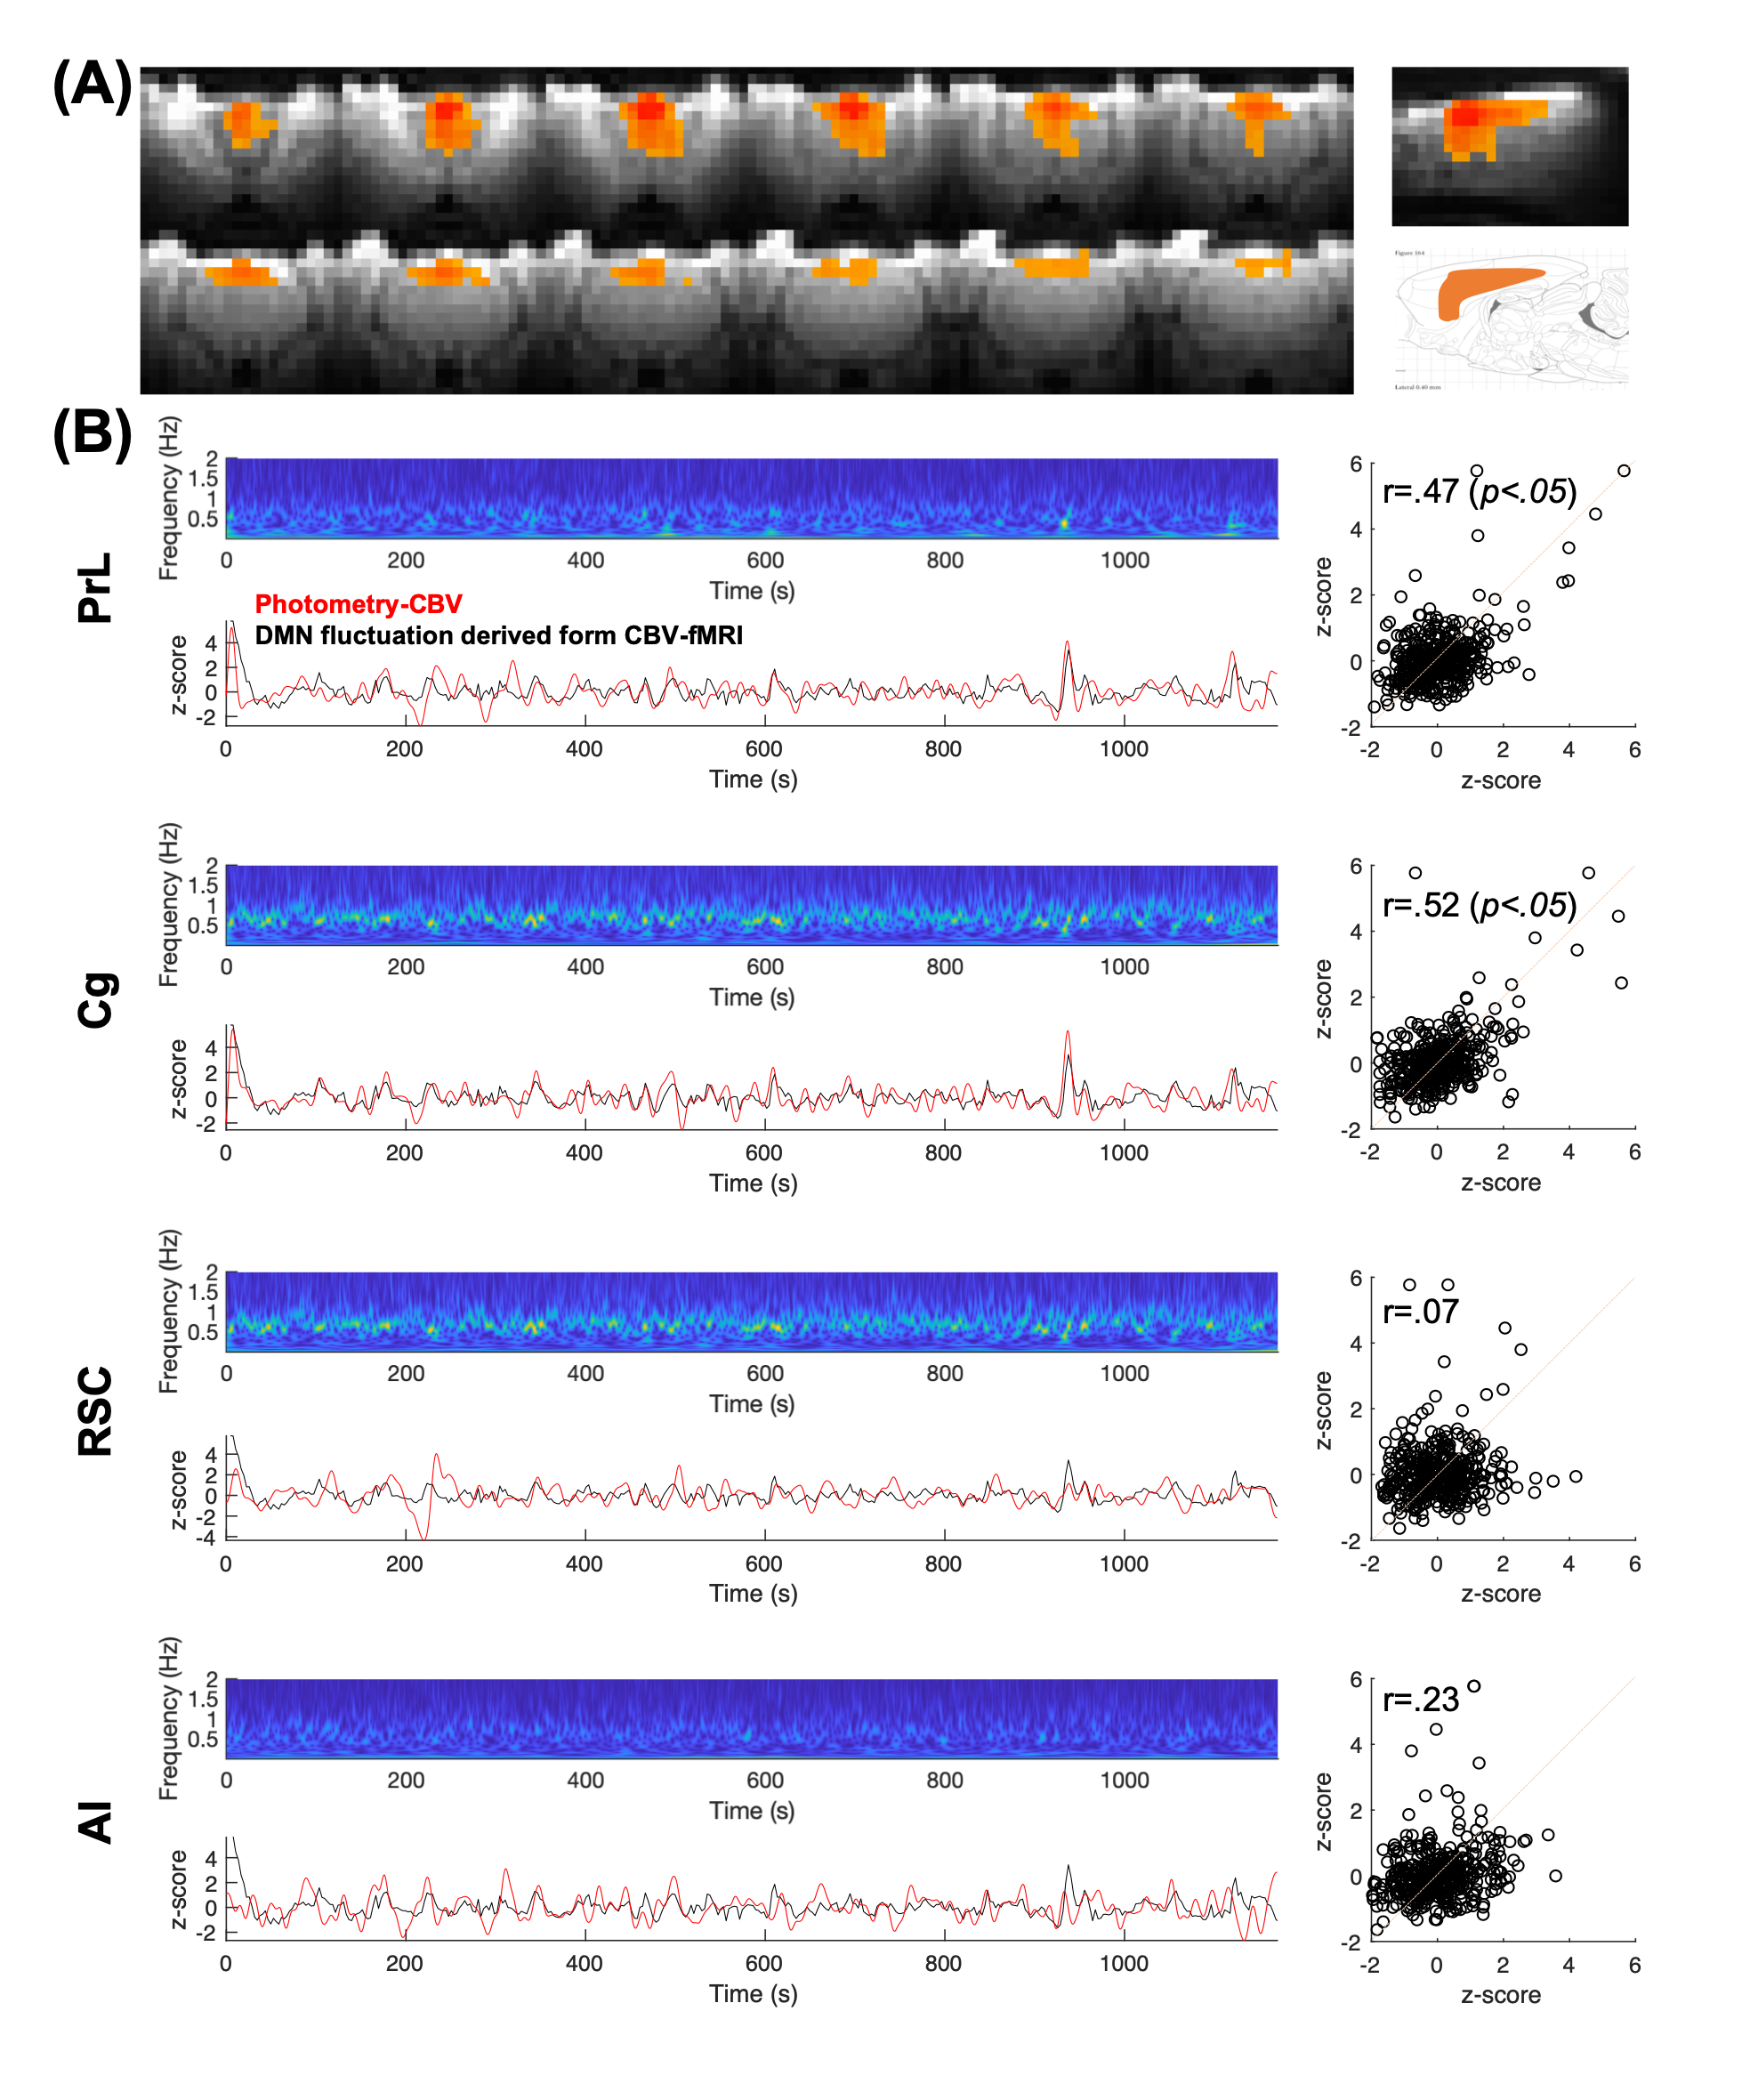
Figure 2. (A) Rat DMN mask was derived using the CBV fluctuation from the seeding region at prefrontal brain area. (B) The DMN fluctuations (black traces) extracted via the mask derived from figure 2A are significantly correlated to photometry-CBV (red traces) in PrL and Cg, but not RSC and AI.