1229
Cortical-depth dependence of pure T2-weighted BOLD fMRI with minimal T2’ contamination using Echo-Planar Time-resolved Imaging (EPTI)1A. A. Martinos Center for Biomedical Imaging, Massachusetts General Hospital, Charlestown, MA, United States, 2Harvard-MIT Health Sciences and Technology, MIT, Cambridge, MA, United States, 33Department of Electrical Engineering and Computer Science, MIT, Cambridge, MA, United States
Synopsis
BOLD fMRI based on T2 contrast has the promise to provide exclusively microvascular specificity, which would optimize the ability of fMRI signals to accurately reflect and localize neuronal activity. However, it is challenging in practice to achieve pure T2 weighting. Here we employ a new highly-efficient acquisition and reconstruction framework based on EPI, Echo-Planar Time-resolved Imaging (EPTI), and extend it to generate blurring- and distortion-free data with purely T2 weighting. We evaluate the technique through a cortical-depth analysis of activation in human visual cortex and demonstrate that it achieves the desired microvascular specificity.
Introduction
Recent studies have suggested that fMRI can be a veridical representation of neuronal activity if one can measure fMRI signals exclusively from the microvasculature. This has led to a renewed interest in evaluating alternative fMRI signals other than standard GE BOLD1-2, such as CBV using non-contrast CBV methods for humans3-4, however the vascular origins of these signals and how they evolve over time is incompletely understood.While it is known that spin-echo BOLD has exclusively microvascular sensitivity, it is not commonly used5 in part because of practical issues—it is extremely difficult to achieve the desired pure T2-weighting, which may be underappreciated2. Common techniques such as spin-echo EPI do not provide pure T2-weighted BOLD because the long echo-train length (ETL) imparts T2′ contamination and an undesirable sensitivity to large blood vessels6-7. 3D-GRASE8-9, a powerful method to generate T2-BOLD, has been applied to high-resolution fMRI2,9,10. However, the refocusing train in 3D-GRASE generates stimulated echoes, introducing T1-weighting that affects the signal2,11, complicating interpretation.
Here we propose to utilize a new acquisition technique, Echo-Planar Time-resolved Imaging (EPTI)12(Fig.1), to provide reconstruct pure spin-echo images with suitably short ETL to eliminate T2′ contamination, providing the desired microvascular specificity. Using a cortical-depth analysis we demonstrate that T2-BOLD with EPTI provides the expected microvascular specificity, and that a graded re-introduction of T2’ effects gradually re-introduces contributions from macrovascular signals.
Methods
Data acquisition: The data was acquired using spin-echo acquisition using 3 EPTI-shot with Rseg=32. Fifty-six echo images can be obtained with a TE increment of 1.08ms. Other imaging parameters: FOV=168×96×22mm3, TR=8.8s, zoomed FOV along PE (AP) with saturation pulse applied. Data were acquired with visual stimulus presentation following a standard block-design paradigm.Image reconstruction: EPTI data were reconstructed using B0-informed k-t GRAPPA to generate a series of distortion-free images at each echo timepoint. The GRAPPA kernel causes small local temporal smoothing, with a FWHM of the correlation of 7–8ms12. This will cause a small amount of T2′ contamination, however it is still within the range of ETLs that would provide microvasculature-dominated BOLD6. The data was also reconstructed using subspace reconstruction that takes advantages of the signal model prior which should provide purer T2 contrast without the need to interpolate along t as in GRAPPA.
Conventional EPI data simulation: EPTI data at different TEs were used to simulate conventional EPI acquisition with different ETL (Fig.2), to simulate cases with different T2* contribution, in order to investigate if a graded re-introduction of T2’ effects re-introduces contributions from macrovascular signals.
Data analysis: Same-session MPRAGE data were used as an anatomical reference and processed with FreeSurfer. GLM analysis was used to identify activated voxels. We performed a standard cortical depth analysis13 of the fMRI data.
7T feasibility data: To evaluate image quality and feasibility of T2-BOLD at 7T, pilot BOLD-weighted EPTI data were acquired on a MAGNETOM Terra (Siemens Healthineers) equipped with the product 32-channel head-only receive coil array (Nova Medical).
Results
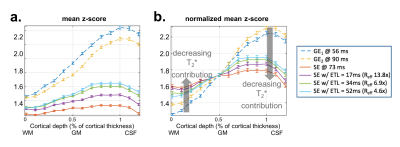
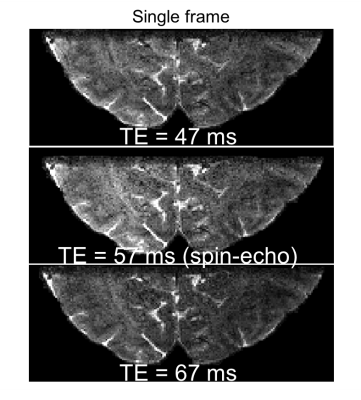
Robust visual responses were detected within the visual cortex (Fig.3). The cortical-depth analysis of the two T2*-BOLD activations (from the same EPTI acquisition, TE=56 and 90ms) exhibited the expected bias to large vessels, manifesting as a depth profile that peaked at the pial surface, while the slope of the T2-BOLD profile was substantially reduced (same EPTI acquisition, TE=73ms). The peak response of the T2-BOLD was also observed at the pial surface, however because these data were acquired at 3T we do expect intravascular BOLD contributions which should introduce some sensitivity to large pial vessels, therefore this peak at the surface may reflect partial volume effects with those large veins.Next we reconstructed the data using the subspace reconstruction approach to further drive down the T2’ contamination. The resulting cortical depth analysis applied to these data, shown in Fig.4, was consistent with that of the standard reconstruction. Profiles from the three selected EPTI echo images along with the simulated conventional SE EPI data with different ETLs, achieved by using different width of data along t, were shown. To test whether the reduced slopes in the presumptive T2-BOLD data is simply due to its lower sensitivity, we normalized the z-scores to the value measured at the mid-cortical depth (Fig. 4b). The slopes of the profiles after normalization are still distinct, with a decreased slope with decreasing T2* contribution (shorter and shorter ETL), as predicted.
To demonstrate the feasibility of this approach at 7T, where intravascular contributions are negligible and microvascular specificity of T2-BOLD is enhanced14-15, we acquired pilot 0.8mm-iso BOLD-weighted EPTI data at 7T (Fig. 5). High image quality was achieved, indicating that this technique can be applied at 7T as well.
Discussion and Conclusions
We have demonstrated the ability of EPTI to generate purely T2-weighted BOLD for high-resolution fMRI with high spatial and moderate temporal resolution. As T2’ contamination is gradually reintroduced we see increased influence of the microvasculature, reproducing findings of a previous study in the macaque visual cortex6. T2-BOLD fMRI experiments utilizing this sequence at 7T where we expect greater microvascular specificity are currently underway.Acknowledgements
This work was supported in part by the NIH NIBIB (grants P41-EB015896, R01-EB019437 and R21-NS106706), by the BRAIN Initiative (NIH NIMH grant R01-MH111419), and by the MGH/HST Athinoula A. Martinos Center for Biomedical Imaging; and was made possible by the resources provided by NIH Shared Instrumentation Grants S10-RR019371.References
1. Huber, L., Uludağ, K., & Möller, H. E. (2019). Non-BOLD contrast for laminar fMRI in humans: CBF, CBV, and CMRO2. NeuroImage, 197, 742–760. https://doi.org/10.1016/j.neuroimage.2017.07.041
2. Koopmans, P. J., & Yacoub, E. (2019). Strategies and prospects for cortical depth dependent T2 and T2* weighted BOLD fMRI studies. NeuroImage, 197, 668–676. https://doi.org/10.1016/j.neuroimage.2019.03.024
3. Huber, L., Ivanov, D., Krieger, S. N., Streicher, M. N., Mildner, T., Poser, B. A., … Turner, R. (2014). Slab-selective, BOLD-corrected VASO at 7 Tesla provides measures of cerebral blood volume reactivity with high signal-to-noise ratio. Magnetic Resonance in Medicine, 72(1), 137–148. https://doi.org/10.1002/mrm.24916
4. Jin, T., & Kim, S.-G. (2006). Spatial dependence of CBV-fMRI: a comparison between VASO and contrast agent based methods. In International Conference of the IEEE Engineering in Medicine and Biology Society (Vol. 1, pp. 25–28). IEEE. https://doi.org/10.1109/IEMBS.2006.259553
5. Norris, D. G. (2012). Spin-echo fMRI: The poor relation? NeuroImage, 62(2), 1109–1115. https://doi.org/10.1016/j.neuroimage.2012.01.003
6. Goense, J. B. M., & Logothetis, N. K. (2006). Laminar specificity in monkey V1 using high-resolution SE-fMRI. Magnetic Resonance Imaging, 24(4), 381–392. https://doi.org/10.1016/j.mri.2005.12.032
7. Birn R, Bandettini PA. The effect of T2’ changes on spin-echo EPI-derived brain activation maps. Proc Intl Soc Mag Reson Med. 2002;10:1324.
8. Feinberg, D., Harel, N., Ramanna, S., Ugurbil, K., & Yacoub, E. (2008). Sub-millimeter single-shot 3D GRASE with inner volume selection for T2-weighted fMRI applications at 7 Tesla. Proc Intl Soc Mag Reson Med, 16, 2373.
9. Setsompop, K., Feinberg, D. A., & Polimeni, J. R. (2016). Rapid brain MRI acquisition techniques at ultra-high fields. NMR in Biomedicine, 29(9), 1198–1221. https://doi.org/10.1002/nbm.3478
10. Kemper, V. G., De Martino, F., Vu, A. T., Poser, B. A., Feinberg, D. A., Goebel, R., & Yacoub, E. (2015). Sub-millimeter T2 weighted fMRI at 7 T: comparison of 3D-GRASE and 2D SE-EPI. Frontiers in Neuroscience, 9, 163. https://doi.org/10.3389/fnins.2015.00163
11. Goerke, U., Van De Moortele, P. F., & Ugurbil, K. (2007). Enhanced relative BOLD signal changes in T2-weighted stimulated echoes. Magnetic Resonance in Medicine, 58(4), 754–762. https://doi.org/10.1002/mrm.21369
12. Wang, F., Dong, Z., Reese, T. G., Bilgic, B., Katherine Manhard, M., Chen, J., … Setsompop, K. (2019). Echo planar time-resolved imaging (EPTI). Magnetic Resonance in Medicine, 81(6), 3599–3615. https://doi.org/10.1002/mrm.27673
13. Polimeni, J. R., Renvall, V., Zaretskaya, N., & Fischl, B. (2018). Analysis strategies for high-resolution UHF-fMRI data. NeuroImage, 168, 296–320. https://doi.org/10.1016/j.neuroimage.2017.04.053
14. Uğurbil, K., Adriany, G., Andersen, P., Chen, W., Gruetter, R., Hu, X., … Ogawa, S. (2000). Magnetic resonance studies of brain function and neurochemistry. Annual Review of Biomedical Engineering, 2, 633–660. Retrieved from 2/1/633
15. Uludağ, K., Müller-Bierl, B., & Uğurbil, K. (2009). An integrative model for neuronal activity-induced signal changes for gradient and spin echo functional imaging. NeuroImage, 48(1), 150–165. https://doi.org/10.1016/j.neuroimage.2009.05.051
Figures
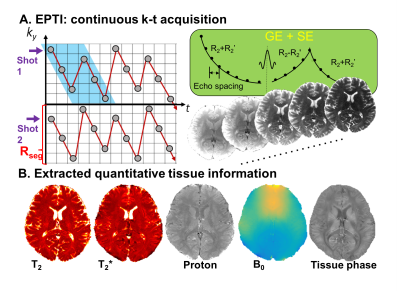
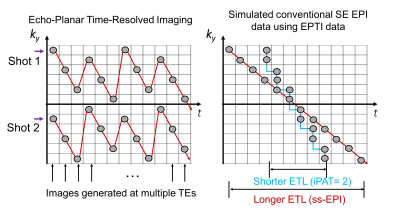
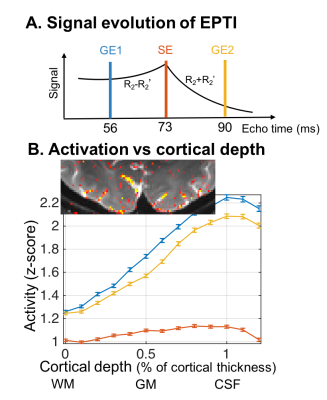
Fig. 3: Cortical-depth analysis of responses to visual stimulation in human V1 measured with EPTI-BOLD at 3T. (A) The three echo-timepoints (reconstructed with ky-t GRAPPA) for fMRI analysis. (B) Cortical depth analysis of visual cortical activation. (Activation maps shown in inset.) The line colors indicate TE values as indicated in A. The two GE-BOLD profiles peak at the pial surface, whereas the SE-BOLD has a reduced slope, indicating less influence from large pial veins.
