1228
High-resolution line-scanning reveals distinct visual response properties across human cortical layers.1Institute of Neuroscience & Psychology, University of Glasgow, Glasgow, United Kingdom
Synopsis
Motivated by recent functional line-scanning recordings in rodents, we developed a procedure to record human cortical layers at high spatial (200 μm) and temporal resolution (100 ms). Our technique addresses challenges associated with human line-scanning, such as planning around cortical folding and restrictive SAR limitations. Our results show that line-scanning of human cortical layers corroborates electrophysiological measurements of tuning properties in primary visual cortex. These results demonstrate that line-scanning is a promising technique for investigating local functional circuits in human cortex.
Introduction
High-field functional MRI has pushed the spatial resolution of fMRI to the sub-millimeter range, with 7T fMRI studies routinely achieving 0.7-0.8 mm isotropic resolution. This increased resolution has enabled the discrimination of mesoscopic signals from cortical columns1,2 and identification of laminar fMRI response properties within cortical areas3,4.Despite these recent advances, it remains challenging to compare human laminar fMRI signals to laminar profiles of electrophysiological response properties5. This is due to the size of typical fMRI voxels being larger than the thickness of individual layers, thus leading to partial volume effects in which voxels contain signals from multiple layers. This issue can be improved by acquiring highly anisotropic data with increased resolution through cortical layers6. However, the gyrencephalic nature of the human brain makes it difficult to line up more than a small portion of the imaging plane with cortical lamination. This method is therefore limited to subjects with large sections of flat cortex.
Here, we aimed to close the gap between layer-dependent fMRI and laminar electrophysiological recordings for human neuroscientific studies. We developed a line-scanning procedure to record cortical layers at high spatial resolution (200 μm), motivated by previous functional line-scanning recordings in rats7. Line-scanning exploits anisotropic resolution (0.2x3x3 mm3 in this study) but limits the field-of-view to a single frequency encoding line, allowing us to record high temporal resolution fMRI (100 ms) from any flat patch of cortex.
Our procedures produced recordings corroborating electrophysiological measurements of tuning properties in primary visual cortex (V1). These results serve as proof-of-principle that line scanning can be used to investigate local functional circuits in human cortex.
Methods
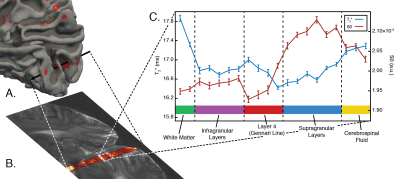
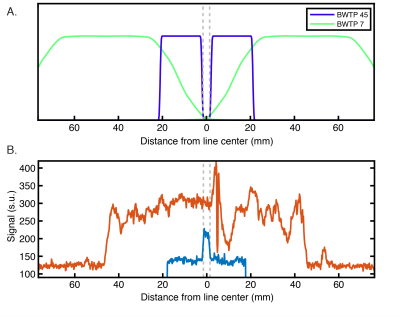
Planning: We scrutinized cortical folding patterns in individual subjects prior to acquisition to minimize partial volume effects. We generated a 3D cortical surface model using the Freesurfer package9 and marked vertices with the lowest 10% of Gaussian and mean curvature values (Figure 1A). For our experiment, a flat cortical patch in V1 at least 3 mm wide was chosen and the line-scanning frequency encoding direction was defined to match the vertex normal of this patch.Acquisition: Data were collected using a 7T Siemens Magnetom Terra system (Siemens Healthcare, Erlangen, Germany) equipped with a 1Tx/32Rx-channel head coil (Nova Medical Inc., MA, USA) and an SC72 gradient. Our line-scanning sequence was based on multi-echo gradient-spoiled 2D-FLASH (TR=100 ms, TEs=28, 41.5, and 55 ms, FOV=51x51x3 mm3, matrix=256x256, resolution=0.2x0.2x3.0 mm3, flip angle=25º, readout BW=80 Hz/px). Saturation pulses were applied every TR to suppress signal outside the line profile. A larger area was saturated using a broad profile (BWTP=7, pulse duration=2 ms, thickness=50 mm, flip angle=90º), followed by saturation of a thin area with a sharp profile near the line (BWTP=45, pulse duration=7 ms, thickness=20 mm, flip angle=65º).
Three versions of the line-scanning sequence were used. The first, a profile version, employed the standard 2D-FLASH phase encoding scheme (with and without saturation; Figure 1B). This sequence was used to verify the location of the line. The second version was used for quantitative T2* and S0 mapping of the line. The phase-encoding gradient was deactivated to achieve spatial encoding purely along readout direction and we recorded 10 echoes (TR=1500 ms, TEs=15.3-54.9 ms [4.4 ms spacing], readout BW=200 Hz/px). The third sequence again deactivated the phase encoding gradient and was used for functional scanning (parameters described above).
Functional experiment: The participant signed consent as approved by the MVLS College, University of Glasgow. The participant viewed two movie clips previously used in the Human Connectome Project (HO ‘Inception’ clip10 [2668 TRs] and ‘Vimeo repeat clip’ [1230 TRs]). Each clip was viewed three times.
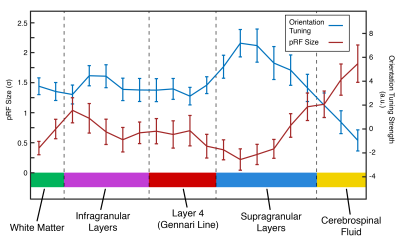
Analysis: Gray matter (GM) voxels were identified via quantitative mapping (T2* and S0 fitting by exponential decay curve). We identified Layer 4 via T2* values highlighting the Gennari Line11. Functional time courses from GM voxels were initially averaged to identify the population receptive field (pRF) location of our cortical patch. We masked visual movie features (orientation/spatial frequency) with 2D Gaussians to create time course models12 (48 polar angle, 24 eccentricity locations) and the best-performing model was chosen as the pRF-center (Polar Angle=1.36π, Eccentricity=3.84º visual angle). pRF location was then fixed, and pRF size and orientation tuning were computed for each voxel using ridge regression. The sharpness of tuning was defined as the difference in response magnitude between preferred and perpendicular orientations.
Results
The profile of our imaging line is shown in Figure 2B. Within the line region, signal is attenuated by 43% compared to the unsaturated scan. This loss is due to a combination of imperfect saturation pulse profiles encroaching on the line, and loss of signal due to a smaller excitation area. Outside the line region, we saturated 88.8% of the signal.Figure 3 shows that pRF size is larger in deep and superficial layers, similar to previous results in both non-human primate electrophysiology13 and human fMRI14. Additionally, sharpness of tuning is higher in both infragranular and supragranular layers compared to layer 4. This result corroborates electrophysiological observations5,13 and extends beyond the current fMRI literature.
Conclusion
V1 tuning properties computed from human line-scanning support those in electrophysiological measurements. Line-scanning is therefore a promising technique to investigate local functional circuits in human cortex.Acknowledgements
This work was supported by the European Union’s Horizon 2020 Framework Programme for Research and Innovation under the Specific Grant Agreement No. 785907 (Human Brain Project SGA2), awarded to L.M., and by the Medical Research Council (MR/R005745/1 awarded to J.G.; MR/N008537/1 awarded to L.M. and J.G.).References
[1] Schneider M, Kemper VG, Emmerling TC, Martino FD, Goebel R. Columnar clusters in the human motion complex reflect consciously perceived motion axis. Proc Natl Acad Sci. 2019;116(11):5096-5101. doi:10.1073/pnas.1814504116
[2] Martino FD, Moerel M, Ugurbil K, Goebel R, Yacoub E, Formisano E. Frequency preference and attention effects across cortical depths in the human primary auditory cortex. Proc Natl Acad Sci. 2015;112(52):16036-16041. doi:10.1073/pnas.1507552112
[3] Muckli L, De Martino F, Vizioli L, et al. Contextual Feedback to Superficial Layers of V1. Curr Biol. 2015;25(20):2690-2695. doi:10.1016/j.cub.2015.08.057
[4] Kok P, Bains LJ, Mourik T van, Norris DG, Lange FP de. Selective Activation of the Deep Layers of the Human Primary Visual Cortex By Top-Down Feedback. Curr Biol. 2016;26(3):371-376. doi:10.1016/j.cub.2015.12.038
[5] Self MW, van Kerkoerle T, Goebel R, Roelfsema PR. Benchmarking laminar fMRI: Neuronal spiking and synaptic activity during top-down and bottom-up processing in the different layers of cortex. NeuroImage. 2019;197:806-817. doi:10.1016/j.neuroimage.2017.06.045
[6] Kashyap S, Ivanov D, Havlicek M, Sengupta S, Poser BA, Uludağ K. Resolving laminar activation in human V1 using ultra-high spatial resolution fMRI at 7T. Sci Rep. 2018;8(1):1-11. doi:10.1038/s41598-018-35333-3
[7] Yu
X, Qian C, Chen D, Dodd SJ, Koretsky AP. Deciphering Laminar-Specific Neural
Inputs With Line-Scanning Fmri. Nat Methods. 2013;11(1):55-58.
doi:10.1038/nmeth.2730
[8] Uludağ K, Blinder P. Linking brain vascular physiology to hemodynamic response in ultra-high field MRI. NeuroImage. 2018;168:279-295. doi:10.1016/j.neuroimage.2017.02.063
[9] Dale AM, Fischl B, Sereno MI. Cortical Surface-Based Analysis: I. Segmentation and Surface Reconstruction. NeuroImage. 1999;9(2):179-194. doi:10.1006/nimg.1998.0395
[10] Cutting JE, Brunick KL, Candan A. Perceiving event dynamics and parsing Hollywood films. J Exp Psychol Hum Percept Perform. 2012;38(6):1476-1490. doi:10.1037/a0027737
[11] Fukunaga M, Li T-Q, Gelderen P van, et al. Layer-specific variation of iron content in cerebral cortex as a source of MRI contrast. Proc Natl Acad Sci. 2010;107(8):3834-3839. doi:10.1073/pnas.0911177107
[12] Dumoulin SO, Wandell BA. Population receptive field estimates in human visual cortex. Neuroimage. 2008;39(2):647-660. doi:10.1016/j.neuroimage.2007.09.034
[13] Self MW, van Kerkoerle T, Super H, Roelfsema PR. Distinct Roles of the Cortical Layers of Area V1 in Figure-Ground Segregation. Curr Biol. 2013;23(21):2121-2129. doi:DOI 10.1016/j.cub.2013.09.013
[14] Fracasso A, Petridou N, Dumoulin SO. Systematic variation of population receptive field properties across cortical depth in human visual cortex. NeuroImage. 2016;139:427-438. doi:10.1016/j.neuroimage.2016.06.048
Figures


