1227
Sub-Millimeter Spiral fMRI Combining Magnitude and Phase BOLD Contrast1Institute for Biomedical Engineering, ETH Zurich and University of Zurich, Zurich, Switzerland, 2Translational Neuromodeling Unit, Institute for Biomedical Engineering, University of Zurich and ETH Zurich, Zurich, Switzerland, 3Wellcome Trust Centre for Neuroimaging, University College London, London, United Kingdom, 4Max Planck Institute for Metabolism Research, Cologne, Germany
Synopsis
We investigate the spatial specificity of sub-millimeter (0.8mm) single-shot spiral fMRI, and its feasibility for functional phase contrast. Scrutinizing activation patterns of a visual paradigm in 6 subjects, we find that significant contrast changes occur between adjacent voxels, contributing to the evidence of spatial specificity of spiral acquisition as well as gradient echo BOLD contrast, and its possible applications in laminar or columnar fMRI. Furthermore, the vessel-localized nature of the phase activation suggests its suitability for masking macrovascular confound effects.
Introduction
fMRI with sub-millimeter spatial resolution enables the detailed exploration of functional brain organization, e.g., at the level of cortical layers or columns [1–3]. Conceptually, spiral readouts of gradient-echo (GRE) BOLD appear well suited for this task due to their superior average k-space speed compared to EPI [4], improving acquisition efficiency for increased resolution. However, two concerns potentially limit the spatial specificity of high-resolution spiral GRE fMRI. First, the spiral point spread function (PSF) is blurred in the presence of B0 inhomogeneity. Secondly, though SAR and time-efficient, GRE acquisition is more sensitive to intravascular BOLD signal, stemming e.g., from macroscopic vessels [5]. Recently, anatomically veridical single-shot 2D spirals without conspicuous blurring have been deployed at 7T [6,7], owing to an expanded signal model incorporating static and dynamic B0 field changes, and iterative cg-SENSE reconstruction [8]. Furthermore, this approach also yields raw phase data of high quality [9], intrinsically unwrapped by the B0 map demodulation in the model. Here, we therefore explore the spatial specificity of BOLD data acquired with single-shot 2D spirals of nominal 0.8mm resolution. We scrutinize the discriminability of activation , in a visual paradigm for adjacent voxels. We further investigate the utility of phase data of such high-resolution to detect and remove intravascular BOLD effects that manifest as task-locked coherent phase change [10].Methods
SetupSix young healthy volunteers were scanned on a 7T Philips Achieva system, using a 1-channel transmit, 32-channel receive coil (Nova Medical). To monitor the spiral trajectories, 16 19F-NMR field probes [11] were positioned between the coils on a nylon frame and connected to a separate MR acquisition system [12]. Visual stimuli were presented on an LCD visor (VisuaStim).
Sequence, Trajectories and Image Reconstruction
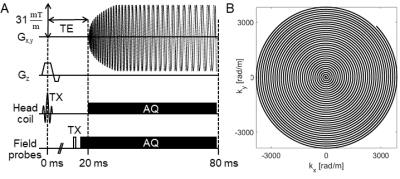
We designed a 2D single shot spiral trajectory (4x undersampled FOV 220 mm) with 0.8mm in-plane resolution and time-optimal readout (57ms, Fig.1) for our gradient slew-rate and amplitude limits [13]. In total, 36 transverse-oblique slices (0.9mm+0.1mm gap) were acquired covering the visual cortex with TR=3.3s and TE=20ms. Concurrent field recording with NMR probes was performed for every 3rd spiral trajectory at 1Mhz bandwidth. The probes were excited just before the start of the readout gradients (Fig. 1), and their phase signal converted into global phase and k-space trajectory coefficients on the dedicated spectrometer.
A spin-warp multi-echo sequence (6 echoes, dTE=1ms) was measured prior to the functional runs with identical geometry to serve as an anatomical reference, as well as to estimate sensitivity and off-resonance map for the expanded signal model [14] .
The signal model comprised these maps as well as the measured spiral field dynamics (k0, kx,y,z) to express the measured coil data, and was inverted by an iterative cg-SENSE reconstruction algorithm with multi-frequency interpolation [8,15]. This yielded complex reconstructed images, of which modulus and argument were taken for subsequent separate time-series analysis. Note that, in particular, no spatial phase unwrapping or background phase removal was performed.
FMRI Paradigm and Analysis
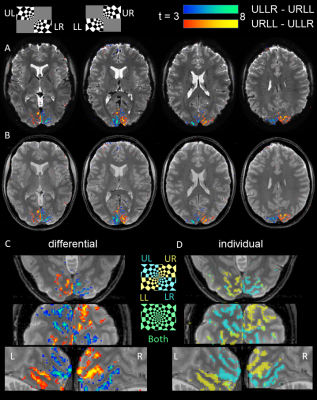
Subjects performed a visual quarter-field stimulation paradigm for 5.5 minutes (100 volumes). Two blocks of 15 s duration presented flickering checkerboard wedges in complementary pairs of the visual quarter-fields (ULLR=upper left and lower right visual field, URLL=upper right and lower left). Blocks were alternated and interleaved with fixation periods of equal length, and the whole cycle repeated 5x.
Preprocessing included realignment and smoothing (0.8mm). Using a GLM analysis in SPM12, we evaluated both differential t-contrasts +/- (ULLR-URLL) of the 2 blocks as well as individual conditions (ULLR, URLL). Contrasts are reported uncorrected for multiple comparisons (p<0.001) to allow for better scrutiny of overlapping activations.
Results
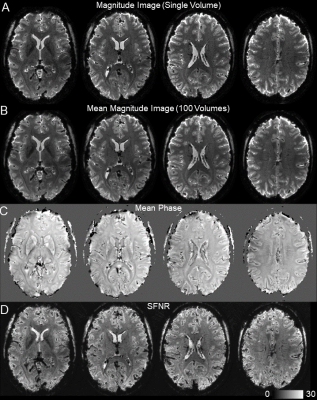
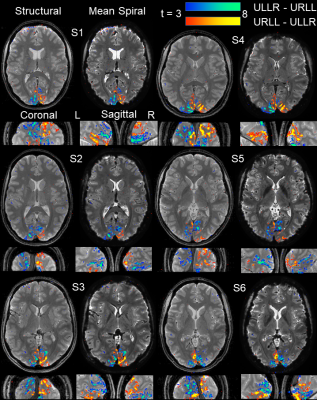
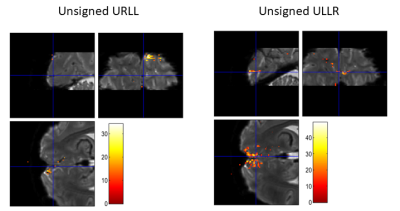
We found high quality of both raw spiral magnitude and phase images (Fig.2, after realignment), despite the long single-shot readout duration of nearly 60ms that exacerbate B0 blurring. Temporal stability was sufficient for fMRI, as seen in the SFNR maps. Single-subject activation maps for the magnitude data, overlaid on the mean functional images, contain typical stimulation patterns in visual cortex (Fig.3A), which follow gyrus anatomy when overlaid on the multi-echo reference image (Fig.3B). Spatial specificity is evident in contrast changes for adjacent voxels for both differential and individual contrasts with little overlap between conditions (Fig. 3C,D). These results are reproduced in all 6 subjects (Fig. 4). For the phase data, a two-sided contrast of the individual conditions gave the strongest activation maps, pointing to a different mechanism of activation (Fig. 5). Activation sites partially coincide with the magnitude contrasts, but are less widespread and more confined to darker locations (short T2*), presumably larger vessels.Discussion
Single-shot spiral fMRI with sub-mm spatial specificity has been realized. On a standard gradient system acquisition efficiency was enhanced to a 220x220x36 mm FOV brain image at 0.8 mm nominal resolution (i.e., a matrix size of 275x275x36) at a typical TR of 3.3s. The magnitude fMRI data shows discriminative activation down to the voxel level, while phase data highlights possible sources of intravascular BOLD changes in larger vessels, suitable for masking. Future work will expand this phase analysis to include phase time courses into the GLM or analyze it in a functional QSM framework [16].Acknowledgements
This work was supported by the NCCR “Neural Plasticity and Repair” at ETH Zurich and the University of Zurich (LK, KPP, KES), the René and Susanne Braginsky Foundation (KES), and the University of Zurich (KES). Technical support from Philips Healthcare, Best, The Netherlands, is gratefully acknowledged.References
[1] L. Huber et al., NeuroImage, 2018, 164, 131.
[2] J. Goense, H. Merkle, N.K. Logothetis, Neuron, 2012, 76, 629.
[3] S. Kashyap et al., Scientific Reports, 2018, 8, 1.
[4] G.H. Glover, NeuroImage, 2012, 62, 706.
[5] K. Uludağ, B. Müller-Bierl, K. Uğurbil, NeuroImage, 2009, 48, 150.
[6] M. Engel et al., Magnetic Resonance in Medicine, 2018, 80, 1836.
[7] L. Kasper et al., in Proc. Intl. Soc. Mag. Reson. Med. 25, 2017, 582.
[8] K.P. Pruessmann et al., Magnetic Resonance in Medicine, 2001, 46, 638―651.
[9] L. Kasper et al., NeuroImage, 2018, 168, 88.
[10] M. Bianciardi, P. van Gelderen, J.H. Duyn, Human Brain Mapping, 2013, n/a.
[11] N. De Zanche et al., Magnetic Resonance in Medicine, 2008, 60, 176―186.
[12] B.E. Dietrich et al., Magnetic Resonance in Medicine, 2016, 75, 1831.
[13] M. Lustig, S.-J. Kim, J.M. Pauly, IEEE Transactions on Medical Imaging, 2008, 27, 866.
[14] B.J. Wilm et al., Magnetic Resonance in Medicine, 2011, 65, 1690.
[15] L.C. Man, J.M. Pauly, A. Macovski, Magnetic Resonance in Medicine, 1997, 37, 785.
[16] D.Z. Balla et al., NeuroImage, 2014, 100, 112.
[17] V.D. Calhoun et al., Magnetic
Resonance in Medicine, 2002, 48, 180.
Figures
