1226
Modelling the Laminar VASO Signal Change in Human V1 at 7T1Centre for Advanced Imaging, The University of Queensland, Brisbane, Australia, 2ARC Training Centre for Innovation in Biomedical Imaging Technology, The University of Queensland, Brisbane, Australia, 3School of Information Technology and Electrical Engineering, The University of Queensland, Brisbane, Australia
Synopsis
In this study, we used the “cortical vascular model” for human V1 at 7T to simulate the laminar VAscular-Space-Occupancy (VASO) signal change. For comparison, we conducted VASO experiments on a group of healthy subjects to measure laminar signal change in V1. Results show a very good agreement between the model prediction and the experimental results once the volume changes of the different vascular compartments (arterioles, capillaries, venules) are taken into account.
Introduction
Blood-oxygen-level-dependent (BOLD) fMRI is commonly applied to measure brain activity non-invasively in humans. However, the BOLD response is formed through a complex interplay of several physiological variables, making the laminar BOLD signal interpretation challenging1, 2. Cerebral blood volume measurement using Vascular-space-occupancy (VASO) in animal and human studies has been shown to be more specific to the site of activation compared to BOLD3, though with lower sensitivity. Nevertheless, interpreting the experimental findings without having a detailed understanding of the underlying neuronal and vascular response remains challenging1. Mathematical models based on cortical human brain vasculature are needed to gain a better understanding of physiological mechanisms underlying the fMRI signal. In this work, we used a recently proposed cortical vascular BOLD model4 to simulate the static laminar VASO signal change and compare the predictions with experimental results in human V1 at 7T.Methods
Simulation:The cortical vascular model divides the human brain vasculature into two main groups: a) laminar network consisting of arterioles, capillaries, and venules; b) intracortical veins (ICVs) that run through all cortical layers perpendicular to the cortical surface. The model is defined based on the parallel vascular anatomical network (VAN) model5 and the laminar network features such as vessel density, diameter, length, and baseline blood volume in each layer are taken from the observation in macaque V16. The ICV diameter is then calculated in each layer based on known properties7 along with the knowledge of capillaries diameter and volume in each layer, and the BOLD signal model is employed to simulate the signal change across the cortical layers4.
In VASO, signal change arises from the extravascular component, as the intravascular signal is nulled through the use of an inversion pulse. The steady-state GRE VASO signal change was simulated using the cortical vascular model4 by assuming realistic8 CBV changes upon visual stimulation in a range of different scenarios to find the best fit with our experimental results. In some scenarios, we assumed the same CBV change in all layers, while in another one we assumed a higher CBV change in the middle layers. We also assumed that the CBV change would be different in the three cortical vascular compartments [arterioles/capillaries 60% to 80%; venules 0% to 60%]. These CBV changes reflect CBF changes of about 0%-92% when assuming a Grubb value of 0.389. The laminar signal changes were smoothed with a kernel calculated in the previous studies10 to provide a realistic profile for better comparison with the experimental profiles.
Imaging:
Imaging was performed on a 7T whole-body MR scanner (Siemens Healthcare, Erlangen, Germany) with a single-channel Tx and 32-channel Rx head coil (Nova Medical, Wilmington, MA, USA). Eleven healthy subjects (2 females; age range 19-32 years) participated in this study after giving written informed consent. The SS-SI VASO sequence11 was used to acquire BOLD and VASO images in an interleaved manner with the following imaging parameters: volume TR = 5000ms, TE/TI = 23/650 ms, isotropic voxel size 0.8 mm, GRAPPA acceleration factor=3, and 3D EPI readout12. In each imaging session, three functional runs, each 17 minutes long, were acquired (400 volumes in each run). For anatomical reference, MP2RAGE13 images were acquired with an isotropic voxel size of 0.75 mm. A flashing black and white noise pattern14 with 30 s length was used for the visual stimulation.
Functional Analysis:
Functional maps were estimated using SPM12 (Wellcome Department, UK) with no spatial smoothing. Voxels with a significant level of p<0.01 were identified as the activated regions for both BOLD and BOLD corrected VASO contrasts. Layer analysis was performed according to the procedure proposed by Huber15 to obtain the layer-dependent fMRI responses in V1 in each subject, and the average response across all participants.
Results
An example of the experimental fMRI activation maps are shown in Fig.1 for both BOLD and VASO contrasts. As expected, CBV signal change is more confined to the grey matter, while the BOLD signal change is less specific and is biased to the site of the large pial veins.In Fig. 2 we show the scenario that provides the best match between model prediction and the laminar fMRI results for VASO. In this scenario CBV changes were 80% and 60% for arterioles/capillaries of middle and upper/lower layers respectively, 30% and 0% CBV changes in venules for middle and upper/lower layers respectively. For comparison, we also show two scenarios with different (but realistic) assumptions that show a poor fit with our experimental results (Fig. 3 and 4).
Discussion and Conclusion
In this work, the cortical vascular model4 was extended and used to simulate the laminar VASO signal change in human V1 at 7T. As the model structure is based on a realistic vasculature very similar to the human brain, it is useful for a better understanding of the brain physiological mechanisms at rest and activity. The model provides various physiological scenarios at the laminar level and suggests a higher neuronal activity in addition to the higher vascular density in the middle cortical layers as the best-fitted scenario proposed a higher CBF and CBV changes in the middle layers compare to infra- and supra-granular layers.Acknowledgements
The author acknowledge the helpful discussions with and support from Renzo Huber, Jon Polimeni and Irati Markuerkiaga. This work was supported by the NHMRC (grant APP1117020) and the NIH (grant R01-MH111419). MB acknowledges funding from ARC Future Fellowship grant FT140100865. The authors acknowledge the facilities and scientific and technical assistance of the National Imaging Facility, a National Collaborative Research Infrastructure Strategy (NCRIS) capability, at the Centre for Advanced Imaging, The University of Queensland.References
1. Buxton, R.B., et al., Neuroimage, 2004. 23: p. S220-S233.
2. Uludağ, K. and P.J.N. Blinder, 2018. 168: p. 279-295.
3. Lu, H., et al., 2003. 50(2): p. 263-274.
4. Markuerkiaga, I., M. Barth, and D.G. Norris, 2016. 132: p. 491-498.
5. Boas, D.A., et al, Neuroimage, 2008. 40(3): p. 1116-1129.
6. Weber, B., et al., 2008. 18(10): p. 2318-2330.
7. Duvernoy, H.M., S. Delon, and J.J.B.r.b.1981. 7(5): p. 519-579.
8. Hua, J., et al., 2011. 66(1): p. 40-56.
9. Grubb, R.L., et al.,Stroke, 1974. 5(5): p. 630-639.
10. Koopmans, P.J., et al., 2011. 56(3): p. 1276-1285.
11. Huber, L., et al.,Neuron, 2017. 96(6): p. 1253-1263. e7.
12. Poser, B.A., et al.,Neuroimage, 2010. 51(1): p. 261-266.
13. Marques, J.P., et al., 2010. 49(2): p. 1271-1281.
14. Polimeni, J.R., et al. 2005.
15. Huber, L., et al., Neuroimage, 2015. 107: p. 23-33.
Figures
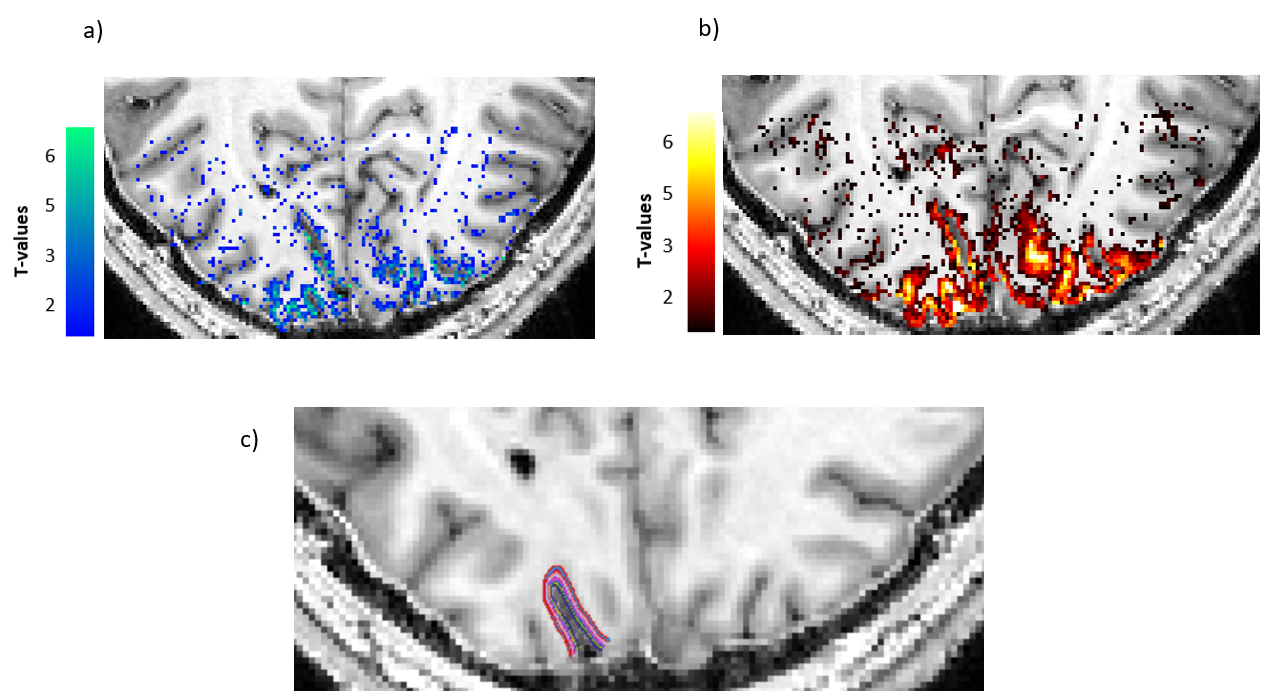
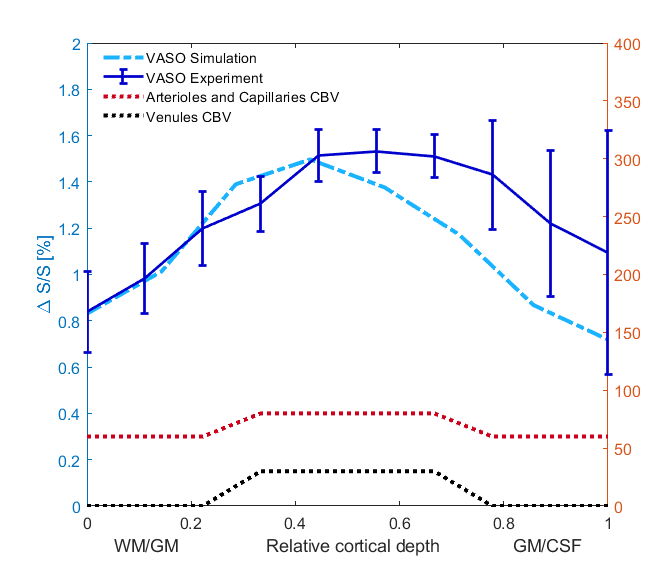
Fig2. In this scenario, we considered an 80% CBV change in arterioles and capillaries in middle layers, and 60% CBV change in lower/upper layers. We also assumed venule CBV change of 30% in middle layers and 0% in upper/lower layers. In all figures, error bars show the standard deviation of the mean across all participants.

