1222
Novel resampling approach for 200-ms temporal resolution MB-SWIFT fMRI – application to DBS in rats1University of Eastern Finland, Kuopio, Finland, 2Center for Magnetic Resonance Research, University of Minnesota, Minneapolis, MN, United States
Synopsis
Deep brain stimulation (DBS) is widely used to treat several disorders. Given its minimal sensitivity to electrode-induced artifacts, fMRI with Multi-Band Sweep Imaging with Fourier Transformation (MB-SWIFT) is a powerful tool for identifying the DBS mechanism of action at a network level. However, MB-SWIFT generally suffers from low time resolution, thus limiting the characterization of temporal features. Here, we introduce a novel resampling approach applicable to radial k-space sampling such as used in MB-SWIFT, allowing to track repeating events with 200-ms time resolution. A proof of concept was demonstrated during DBS of the medial septal nucleus in rats.
Introduction
Widely used to treat various neurological disorders1,2, deep brain stimulation (DBS) is currently evolving to target new areas in the brain. Medial septal nucleus (MSN) has projections to the hippocampus, making it an appealing target to treat memory impairments3 and induce neurogenesis in the hippocampal formation4,5. Functional magnetic resonance imaging (fMRI) with Multi-Band SWeep Imaging with Fourier Transform (MB-SWIFT) is a powerful tool to track brain response during the DBS, however, its low temporal resolution restricts discovering temporal features of activation. In this work, we demonstrate a novel resampling strategy that is applicable to radial k-space sampling such as used in MB-SWIFT and that allows tracking repeating events in the brain with high temporal resolution. Here, we aimed at mapping brain activation in response to DBS of the MSN in rats.Materials and Methods
The study was conducted in 7 male Sprague-Dawley rats. All animal procedures were approved by the Institutional Animal Care and Use Committee of the University of Minnesota.The resampling approach relies on the recognition that similar repeating events can be tracked with higher temporal resolution than a single event by combining data from several events. A different portion of the k-space can be selected when acquiring a data point from each event and can then be combined with other k-space portions to cover the entire k-space. To achieve that, each event should be shifted so that different portions of k-space are measured each time for every time point. To improve time resolution n times when keeping k-space coverage the same, we would need at least n repetitions of the event (Fig. 1). After reordering the spokes, the data is reconstructed normally, as if it was acquired from one event.
We applied this method to DBS of the rat brain. Animals were anesthetized with isoflurane and implanted with an electrode in the MSN. Subsequently, the anesthesia was switched to urethane. We used MB-SWIFT imaging sequence with the following parameters: TR 0.97 ms, bandwidth 192 kHz, matrix size 643, FOV 3.5×3.5×6.4 cm3, flip angle 5°. The stimulation paradigm consisted of 10-s stimulations and 2-minute rest. A single 3D k-space consisted of 2000 spokes and the total time of volume acquisition was 2 s. Therefore, to achieve 200-ms time resolution, stimulus was repeated 10 times. The stimulus shifts were applied in random order to avoid the effect of global signal change. The resting time was randomized between 55 and 65 volumes. This measurement was repeated 3 times for each animal.
The spokes for each time point were aggregated to achieve the whole k-space coverage. For each animal, three 118-s – long measurements with 200-ms time resolution were composed out of the three repeated acquisitions with 10 stimulus periods. These three measurements were then averaged.
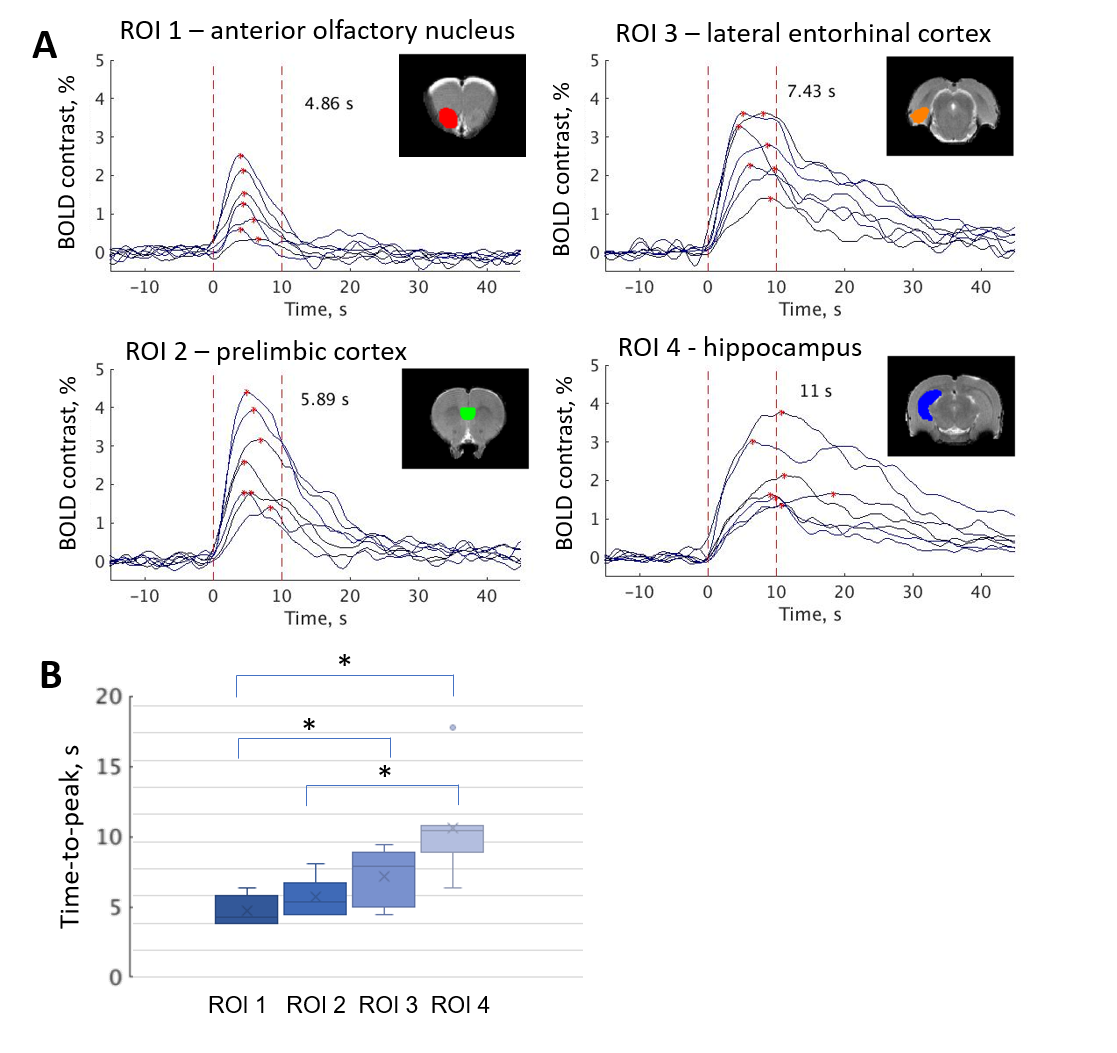
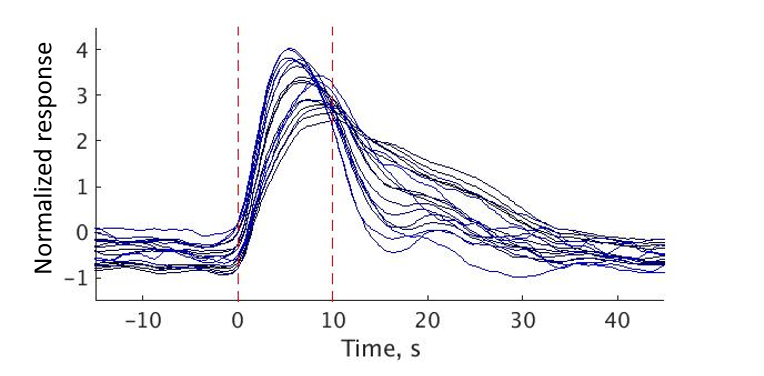
To exclude habituation to the stimulus (Fig. 2), we checked the consistency of the response and activation amplitudes for each animal. We chose several regions of interest (ROIs) and compared time-to-peak between these ROIs. (Fig. 3). In addition, we performed a group tensor ICA analysis to see all the different responses in the brain (Fig. 4).
Results
DBS in the MSN caused widespread activation in several brain regions, including the hippocampus and some cortical structures. We found that the results were consistent for each animal, and for the three repeated scans (Fig. 2). No habituation to the stimulus during the one-hour experiment was observed.Time-to-peak and amplitude of activation varied between the different brain regions (Fig. 3). In general, activation closer to the electrode and in the areas directly connected to the MSN lasted longer than in the areas more distant from the stimulus site.
Group ICA was able to detect several stimulus-related components with different time courses (Fig. 4).
Discussion
The goal of this development was to establish a framework for high temporal resolution method using MB-SWIFT technique for monitoring fMRI response to DBS. Increasing temporal resolution can allow investigating the mechanisms of action of DBS in a broader temporal scale than it was possible so far using conventional fMRI.With the new method, we found that time-to-peak and shapes of DBS responses differ between the brain regions. Noticeably, cortical areas showed the fastest time-to-peak interval, while the areas directly connected to the area of stimulation exhibited the longest time-to-peak response. It is important to note that temporal differences can either reflect differences in brain activation or brain region-dependent differences in hemodynamic response function.
Notably, this method can also be applied to naturally occurring events, not only to external stimuli. This will require more repetitions of the event for k-space coverage and potentially more sophisticated reconstruction for partially sampled k-space, as natural events occur more randomly.
Conclusion
A novel resampling SWIFT-fMRI method allows tracking repeating events in the brain with high temporal resolution. It is easily applicable and useful for DBS studies, where the responses are stable and differ significantly between the brain regions. However, the method has the potential to be used with recurring events of any type.Acknowledgements
This work was supported by the National Institutes of Health U01-NS103569-01, the Center for Magnetic Resonance Research NIH core grant P41EB027061, the EU H2020 Marie Skłodowska RISE project #691110 (MICROBRADAM), Erkko FoundationReferences
1. Berlim MT, McGirr A, Van den Eynde
F, Fleck MP, Giacobbe P. Effectiveness and acceptability of deep brain
stimulation (DBS) of the subgenual cingulate cortex for treatment-resistant
depression: a systematic review and exploratory meta-analysis. Journal of affective
disorders. 2014 Apr 20;159:31-8.
2. Gross RE, Lozano AM. Advances in
neurostimulation for movement disorders. Neurological research. 2000 Apr
1;22(3):247-58.
3. Lee DJ, Gurkoff GG, Izadi A, Berman
RF, Ekstrom AD, Muizelaar JP, Lyeth BG, Shahlaie K. Medial septal nucleus theta
frequency deep brain stimulation improves spatial working memory after
traumatic brain injury. Journal of neurotrauma. 2013 Jan 15;30(2):131-9.
4. Chamaa F, Sweidan W, Nahas Z, Saade
N, Abou-Kheir W. Thalamic stimulation in awake rats induces neurogenesis in the
hippocampal formation. Brain stimulation. 2016 Jan 1;9(1):101-8.
5. Encinas JM, Hamani C, Lozano AM,
Enikolopov G. Neurogenic hippocampal targets of deep brain stimulation. Journal
of Comparative Neurology. 2011 Jan 1;519(1):6-20.
Figures