1221
iZTE-fMRI1University of North Carolina at Chapel Hill, Chapel Hill, NC, United States, 2Duke University, Durham, NC, United States
Synopsis
In this study we demonstrate how a zero-echo-time (ZTE) technique can overcome several limitations of traditional fMRI experiments. We demonstrate that ZTE fMRI can detect functional activations with positive iron oxide contrast, termed iZTE-fMRI, at an approximate three-fold magnitude increase in tCNR when compared to GRE-techniques in-vivo - with the further potential demonstrated from phantom studies to increase tCNR more significantly under optimal contrast agent dose. We also show that iZTE fMRI experiments can produce functional images with markedly less susceptibility artifacts and acoustic noise than standard GRE techniques.
Introduction
Gradient-recalled echo (GRE) echo planar imaging (EPI) is the gold standard imaging sequence functional brain imaging, for approaching three decades1, due to its ability to rapidly acquire whole brain volumes with T2* sensitivity to BOLD2 and CBV-fMRI signal changes3. Despite their utility to the neuroimaging field, GRE-EPI sequences suffer from two major drawbacks:1) High sensitivity to magnetic susceptibility, resulting in geometric distortion4 and signal dropout5. In fMRI experiments, this additionally induces the mislocalization of regions of activation6.
2) High gradient power duty cycle requirements; causing high acoustic noise7 and eddy current artifacts8.
Ideally, sequences such as UTE, ZTE or SWIFT with short or “zero” acquisition delay (i.e., high acquisition bandwidth) and minimal increment of gradients during encoding are relatively immune to these problems.
Several research groups pioneered the utility of these short acquision delay sequences for fMRI,9,10 demonstrating marked reduction in geometric distortion, acoustic noise and eddy current artifacts. Despite these major advances, the source of the reported functional signal changes are not comprehensively characterized and none of the studies have yet to demonstrated superior sensitivity to the gold standard GRE-based sequences, limiting their universal utilization in functional brain mapping.
This study aims to further address these issues by employing a novel concept that iron oxide nanoparticles exhibit strong positive contrast in the ZTE sequence11,12 due to its insensitivity to T2*, allowing their T1 effect to be isolated. We hypothesized that, with the assistance of iron oxide nanoparticles, a ZTE sequence can be used to detect CBV-weighted functional activations at unprecedented contrast-to-noise ratio (CNR) while maintaining negligible geometric distortion and low acoustic noise. Successful implementation of the proposed technique should push the current boundaries of fMRI sensitivity and open up a new avenue for neuroimaging.
Methods
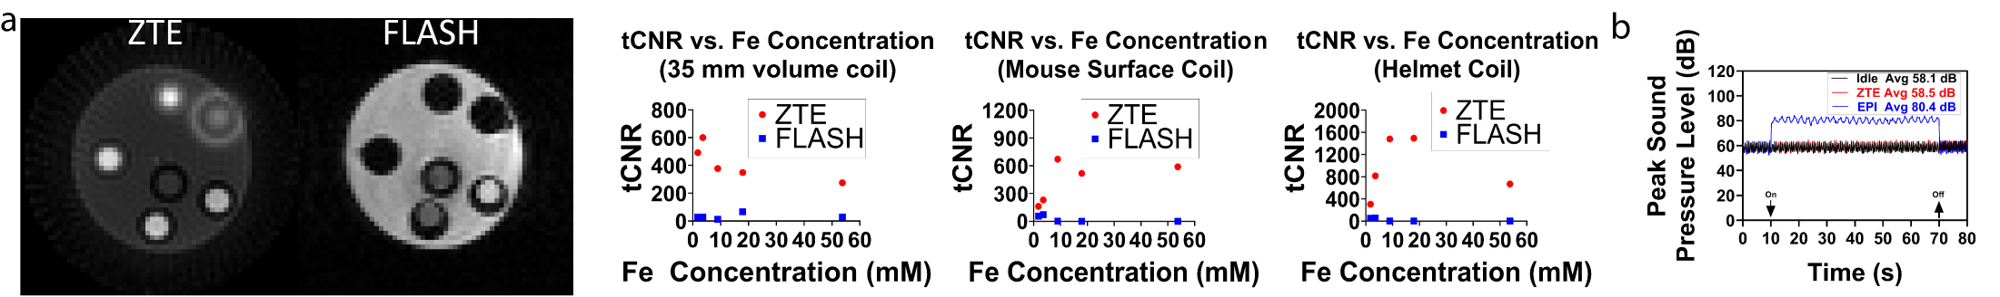
All data were acquired with a Bruker BioSpec system (Bruker Corp., Billerica, MA) with a BFG-240-120 gradient insert (RRI., Billerica, MA). The selected ZTE acquisition parameters for fMRI are at a 3s temporal resolution with the following parameters: TR=1.123ms, BW=100kHz, FOV=60mm,3, matrix size = 603, Acceleration Factor (AF)=4.385. FLASH fMRI acquisitions were acquired with: TR=72.033ms, TE=8.038ms, FA=15 °, Slices=5, Slice Thickness=1mm.Phantoms were made from six 0.5ml syringes containing solutions of Feraheme contrast agent (AMAG Pharmaceuticals,. Waltham, MA) with concentrations of Fe ranging from 0(saline)to 53.71mM. tCNR was calculated from 400 repetitions of ZTE acquisitions and was defined as the absolute mean intensity difference between contrast agent and saline divided by the standard deviation temporal fluctuations saline ROI mean over time.
Forepaw stimulations used an off-on-off paradigm: 90-90-180s using a 9Hz, 0,5ms pulse width and 4mA amplitude.
Gas challenge used 5% CO2 in an off-on-off paradigm of 40-40-40s.
Results and Discussion
To identify the feasibility of using ZTE-fMRI with intravascular iron-oxide nanoparticles injection (hereafter termed as iZTE-fMRI) for functional brain mapping, we first carried out multiple phantom experiments with solutions of varying iron oxide concentrations. Fig.1a-d show ZTE images of these phantoms acquired at different flip angles, acquisition bandwidths, RF pulse-lengths, undersampling/acceleration factors. Our results demonstrated robust positive contrast and high tCNR derived from dynamic ZTE data over a range of Fe concentrations. Fig.1e&f show ZTE RF profiles through a homogeneous agarose phantom with a volume coil and a helmet coil respectively, indicative of RF profile integrity at very short RF pulse lengths. These results informed our iZTE-fMRI parameter choice for in-vivo experiments.Fig.2a compares ZTE and FLASH at optimized acquisition parameters over a range of Fe concentrations. We chose FLASH for comparison for its sensitivity to T2* effect of iron oxide and its sampling characteristics to avoid the confounding factors from EPI geometric distortion. ZTE outperforms FLASH by up to 5 fold at optimal contrast agent concentration. Fig.2b shows the measurement of peak sound pressure level during active ZTE and EPI acquisition and compare the results to a scanner-idle state, highlighting the fact that ZTE has negligible acoustic noise.
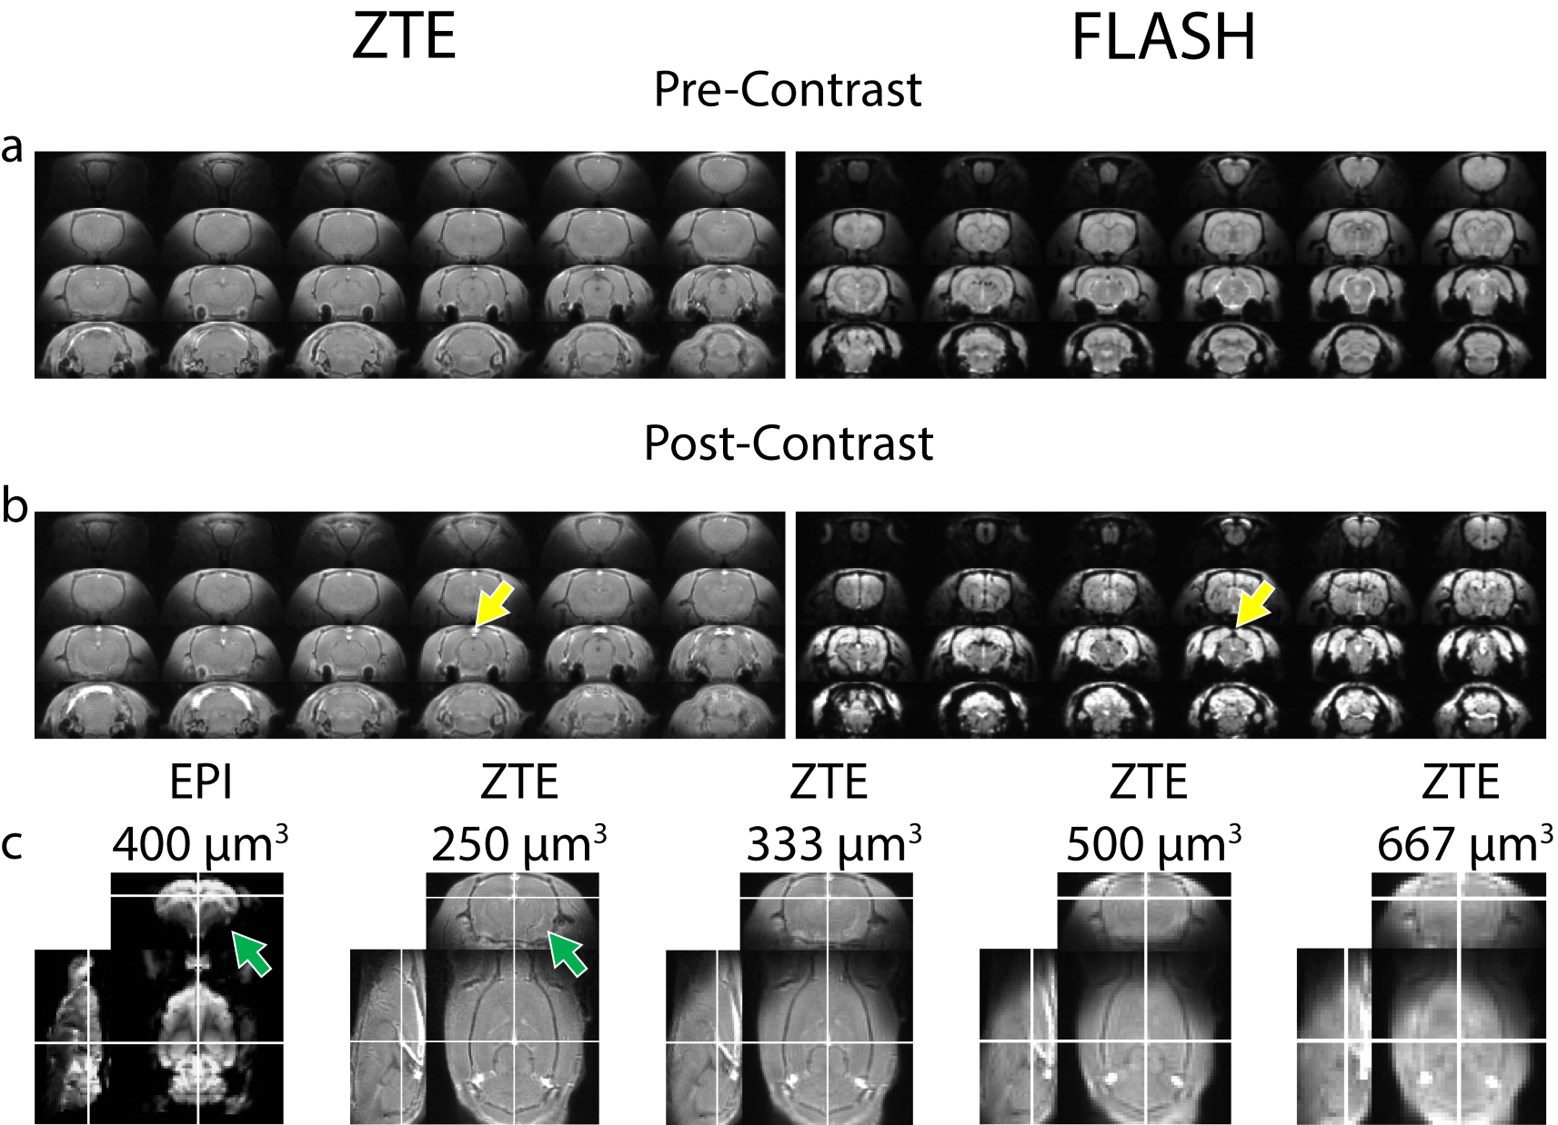
Next, we compared in-vivo ZTE and FLASH scans pre- and post-administration of iron oxide. Fig.3 shows that ZTE exhibits enhanced positive contrast in the vasculature (Fig.3b yellow arrows), while FLASH demonstrates negative contrast as expected. We also compared in-vivo ZTE images at various spatial resolutions with isotropic EPI. Notably, several brain areas showing susceptibility-related signal dropout in EPI are preserved in ZTE, particularly in amygdala (Fig.3c green arrows).
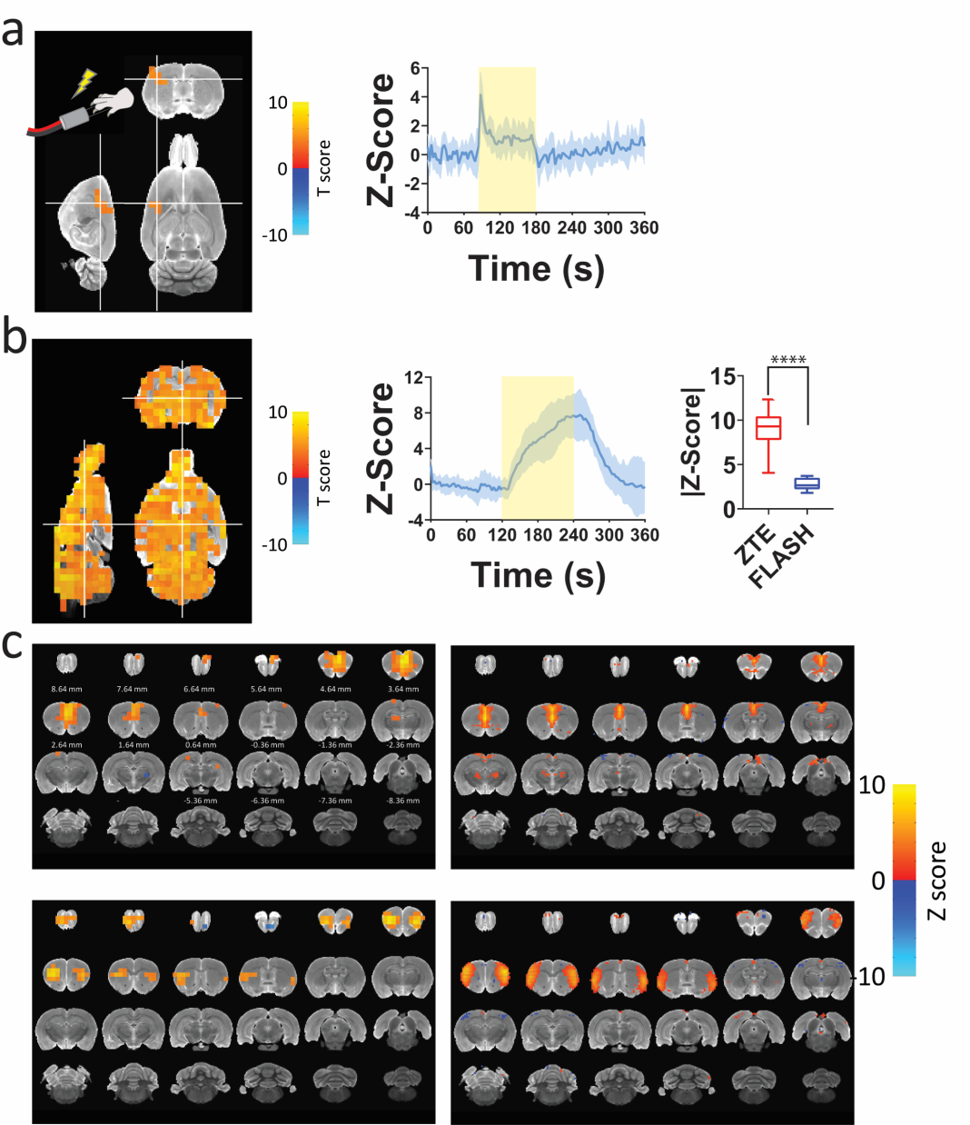
To confirm iZTE-fMRI is capable of detecting functoinal activation, we first confirmed activation using a well-established rat-forepaw stimulation paradigm (Fig.4a). Next, we compared iZTE- and FLASH-fMRI responses to hypercapnic gas challenge and demonstrated 3.2-fold higher tCNR (Fig.4b). Given GRE-based CBV-fMRI using iron oxide has been previously shown to have two to five fold higher sensitivity to BOLD3, the iZTE-fMRI should serve as a promising method for neuroimaging. Additionally, we have performed ICA analysis and extracted resting-state signal patterns highly resembled those detected by EPI-fMRI (Fig.4c).
Lastly, (Fig. 5) we demonstrated several ZTE artifacts that are associated with the use of spatially non-selective pulse and sensitivity to short-T2* species, causing coil housing, electronic elements, and animal bed aliasing into the FOV. We expect iZTE-fMRI performance can be further enhanced by aprotic equipment.
Acknowledgements
We thank UNC CAMRI members for their helpful discussions and critiques. This work is supported in part by NIH grants RF1MH117053, R01MH111429, R01NS091236, P60AA011605, and U54HD079124.References
1. Belliveau JW, Kennedy DN, Jr., McKinstry RC, Buchbinder BR, Weisskoff RM, Cohen MS, Vevea JM, Brady TJ, Rosen BR (1991) Functional mapping of the human visual cortex by magnetic resonance imaging. Science 254 (5032):716-719. doi:10.1126/science.1948051
2. Ogawa S, Menon RS, Tank DW, Kim SG, Merkle H, Ellermann JM, Ugurbil K (1993) Functional brain mapping by blood oxygenation level-dependent contrast magnetic resonance imaging. A comparison of signal characteristics with a biophysical model. Biophys J 64 (3):803-812. doi:10.1016/S0006-3495(93)81441-3
3. Mandeville JB, Marota JJ, Kosofsky BE, Keltner JR, Weissleder R, Rosen BR, Weisskoff RM (1998) Dynamic functional imaging of relative cerebral blood volume during rat forepaw stimulation. Magn Reson Med 39 (4):615-624. doi:10.1002/mrm.1910390415
4. Zeng H, Constable RT (2002) Image distortion correction in EPI: comparison of field mapping with point spread function mapping. Magn Reson Med 48 (1):137-146. doi:10.1002/mrm.10200
5. Olman CA, Davachi L, Inati S (2009) Distortion and signal loss in medial temporal lobe. PLoS One 4 (12):e8160. doi:10.1371/journal.pone.0008160
6. Keilholz SD, Silva AC, Raman M, Merkle H, Koretsky AP (2006) BOLD and CBV-weighted functional magnetic resonance imaging of the rat somatosensory system. Magn Reson Med 55 (2):316-324. doi:10.1002/mrm.20744
7. Chang PC, Procissi D, Bao Q, Centeno MV, Baria A, Apkarian AV (2016) Novel method for functional brain imaging in awake minimally restrained rats. J Neurophysiol 116 (1):61-80. doi:10.1152/jn.01078.2015
8. Jezzard P, Barnett AS, Pierpaoli C (1998) Characterization of and correction for eddy current artifacts in echo planar diffusion imaging. Magn Reson Med 39 (5):801-812. doi:10.1002/mrm.1910390518
9. Lehto LJ, Idiyatullin D, Zhang J, Utecht L, Adriany G, Garwood M, Grohn O, Michaeli S, Mangia S (2017) MB-SWIFT functional MRI during deep brain stimulation in rats. Neuroimage 159:443-448. doi:10.1016/j.neuroimage.2017.08.012
10. Kim MJ, Jahng GH, Lee SY, Ryu CW (2013) Functional magnetic resonance imaging with an ultrashort echo time. Med Phys 40 (2):022301. doi:10.1118/1.4773035
11. Zhang L, Zhong X, Wang L, Chen H, Wang YA, Yeh J, Yang L, Mao H (2011) T(1)-weighted ultrashort echo time method for positive contrast imaging of magnetic nanoparticles and cancer cells bound with the targeted nanoparticles. J Magn Reson Imaging 33 (1):194-202. doi:10.1002/jmri.22412
12. Zhang J, Chamberlain R, Etheridge M, Idiyatullin D, Corum C, Bischof J, Garwood M (2014) Quantifying iron-oxide nanoparticles at high concentration based on longitudinal relaxation using a three-dimensional SWIFT Look-Locker sequence. Magn Reson Med 71 (6):1982-1988. doi:10.1002/mrm.25181
Figures