1220
Ultrahigh-resolution Laminar fMRI Mapping of Cat Visual Cortex at 9.4T: Comparison of 2D GE-EPI and 3D iv-GRASE Sequences1Center for Magnetic Resonance Research, Department of Radiology, University of Minnesota, Minneapolis, MN, United States
Synopsis
Blood oxygenation-level dependent (BOLD) fMRI studies at the level mesoscopic organizations, such as cortical columns and layers, is challenged by the low signal-to-noise ratio (SNR) and the specificity of different fMRI sequences even at ultrahigh magnetic fields. In this work, we show that when mapping layer-specific activities in the cat visual cortex, ultrahigh-resolution 3D GRASE sequence with inner volume selection achieved similar specificity as at 9.4 Tesla CBV-fMRI using 2D GE-EPI sequence, while attains a higher BOLD sensitivity. Our results indicate that 3D iv-GRASE BOLD is promising for laminar and columnar mapping of brain functions.
Introduction
The blood oxygenation level-dependent (BOLD) contrast based on T2* weighted gradient echo-echo planar imaging (GE-EPI) is still the working horse for fMRI data acquisition due to its superior sensitivity and contrast; however, the large vessel contribution limits its utility in studying mesoscopic neuronal organizations like cortical layers and columns. In contrast, T2 weighted fMRI seems to have better spatial specificity to micro-vessels that is close to the neural activity sites1-3. However, high-resolution spin-echo (SE)-EPI often suffers from the low functional contrast-to-noise ratio (fCNR), making it challenging for the study of fine-scale neural organizations. 3D gradient-echo and spin-echo (GRASE) imaging with inner volume (iv) selection capability seem to be a promising alternative to the SE-EPI because of reported higher BOLD specificity and increased fCNR4,5. To evaluate further the specificity and fCNR of 3D GRASE BOLD and whether this sequence can provide functional maps of columns and layers, we compared it to cerebral blood volume (CBV) based functional mapping using a contrast agent on a cat model. The CBV based functional maps were obtained using the 3D iv-GRASE and conventional 2D GE-EPI sequences. The CBV based fMRI has been shown to be highly specific to the neuronal activity6,7. We also investigated the point spread function (PSF) and the sensitivity of the 3D iv-GRASE.Materials and Methods
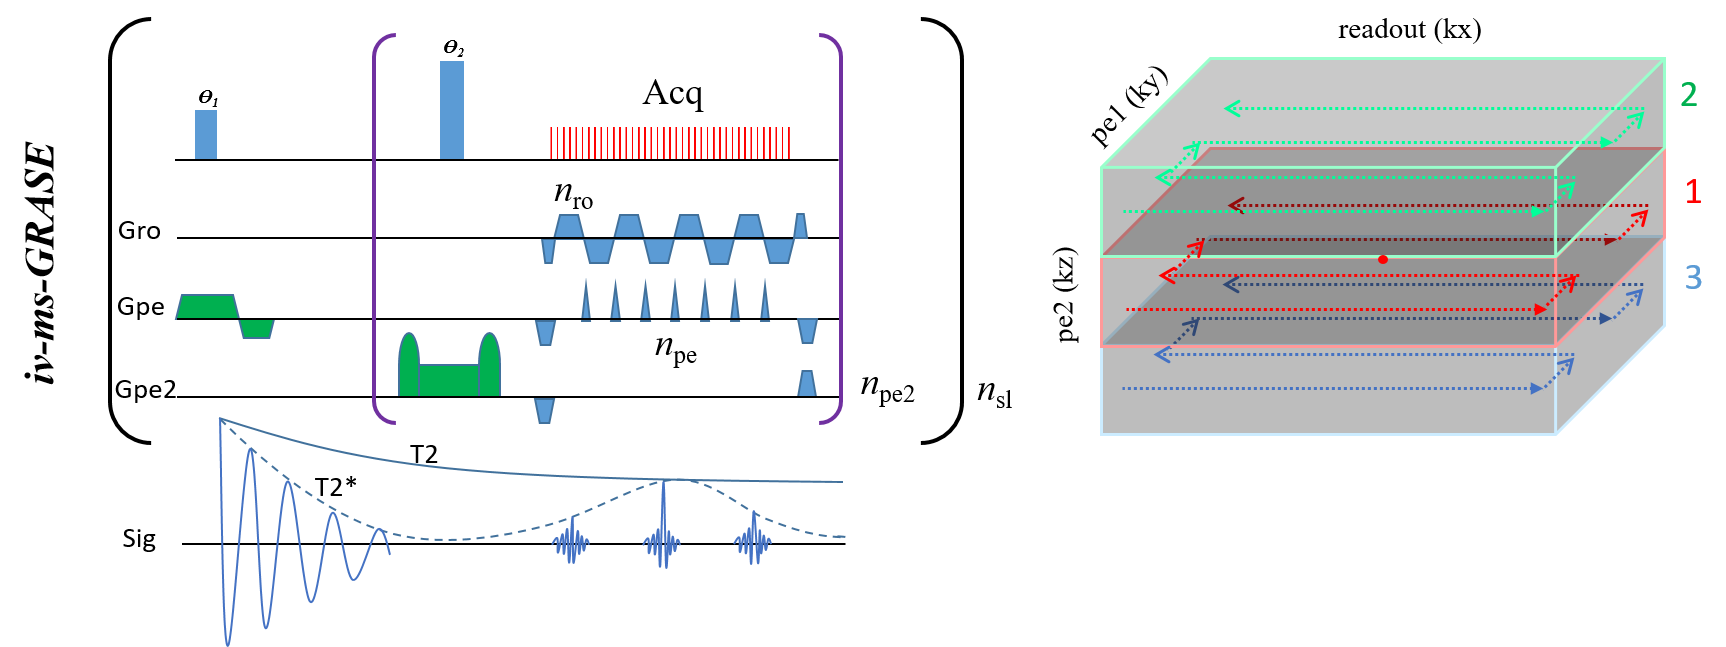
Animals and scan conditions: Four cats (1.0-2.0 kg) were scanned with the protocol approved by the University of Minnesota IACUC. All cats were initially anesthetized with ketamine and Xylazine cocktail (i.m.) and followed by 0.8-1.1% isoflurane during the experiment. The cats were mechanically ventilated, and an IV catheter was placed to allow the infusion of Feraheme as a contrast agent. A 1.5 cm diameter surface coil was placed on the top of the visual cortex for fMRI acquisition. A binocular full-field visual stimulation with block design (20s-15s-25s-15s-25s), black and white square-wave moving gratings (0.15 cycles/degree and 2 cycles/s) was used. The physiology of the animals was monitored and well-controlled throughout the study.MRI experiments and data analysis: The 3D iv-ms-GRASE sequence (Fig. 1) was developed and optimized on a 9.4T/31cm animal scanner (Varian/VNMRJ) for fMRI study8. The 2D GE-EPI fMRI data were acquired with TR/TE = 2000/20 ms, matrix = 128×128, FOV = 2.0×2.0 cm2, 0.5mm thickness, 4 segments, centric-out acquisition, and 15-20 averages. The 3D iv-GRASE data were acquired with the same nominal spatial resolution but a reduced FOV and matrix size along the phase encoding direction and an increased TE (time to the first echo) of 36 ms. Parametric T1, T2, T2* maps and PSF along each dimension were obtained. FMRI data were spatially smoothed with an FWHM of one voxel size and temporally smoothed with a bandpass filter of 0.01Hz-0.2Hz. The preprocessed data were then averaged and statistically analyzed using Stimulate9 and MATLAB to generate the BOLD and CBV maps10.
Results
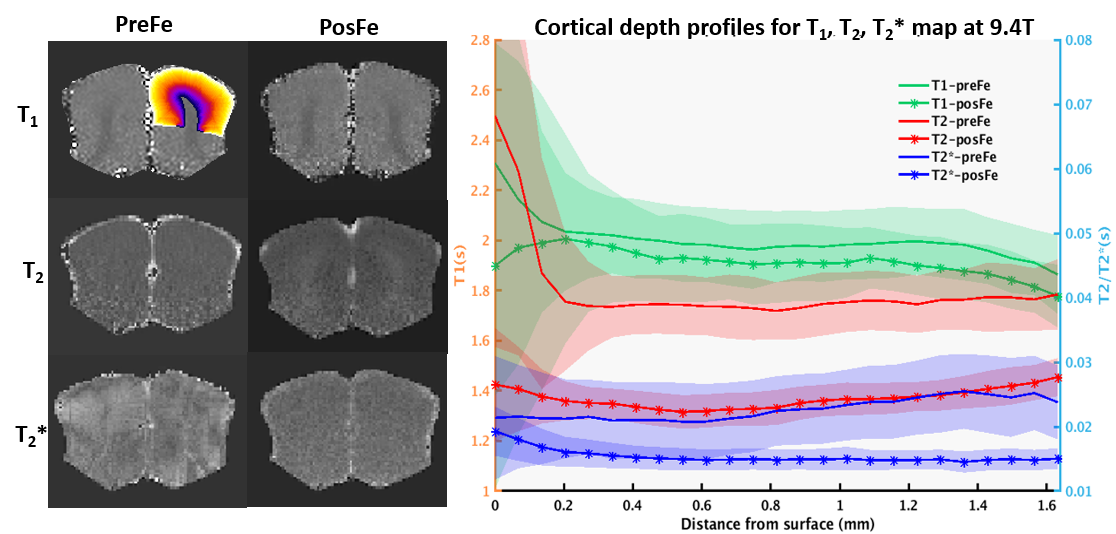
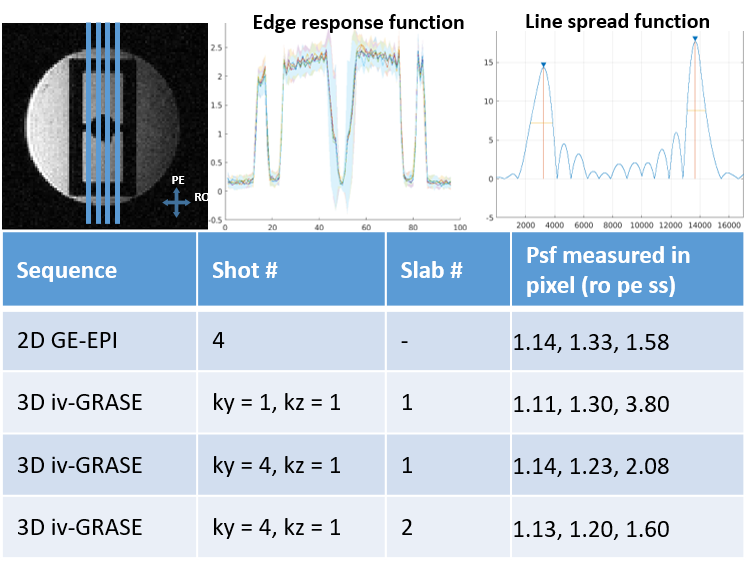
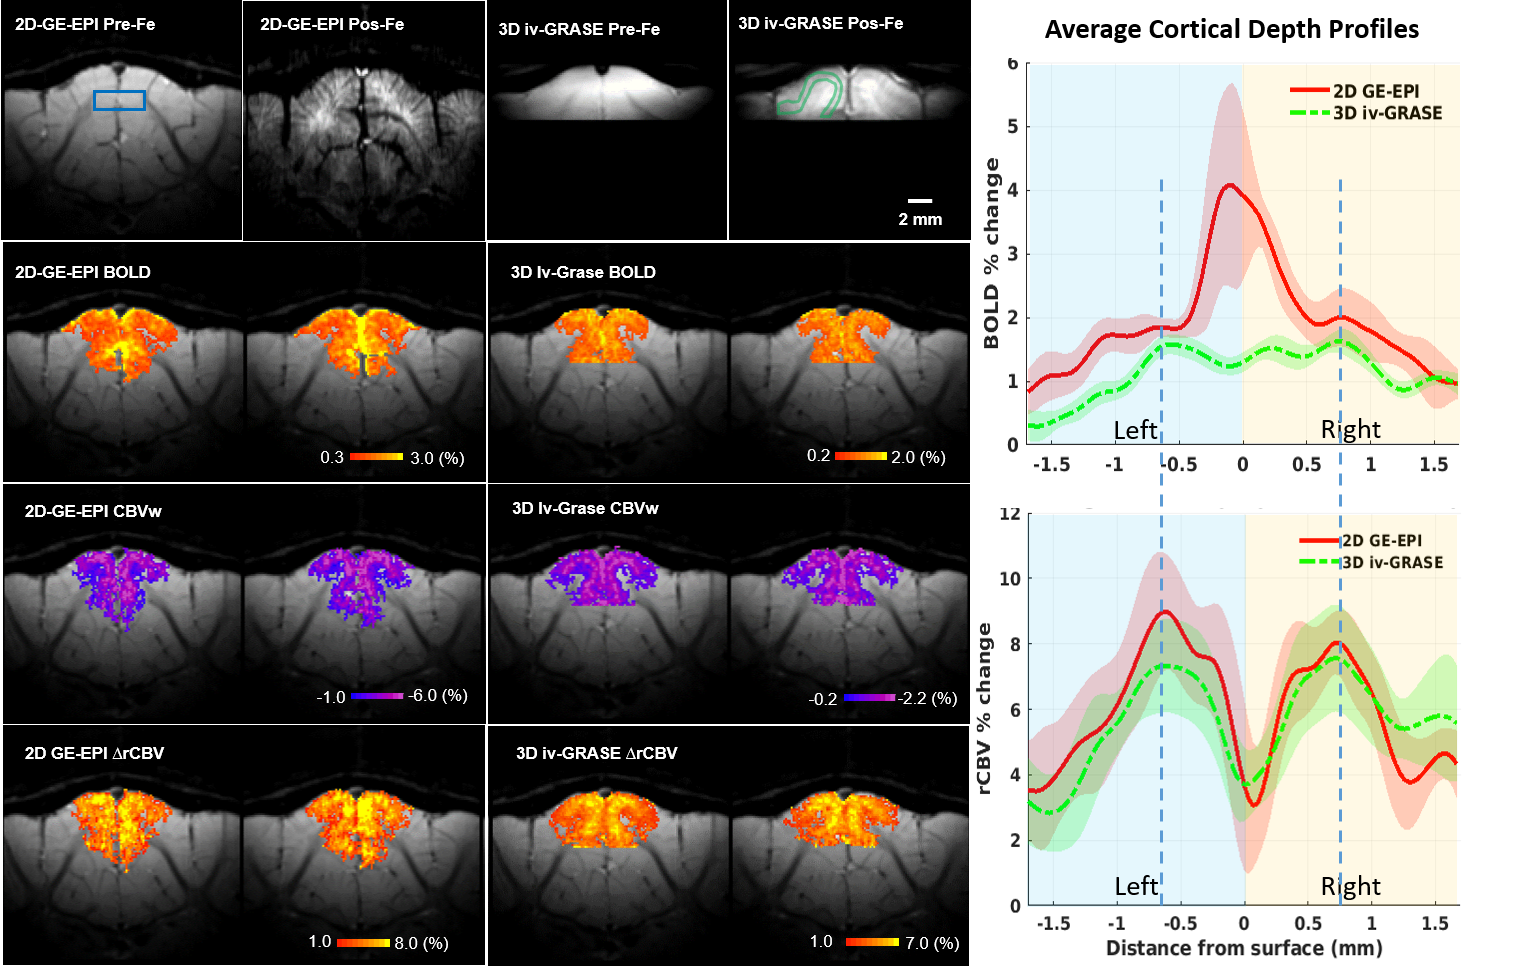
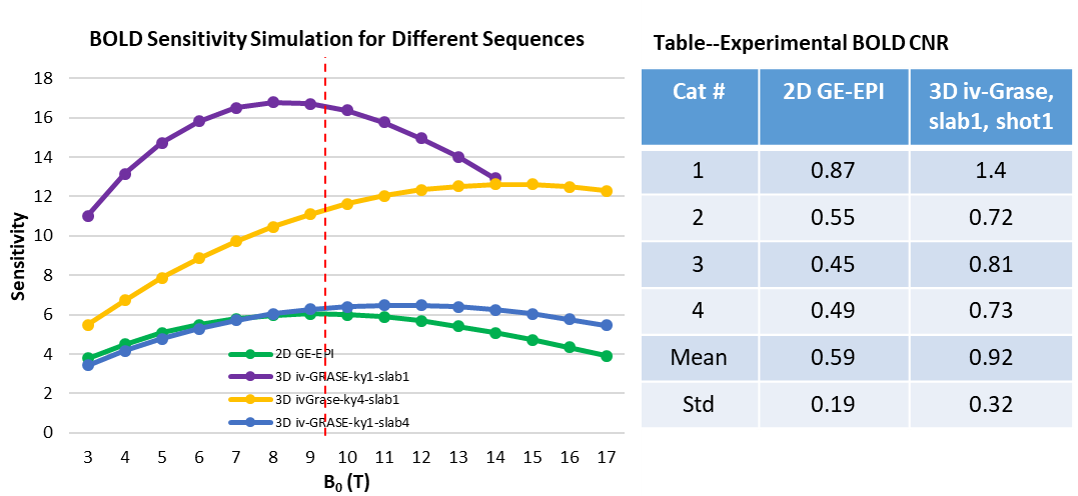
Fig. 1 shows the 3D iv-ms-GRASE imaging sequence. By orthogonalizing the excitation and refocusing pulses, we can image a small brain area (inner volume). To avoid a long spin-echo train and reduce the T2 blur along the second phase encoding, we can either perform multi-slab (ms) acquisition and/or multi-shot along the ky and/or kz direction(s). The measured T1, T2, T2* of the cat visual cortex at 9.4T as shown in Fig. 2 are 2000ms, 40ms and 24ms, respectively, and T2 and T2* were reduced to 24ms and 15ms after Feraheme injection for CBV imaging. Based on measured PSFs (see Fig. 3), 3D iv-GRASE has the strongest blur along the second phase encoding direction due to the T2 decay, which is consistent with literature4, though multiple shots and multiple slabs can reduce the PSF to the same level as that of 2D GE-EPI. BOLD, CBV maps and the associated cortical depth profiles shown in Fig. 4 clearly indicate that the strongest CBV response for both sequences lies in the middle layer (likely Layer IV) of the cat visual cortex (~0.7mm from surface) while GRASE BOLD suppresses the large vessel signal and achieves similar specificity as CBV profiles. The BOLD CNRs, defined as the ratio of averaged stimulation-induced signal change by the averaged standard deviation of the baseline signal fluctuations, were calculated as 0.59 and 0.92 for 2D GE-EPI and 3D iv-GRASE, respectively, as listed in Fig. 5.Discussion and conclusion
The high-resolution cortical depth profiles of relative BOLD and CBV changes indicate that 3D iv-GRASE BOLD has a better specificity than 2D GE-EPI BOLD, and is similar to that of CBV. The CNR of 3D iv-GRASE is 55% larger, indicating a higher BOLD sensitivity over 2D GE-EPI. However, the PSF along the second phase encoding direction for 3D iv-GRASE is 1.4 times larger than that along the slice selection direction for 2D GE-EPI. Using multiple shots and (or) multiple slabs could help to reduce the T2 blur but more 180 refocusing pulses are needed. In summary, 3D iv-GRASE BOLD has a superior specificity and sensitivity over the 2D GE-EPI BOLD and it can be potentially used to map layers and columns without exogenous contrast agents.Acknowledgements
This work was supported in part by NIH grants of R01 MH111413, R01 CA240953, U01 EB026978, S10 RR025031, P41 EB027061 and P30 NS076408.References
1. Duong, T. Q. et al. Microvascular BOLD contribution at 4 and 7 T in the human brain: Gradient-echo and spin-echo fMRI with suppression of blood effects. Magnet Reson Med 2003;49:1019-1027.
2. Yacoub, E. et al. Spin-echo fMRI in humans using high spatial resolutions and high magnetic fields. Magnet Reson Med 2003;49:655-664.
3. Yacoub, E., Shmuel, A., Logothetis, N., et al. Robust detection of ocular dominance columns in humans using Hahn Spin Echo BOLD functional MRI at 7 Tesla. Neuroimage 2007;37:1161-1177.
4. Kemper, V. G. et al. Sub-millimeter T-2 weighted fMRI at 7 T: comparison of 3D-GRASE and 2D SE-EPI. Front Neurosci-Switz 2015;9.
5.Zimmermann, J. et al. Mapping the Organization of Axis of Motion Selective Features in Human Area MT Using High-Field fMRI. Plos One 2001;6.
6. Kim, S. G. Biophysics of BOLD fMRI investigated with animal models. J Magn Reson 2018;292:82-89.
7. Kim, S. G. et al. Cerebral blood volume MRI with intravascular superparamagnetic iron oxide nanoparticles. NMR Biomed 2013;26:949-962.
8. Djaudat Idiyatullin, W. Z., Yi Zhang, et al. Novel multi-slab GRASE sequences for fMRI. Comparison with EPI. ISMRM (2018).
9. Strupp, J. P. Stimulate: a GUI based fMRI analysis software package. Neuroimage 1996;3:S607.
10. Zhao, F. Q., Wang, P., Hendrich, et al. Cortical layer-dependent BOLD and CBV responses measured by spin-echo and gradient-echo fMRI: Insights into hemodynamic regulation. Neuroimage 2006;30:1149-1160.
Figures