1219
Multi-Echo Multi-Segment EPI Based fMRI Using Sliding-Window Acquisition and Multiplexed Sensitivity Encoding (MUSE)1The University of Hong Kong, Hong Kong, Hong Kong, 2Graduate Institute of Biomedical Electronics and Bioinformatics, National Taiwan University, Taipei, Taiwan, Taipei, Taiwan, 3Philips Healthcare, Hong Kong, China, Hong Kong, Hong Kong, 4Department of Biomedical Engineering, University of Arizona, Tucson, AZ, United States, Tucson, AZ, United States, 5Brain Imaging and Analysis Center, Duke University Medical Center, Durham, NC, United States, Durham, NC, United States, 6Department of Medical Imaging, China Medical University Hsinchu Hospital, Taiwan, Taipei, Taiwan
Synopsis
Multi-echo fMRI (ME-fMRI) has been shown to be useful in differentiating BOLD and non-BOLD signals, therefore improving the sensitivity of fMRI. Parallel imaging with high acceleration factor (e.g., R ≥ 3) is indispensable to achieve reasonable TE interval and desired spatial resolution for ME-fMRI acquisition. However, the reconstructed multi-echo images with high acceleration factor may suffer from underside noise amplification due to SENSE reconstruction. In this work, we further modify multi-echo multi-segment EPI (MEMS-EPI) technique with sliding window acquisition to acquire multi-echo fMRI with high acceleration factor, and then reconstruct highly accelerated multi-echo fMRI images with MUSE algorithm.
Introduction
Multi-echo fMRI (ME-fMRI) has been shown to be useful in differentiating BOLD and non-BOLD signals1, therefore improving the sensitivity of fMRI. Parallel imaging with high acceleration factor (e.g., R ≥ 3) is indispensable to achieve reasonable TE interval and desired spatial resolution for ME-fMRI acquisition. However, the reconstructed multi-echo images with high acceleration factor may suffer from underside noise amplification due to SENSE reconstruction2, thus limiting the attainable spatial resolution. Our previous work shows that a multi-echo multi-segment EPI (MEMS-EPI) technique with parametric POCSMUSE reconstruction can improve the resolution and quality of ME-fMRI data with high acceleration factor (i.e., R = 4). Moreover, the MUSE3 framework can also enable high-resolution fMRI with single-echo interleaved EPI acquisition. In this work, we proposed a modified MEMS-EPI sequence to enable sliding-window acquisition and data reconstruction with MUSE framework. Afterward, we investigated the reconstruction performance of MUSE, SENSE and parametric POCSMUSE4, for the ME-fMRI data acquired with high acceleration factor.Methods
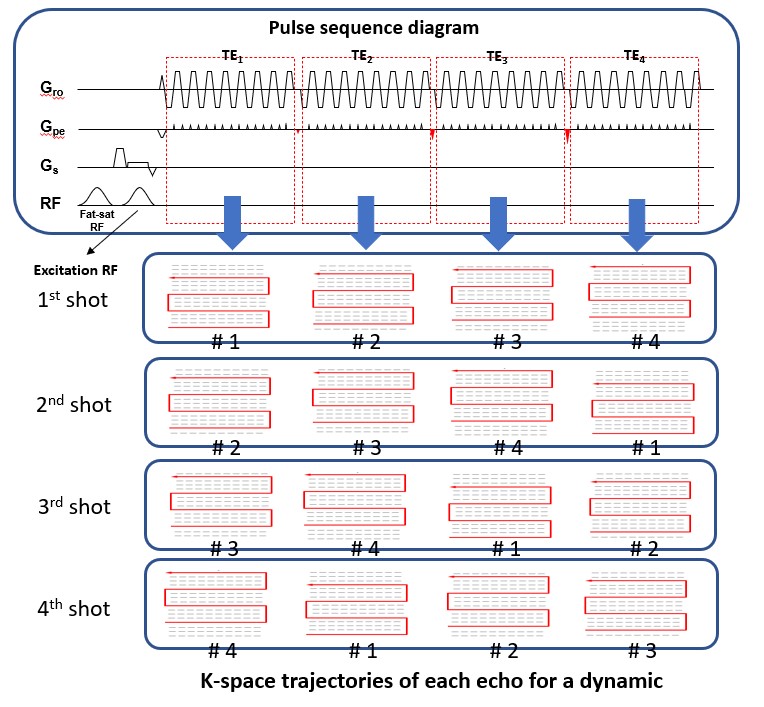
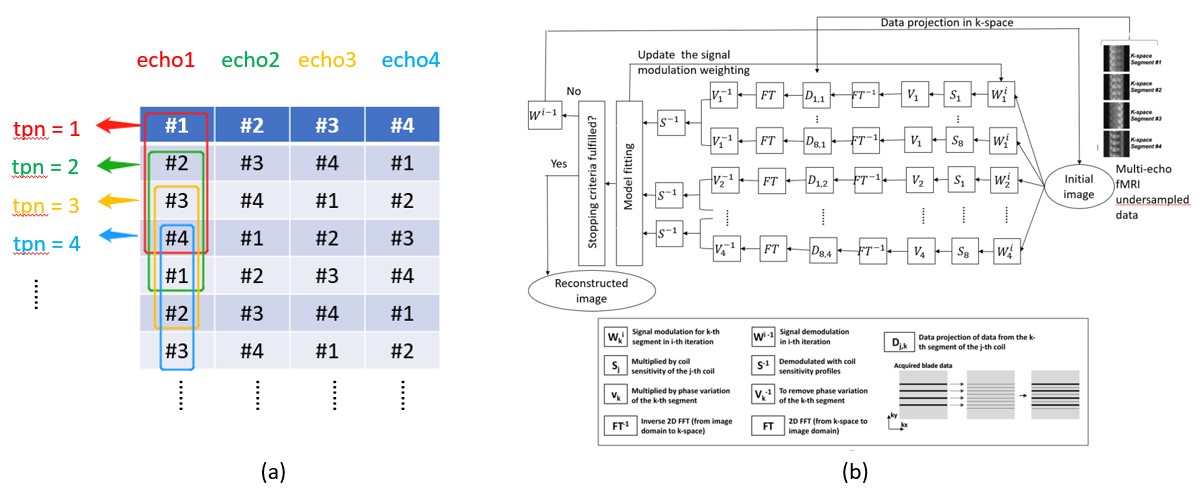
Data acquisition: Two sets of resting-state fMRI (rsfMRI) data with different spatial resolution were acquired from one healthy subject on a 3.0T MRI scanner (Achieva TX, Philips Healthcare, Best, The Netherlands) using an 8-channel head coil. A modified MEMS-EPI pulse sequence with sliding-window acquisition for each echo (Figure 1) was used to acquire multi-echo rsfMRI data. The scan parameters are shown as follow: TR = 2000ms, matrix size = 64×68 and 96×100, FOV = 256mm, number of slice = 24, slice thickness = 4mm, number of echo = 4, acceleration factor = 4 for each echo, TE64x68 = [11.5, 22.7, 33.9, 45.1]ms, and TE96x100 = [9.2, 26.2, 43.2, 60.2]ms.Reconstruction: For MUSE reconstruction, the segment data acquired from 4 consecutive time points (tpn) was combined to a full k-space data for each echo, with a sliding-window reconstruction scheme for producing fully-sampled image at each time point (Figure 2a). In addition, the data of each time point was reconstructed with previously reported parametric POCSMUSE framework (Figure 2b) and SENSE.
Evaluation and data analysis: The quality of multi-echo fMRI data reconstructed with MUSE, SENSE and parametric POCSMUSE were evaluated on temporal fluctuation noise image and signal-to-fluctuation ratio map. The combination of multi-echo data was performed before rsfMRI analysis using either equation (1) or equation (2). Assuming constant noise level present in each echo, the optimal weighting of nth echo can be approximated as5
TEn = $$\frac{TEn\cdot\overline{S}n}{\sum_nTEn\cdot\overline{S}n}$$(1)
where Sn is the average intensity across the time series of the nth echo. A T2* weighting scheme for optimal echo combination is described as6
TEn = $$\frac{TEn\cdot\exp(-\frac{TEn}{T2*})}{\sum_nTEn\cdot\exp(-\frac{TEn}{T2*})}$$(2)
Afterward, the echo-combined rsfMRI data were subsequently analysed using MELODIC implemented in FSL (FMRIB's Software Library, www.fmrib.ox.ac.uk/fsl ). The default mode network (DMN) derived from images reconstructed with three different methods was evaluated. We also extracted and compared the mean time courses of posterior cingulate cortex (PCC, seed IC for DMN). We assumed that the multi-echo images produced from MUSE algorithm could only provide sliding-window averaged time-course signal due to the combination of full k-space data. To achieve a fair comparison, we applied the similar sliding-window averaging to the time-course signal for the rsfMRI data produced from the other two reconstruction methods.
Results
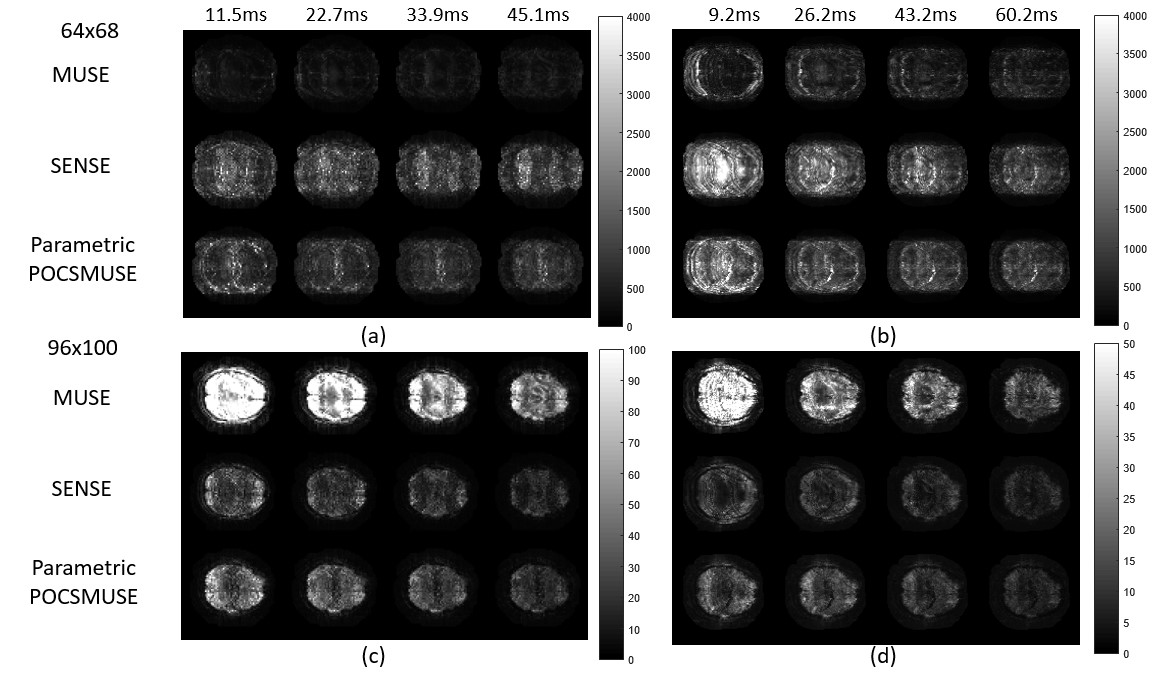
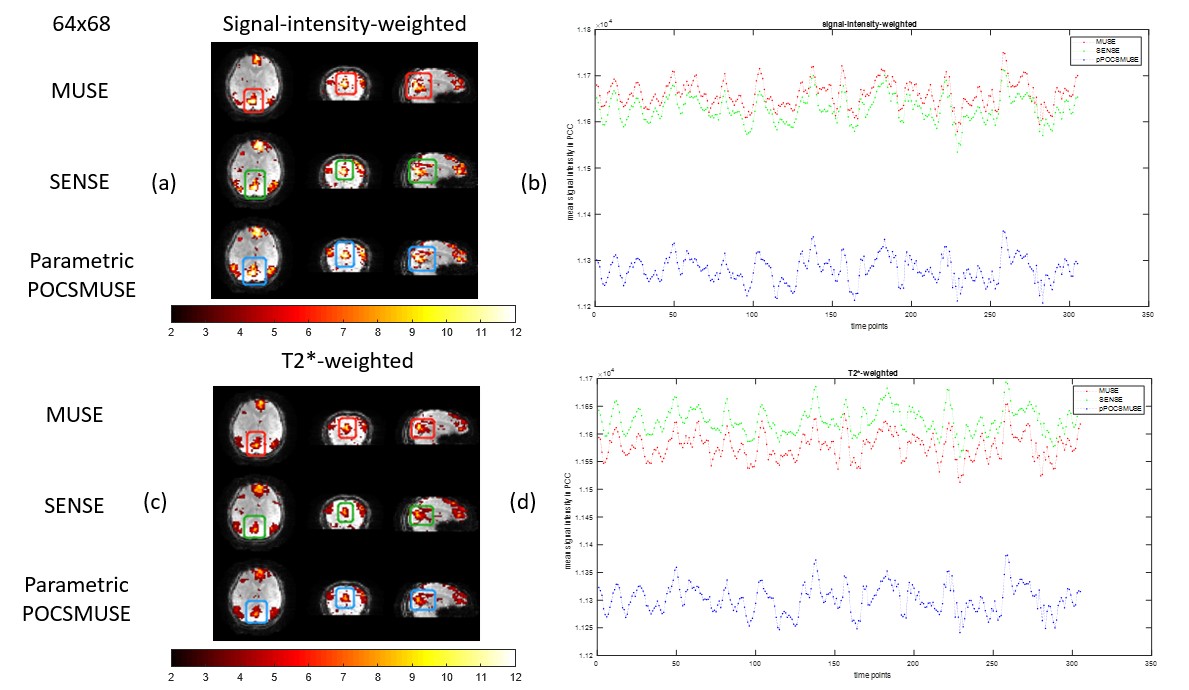
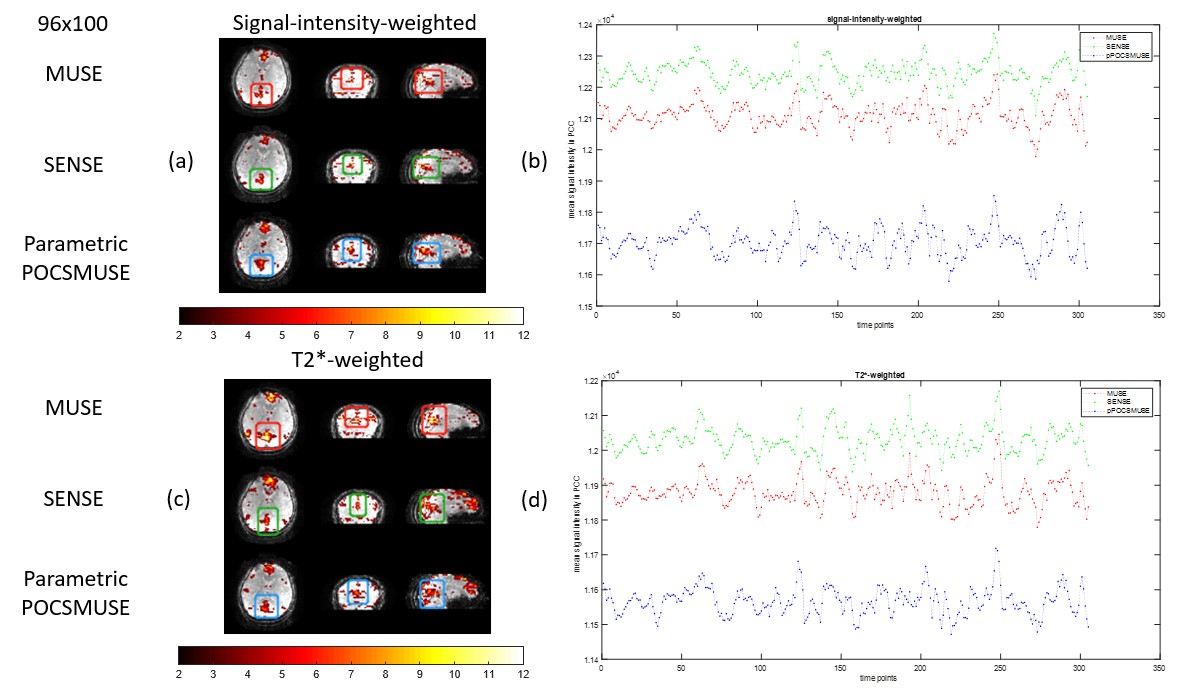
Figures 3 shows the temporal fluctuation noise image (Figures 3a & 3b) and signal-to-fluctuation ratio map (Figures 3c & 3d) measured from two datasets with different spatial resolution (i.e., 64×68 and 96×100) reconstructed with MUSE, SENSE, and parametric POCSMUSE. The left panels of both figures 4 and 5 show the results of DMNs derived from low-resolution (i.e., 64x68) and high-resolution (i.e., 96x100) rsfMRI data produce from three different reconstruction methods with two different echo combination strategies. The right panels of both Figures 4 and 5 show the mean time courses of PCC extracted from low-resolution (i.e., 64x68) and high-resolution (i.e., 96x100) rsfMRI data produced from three different reconstruction methods with two different echo combination strategies.Discussion and conclusion
In this work, we have modified MEMS-EPI sequence with sliding window acquisition for ME-fMRI, thereby enabling data reconstruction using MUSE algorithm. ME-fMRI images reconstructed with MUSE reveal lower temporal fluctuation noise and higher signal-to-fluctuation ratio compared to the other two reconstruction methods. The different echo combination methods may affect the DMN identification and the mean time courses in PCC. For low-resolution rsfMRI data, the multi-echo images combined with signal-intensity-weighting reveals better results in deriving DMN. In contrast, the multi-echo images combined with T2*-weighting provide DMN mapping for high-resolution rsfMRI data. The proposed MUSE reconstruction for ME-fMRI can produce comparable results to previously reported method. One major advantage of MUSE reconstruction is less time consuming than parametric POCSMUSE which requires iterative calculation. All data were acquired from a single subject is the major limitation of this study. Future study and investigation are required to evaluate the performances of three reconstruction methods with a group data analysis. In conclusion, high-resolution ME-fMRI images can be achieved by using the proposed MEMS-EPI acquisition and MUSE reconstruction.Acknowledgements
The work was in part supported by grants from Hong Kong Research Grant Council (GRF HKU17138616 and GRF HKU17121517), and Hong Kong Innovation and Technology Commission (ITS/403/18).References
1. Kundu, P., V. Voon, P. Balchandani, et al. Multi-echo fMRI: A review of applications in fMRI denoising and analysis of BOLD signals. Neuroimage. 2017; 154: 59-80.
2. Pruessmann, K.P., M. Weiger, M.B. Scheidegger, and P. Boesiger. SENSE: sensitivity encoding for fast MRI. Magnetic resonance in medicine. 1999; 42(5): 952-962.
3. Chen, N.-k., A. Guidon, H.-C. Chang, and A.W. Song. A robust multi-shot scan strategy for high-resolution diffusion weighted MRI enabled by multiplexed sensitivity-encoding (MUSE). Neuroimage. 2013; 72: 41-47.
4. Chu, M.L., H.C. Chang, K. Oshio, and N.k. Chen. A single‐shot T2 mapping protocol based on echo‐split gradient‐spin‐echo acquisition and parametric multiplexed sensitivity encoding based on projection onto convex sets reconstruction. Magnetic resonance in medicine. 2018; 79(1): 383-393.
5. Bhavsar, S., M. Zvyagintsev, and K. Mathiak. BOLD sensitivity and SNR characteristics of parallel imaging-accelerated single-shot multi-echo EPI for fMRI. Neuroimage. 2014; 84: 65-75.
6. Posse, S., S. Wiese, D. Gembris, et al. Enhancement of BOLD‐contrast sensitivity by single‐shot multi‐echo functional MR imaging. Magnetic Resonance in Medicine: An Official Journal of the International Society for Magnetic Resonance in Medicine. 1999; 42(1): 87-97.
Figures