1218
Feasibility of high spatial and temporal resolution multi-echo multi-band whole brain resting-state functional MRI on a compact 3T system1Mayo Clinic, Rochester, MN, United States, 2Hanyang University, Seoul, Republic of Korea, 3Hospital of Special Surgery, New York, NY, United States, 4GE Global Research, Niskayuna, NY, United States
Synopsis
Multi-echo fMRI has been shown to provide better denoising and result in improved functional analysis compared to single-echo acquisition, but it reduces the temporal resolution and inhibits high-resolution imaging. Multi-band imaging and in-plane acceleration can compensate for the reduced resolution. The high performance gradient on a compact 3T scanner can further reduce the echo-spacing and accelerate the acquisition. Here we demonstrate that high spatial-resolution ME-MB fMRI is achievable with high temporal resolution on the compact 3T. The effectiveness of ME acquisition is evaluated with different artifact reduction strategies in whole brain resting-state fMRI and compared with the standard SE acquisition.
Introduction
Functional MRI (fMRI) suffers from various types of artifacts related to hardware and the specific imaging subject (e.g. physiological fluctuations and motion). Multi-echo (ME) fMRI has been shown to allow better de-noising performance, and result in improved functional analysis compared to single-echo (SE) acquisition [1, 2]. However, acquiring extra echoes reduces the temporal resolution and inhibits high-resolution imaging, as the echoes acquired beyond T2* decay have low signal intensities. Multi-band (MB) imaging can compensate for the reduced temporal resolution. In-plane acceleration can help to reduce echo spacing, but is limited by the coil g-factor [3]. The high performance gradients (80mT/m and 700 T/m/s) on a compact 3T (C3T) scanner [4, 5] can further reduce the echo-spacing and thus readout duration. In this work, we demonstrate that high spatial-resolution ME-MB fMRI is achievable with high temporal resolution on the C3T. The effectiveness of ME acquisition is evaluated with several different artifact reduction strategies in whole-brain resting-state (rs) fMRI and compared with the standard SE acquisition.Methods
Under an IRB-approved protocol and with written informed consent, T1-weighted anatomical and MB-ME rs-fMRI data (TR=1.8s, TE=12.1, 34.3, 56.5ms, FA=74°, ARC (in-plane acceleration)×MB×ME factors=3×3×3 (9x acceleration), voxel size 1.4×1.4×2.8 mm3, 51 slices, total scan time = 7 min.) was obtained with a 32-channel head coil (Nova Medical, Wilmington, MA, USA) on the C3T for 7 healthy subjects. Respiration and cardiac pulses were recorded during fMRI scan. For ME denoising, MEICA [1] was compared with conventional regression with RETROICOR [6] plus anatomically modeled signals (ANATICOR) [7]. The regression was applied to SE data (middle echo used only) and T2*-weighted combined (T2WC) ME data [2]. For each subject, adjusted explained variance (R2) of noise components was calculated as a metric for denoising performance. Temporal signal-to-noise ratio (tSNR) was assessed. The functional connectivity (FC) maps were derived by a seed-based correlation method for default-mode network (DMN). The preprocessing pipeline diagrams were shown in Fig. 1. The fMRI and T1 anatomical data processing were performed with AFNI software [8] and FreeSurfer software [9], respectively.Results
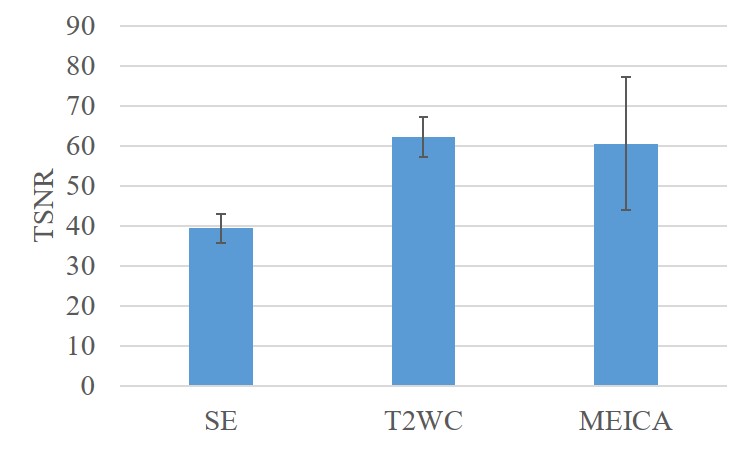
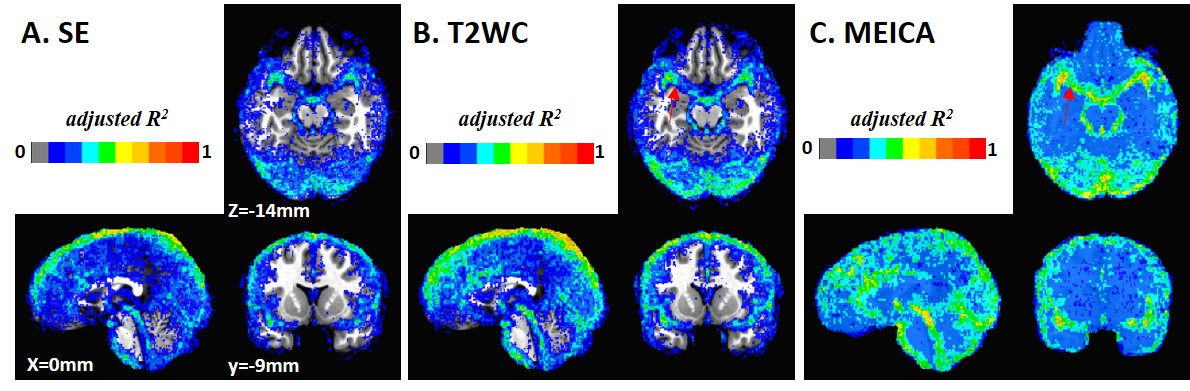
Data from one of seven subjects were rejected as only 8 ICA components were found to be BOLD-like. After denoising using MEICA decomposition, BOLD-like signals consisted of 20.5 (±4.4, standard deviation) of 228 ICA components on average across all subjects. In the conventional regression method, 32 regressors (7 polynomial, 12 motional and 13 physiological) were used for 230 time points. Overall tSNR was higher for T2WC using both conventional regression and MEICA than using only single echo (Fig. 2).R2 map comparison shows that both denoising methods can detect not only head motion, but more physiological artifacts (e.g. pulsing arteries and draining veins) in the inner brain region, as indicated by arrows in Fig. 3. There was no difference in R2 maps between SE and T2WC. MEICA showed relatively higher R2 values over the whole brain.
The comparison of group DMN FC maps (Fig. 4) shows that MEICA has a similar correlation patterns with SE and T2WC. But MEICA detected much clearer correlation patterns. A correlation between posterior cingulate cortex (seed point) and the cerebellum was observed (arrows in Fig. 4).
Discussion
In this study, we performed high spatial-temporal-resolution whole-brain ME-fMRI experiment on a C3T scanner. When the same spatial resolution and acceleration technique were applied on a conventional whole-body scanner (gradient performance: 50mT/m and 200 T/m/s), the three TEs were 20.5, 62.1, and 103.6 ms, which resulted in a long TR of 2800ms. In addition, the late TE image suffered from severe distortion, signal dropout and low SNR. Hence, all the in-vivo fMRI experiments were conducted solely on the C3T scanner due to the improved performance.The tSNR of combined ME fMRI time series was markedly increased compared to single echo. Denoising of MEICA decomposition was able to identify more non-BOLD-like components and exposed stronger correlation between brain regions than the standard analysis pathway. Robust correlation patterns in group analysis demonstrated the benefit of multi-echo and ICA decomposition.
Conclusion
The high-performance gradient on the C3T enables whole-brain high spatial-temporal resolution ME-MB rs-fMRI. Improvement in tSNR for the combined ME over SE fMRI was observed. When applied with an effective noise reduction technique such as the MEICA, higher BOLD sensitivity and better function connectivity analysis can be achieved.Acknowledgements
The authors would like to thank Dr. Brice Fernandez from GE Healthcare for providing ME-MB fMRI pulse sequence. This work was supported by NIH U01 EB024450 and NHI U01 EB026979.References
1. Kundu, P., et al., Differentiating BOLD and non-BOLD signals in fMRI time series using multi-echo EPI. NeuroImage, 2012. 60(3): p. 1759-1770.
2. Poser, B.a., et al., BOLD contrast sensitivity enhancement and artifact reduction with multiecho EPI: Parallel-acquired inhomogeneity-desensitized fMRI. Magnetic Resonance in Medicine, 2006. 55(6): p. 1227-1235.
3. Setsompop, K., D.A. Feinberg, and J.R. Polimeni, Rapid brain MRI acquisition techniques at ultra-high fields. NMR in Biomedicine, 2016. 29(9): p. 1198-1221.
4. Foo, T.K.F., et al., Lightweight, compact, and high-performance 3T MR system for imaging the brain and extremities. Magn Reson Med, 2018. 80(5): p. 2232-2245.
5. Tan, E.T., et al., High slew-rate head-only gradient for improving distortion in echo planar imaging: Preliminary experience. J Magn Reson Imaging, 2016. 44(3): p. 653-64.
6. Glover, G.H., T.Q. Li, and D. Ress, Image-based method for retrospective correction of physiological motion effects in fMRI: RETROICOR. Magnetic Resonance in Medicine, 2000. 44(1): p. 162-167.
7. Jo, H.J., et al., Mapping sources of correlation in resting state FMRI, with artifact detection and removal. Neuroimage, 2010. 52(2): p. 571-82.
8. Cox, R.W., AFNI: software for analysis and visualization of functional magnetic resonance neuroimages. Comput Biomed Res, 1996. 29(3): p. 162-73.
9. Reuter, M., et al., Within-subject template estimation for unbiased longitudinal image analysis. Neuroimage, 2012. 61(4): p. 1402-18.
Figures