1210
Assessing lung perfusion in pulmonary hypertension1POLARIS, Department of Infection, Immunity and Cardiovascular Disease, The University of Sheffield, Sheffield, United Kingdom, 2Insigneo Institute for in silico Medicine, The University of Sheffield, Sheffield, United Kingdom, 3GlaxoSmithKline R&D Ltd, Stevenage, United Kingdom, 4Sheffield Pulmonary Vascular Disease, Sheffield Teaching Hospitals NHS Trust, Sheffield, United Kingdom, 5Department of Infection, Immunity and Cardiovascular Disease, The University of Sheffield, Sheffield, United Kingdom
Synopsis
Pulmonary arterial hypertension (PAH) is a condition that impacts on lug perfusion and right ventricular function. This work aimed to assess i) the diagnostic utility of relative pulmonary perfusion parameters to distinguish patients with PAH from healthy controls and ii) changes in lung perfusion in 2 patient groups with PAH: newly diagnosed patients initiating and patients escalating treatment and clinically stable patients who had no escalation of treatment.
Introduction
Pulmonary arterial hypertension (PAH) is highly heterogeneous with high morbidity and mortality1. Currently specific therapies exist for PAH and chronic thromboembolic pulmonary hypertension (CTEPH), where dynamic contrast-enhanced magnetic resonance imaging (DCE-MRI)2 has demonstrated clinical utility in screening for CTEPH3 and identifying abnormalities in PAH, though clinical utility in PAH is not proven. We examined whether semi-quantitative metrics4,5 derived from DCE-MRI may show changes in response to treatment or be able to differentiate between stable patients with PAH and those undergoing treatment initiation or escalation.Purpose
To assess semi-quantitative measures of relative pulmonary blood volume (rPBF), flow (rPBF), transit time (rMTT) and the full width half maximum (FWHM) in the lungs of healthy controls and patients with PAH using first pass DCE-MRI.Methods
A subset of data from 17 patients with PAH and 10 age-matched healthy controls from a larger MRI study in PAH6 was analysed retrospectively. Healthy controls and patients were scanned twice within 12 months. Patients were separated into two groups: Patient group 1 represents those patients initiating or escalating PAH therapy, whilst patient group 2 represents patients with PAH who were deemed to be clinically stable who had no change in treatment.Imaging: Imaging was carried out at 1.5T (HDx, GE Healthcare, Milwaukee, WI) using an 8-element 1H chest receiver coil. A three-dimensional time-resolved spoiled gradient echo sequence with view-sharing7 and 48 time-frames was used. Imaging began at the same time as the injection of Gadovist (0.05ml/kg at 4ml/s, saline flush of 20ml). Cine MRI of cardiac Right ventricle (RV) function was performed using a short axis stack of bSSFP 2D slices with cardiac gating8.
Image analysis: Timeframes 2 to 48 were co-registered to the first time-frame9. Lung parenchyma was manually delineated from the first time frame10, with major vessels semi-automatically removed. rPBV, rPBF and rMTT4 were calculated following in-plane subsampling of images by 50%. FWHM of the bolus passage through each voxel within the lung mask was also calculated. Whole lung mean values and interquartile ranges (IQR) are reported for all metrics. RV mass (RVEDMT), end diastolic volume (RVEDVTT), end systolic volume (RVESVTT), stroke volume (RVSVTT), ejection fraction (RVEFFT) and cardiac output were calculated (RVCOTT) from the Cine images.
Statistical analysis: Statistical analysis was carried out using Graphpad Prism V7 for Mac (GraphPad Software, La Jolla, CA, USA). Group comparisons were carried out using either a one-way analysis of variance using Tukeys correction for multiple comparisons or Kruskal-Wallis test using Dunn’s test for multiple comparisons based on the results of the D’agostino and Pearson normality test. Spearman/Pearson correlations were carried out between lung perfusion metrics and RV metrics change between visits (Δ, defined as visit 2-visit 1). No correction for multiple comparisons was made when comparing visit 1 to visit 2, with statistical significance defined as p<0.05.
Results
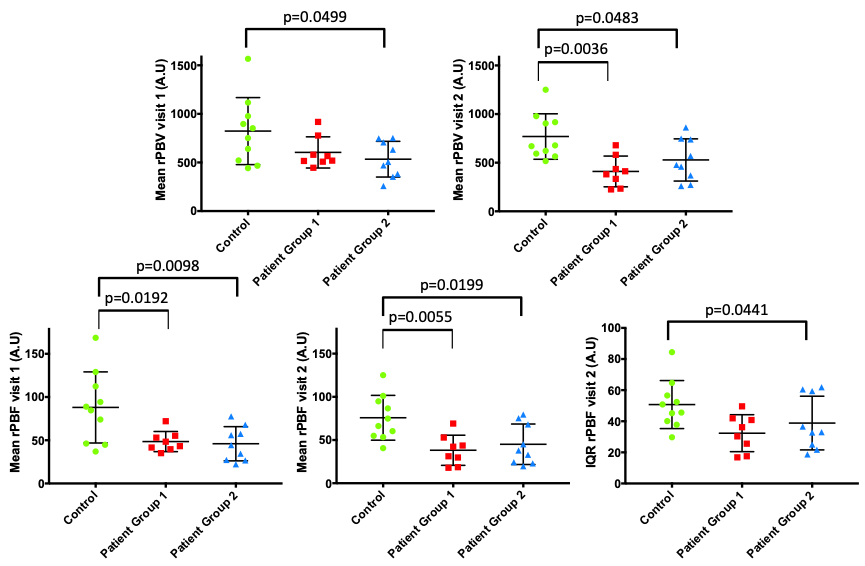
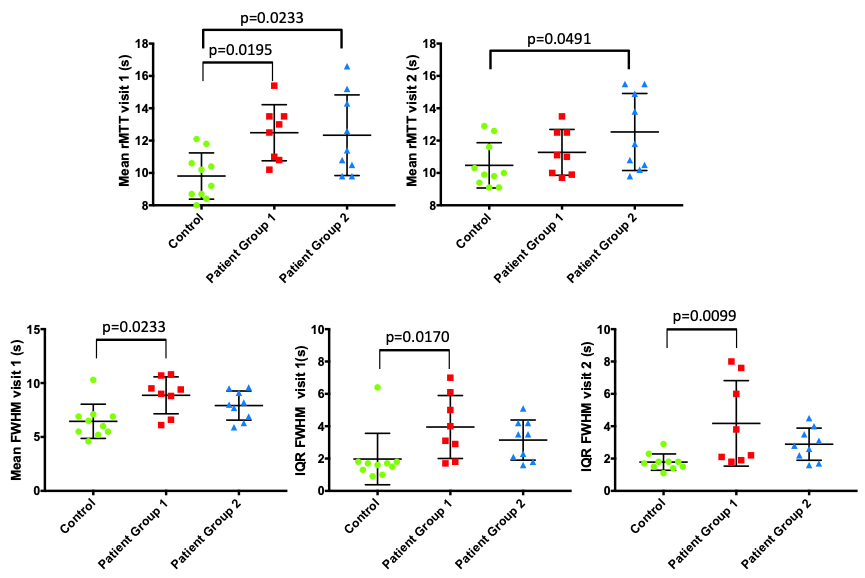
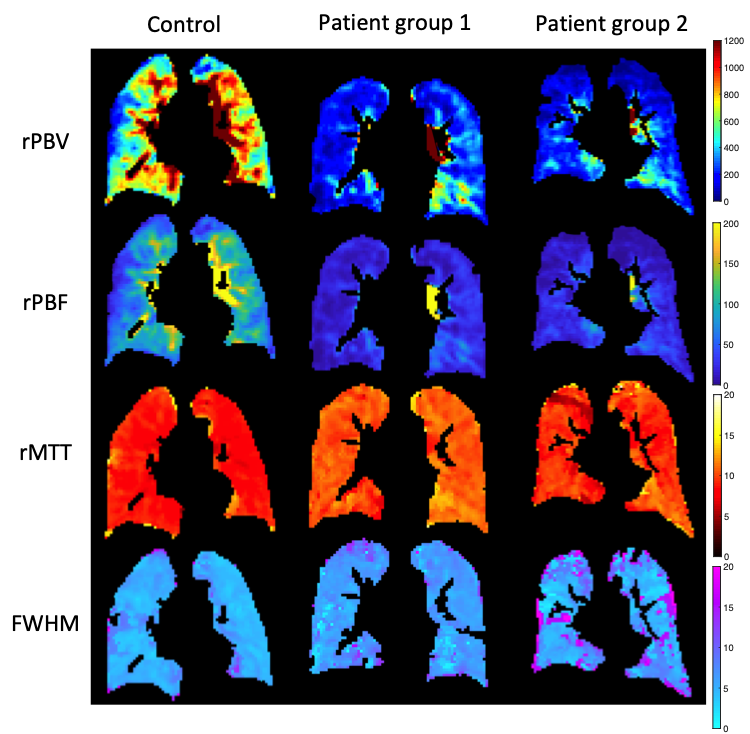
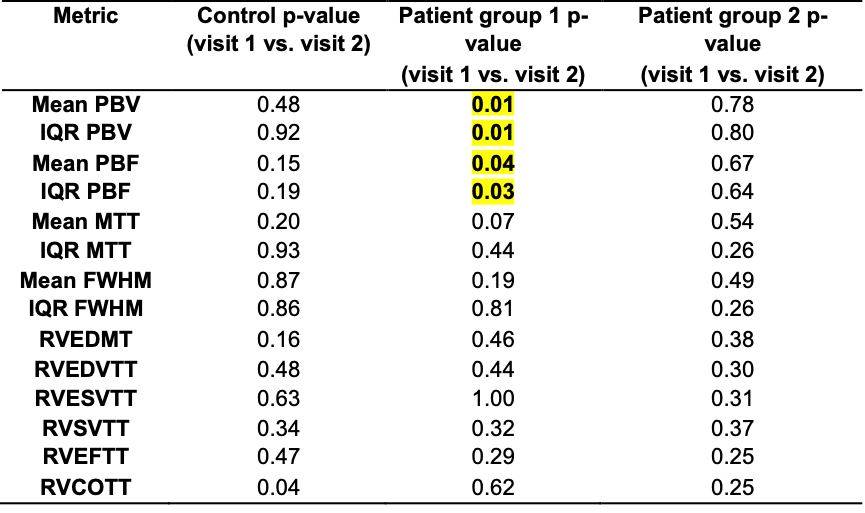
Whole lung mean rPBV was significantly different between healthy controls and patient group 2 at visit 1 (p=0.0499) and between control and patient groups 1 and 2 at visit 2 (p=0.0036 and p=0.0483 respectively) (Figure 1). Mean rPBF differentiated healthy controls from patient group 1 and 2 at both visit 1 (p=0.0192 and p=0.0098, respectively) and visit 2 (p=0.0055 and p=0.0199, respectively). IQR rPBF could only differentiate healthy controls from patient group 2 at visit 2 (p=0.0441). Whole lung mean rMTT differentiated healthy controls from both patient group 1 and 2 at visit 1 (p=0.0195 and p=0.0233, respectively) but only differentiated healthy controls and patient group 2 at visit 2 (p=0.0491) (Figure 2). Whole lung mean FWHM was significantly different between healthy controls and patient group 1 at visit 1 only (p=0.0233). IQR FWHM was significantly different between healthy controls and patient group 1 at both visit 1 and visit 2 (p=0.0170 and p=0.099, respectively), but not between healthy controls and patient group 2. ΔrPBV correlated significantly with ΔRVEDMT (r=0.415, p=0.039), as did ΔIQR rPBV (r=0.453, p=0.023). ΔIQR rPBF and ΔIQR rMTT also correlated with ΔRVEDMT (r=0.569, p=0.018 and r=-0.402, p=0.046, respectively), whilst ΔIQR rMTT also correlated with ΔRVSVTT (r=-0.431, p=0.032) (Figure 3). Patient group 1 showed statistically significant differences (visit 1 compared to visit 2) in mean rPBV and rPBF (p=0.0081 and p=0.0441 respectively) along with IQR rPBV and IQR rPBF (p=0.0127 and p=0.0304, respectively). Figure 4 provides example slices from a participant in each group of the lung perfusion metrics generated here.Discussion & Conclusions
Whole lung mean rPBV and rPBF could differentiate healthy controls from patients with PAH (group 1 and 2), as could whole lung mean rMTT. IQR rPBF could only differentiate healthy controls from patient group 2. Whole lung mean FWHM and IQR FWHM could differentiate healthy controls from patient group 1. Interestingly lung perfusion metrics could also detect change between visit 1 and visit 2 in patient group 1, whereas established right ventricular cardiac MRI measures could not. Based on the data analysed here it suggests that analysis of lung perfusion may be more sensitive to change than the RV cardiac metrics used here. Future work will focus on assessing the repeatability of these metrics and comparing the change in measurements made on the same day to longitudinal change.Acknowledgements
NIHR (RP-R3-12-027), MRC (MR/M008894/1) and GlaxoSmithKline (PJCH: BIDS3000032592, RESPIRE study: COL100041816) for fundingReferences
1. C. S. Johns, et al., Radiology, 2018, 290(1), 61-68
2. J. Zheng, et al., Magnetic Resonance in Medicine, 2002, 47(3), 433-438
3. S. Rajaram, et al., Thorax, 2013, 68(7), 677-678
4. Y.-R. Lin, et al., Journal of Cardiovascular Magnetic Resonance, 2013, 15:21
5. A. J. Swift, et al., Pulmonary circulation, 2014, 4(1), 61-70
6. ClinicalTrials.gov, https://clinicaltrials.gov/ct2/show/NCT03841344
7. F. R. Korosec, et al., Magnetic Resonance in Medicine, 1996, 36(3), 345-351
8. A. J. Swift, et al., Am J Respir Crit Care Med, 2017, 196(2), 228-239
9. B. B. Avants, et al., NeuroImage, 2011, 54(3), 2033-2044
10. P. A. Yushkevich, et al., NeuroImage, 2006, 31(3), 1116-1128
Figures