1208
Tissue characterization by mapping and strain cardiac magnetic resonance imaging to evaluate myocardial inflammation in fulminant myocarditis
Hui Zhu1, Haojie Li1, Zhaoxia Yang1, and Liming Xia1
1Radiology, Tongji Hospital, Tongji Medical College, Huazhong University of Science and Technology, Wuhan, China
1Radiology, Tongji Hospital, Tongji Medical College, Huazhong University of Science and Technology, Wuhan, China
Synopsis
Fulminant myocarditis show significant different LGE patterns, increased edema and decreased strain measurements compared with non-fulminant acute myocarditis and global peak circumferential and radial strain were closely correlated with quantitative parameters of myocardial edema.
Background:
Fulminant myocarditis is a rare form of acute myocarditis characterized by severe hemodynamic compromise requiring inotropes and/or timely mechanical circulatory support.1 To date, however there are only few reports with relative small sample focusing on the traditional Cardiac MR imaging characteristics in fulminant myocarditis.2 Furthermore, the clinical value of novel mapping techniques and strain measures to assess myocardial inflammation has not been fully explored. Therefore, the aim of this study was to evaluate whether mapping and strain cardiac MRI have the ability to assess myocardial inflammation in fulminant myocarditis, and to which degree the strain metrics correlate with quantitative parameters of myocardial inflammation.Methods:
Fifty-eight patients (29 patients with fulminant myocarditis, mean age ± standard deviation, 37 years ± 16 [range:15–72years]; 29 patients with non-fulminant acute myocarditis, mean age, 29 years ± 14 [range:14–62years]) with clinical suspected myocarditis were prospectively recruited. All subjects underwent cardiac MRI at 3T(MAGNETOM Skyra,Siemens Healthcare,Erlangen,Germany) , and the scanning sequences included cine, black blood T2 weighted imaging, T1 mapping, T2 mapping and late gadolinium enhancement (LGE). Myocardial strain analysis was applied on standard cine images of long and short axis views.Results:
The myocardial edema rate(2.6±0.7 vs 1.6±0.2, P < 0.001)and LGE mass (16.5 [11.7,41.7] vs 6.9 [2.2,15.8], p < 0.001)were significantly increased in FM patients when compared to the NFAM group. LGE in FM group predominantly located in septal wall (Fig.1), and 38% of the patients showed a diffuse LGE pattern. Native T1, extracellular volume(ECV) and T2 values in FM group were significantly elevated than those with NFAM,while global peak radial(RS), circumferential(CS) and longitudinal strain(LS)values were significantly reduced(all p<0.001). CS showed the strongest correlations with ECV(r=0.724, p<0.001) (Fig. 2).Discussion and conclusions:
In this study, the preliminary data from our study demonstrate FM patients showed different LGE patterns, increased edema(high T1/T2 value) and decreased strain measurements compared with NFAM. These imaging findings were associated with severe clinical manifestations in FM. Interestingly, global CS was the only strain indices that showed a significant correlation with all quantitative Cardiac MRI parameters of myocardial edema in FM patients. Especially, the strongest correlation was found with ECV. The possible reasons may be explained by the extensive inflammatory myocardial injuries in FM, resulting in a greater expansion of myocardial ECV. Further multi-center studies are needed to assess the prognosis value of this imaging findings in fulminant myocarditis.Acknowledgements
No acknowledgement found.References
1. Gupta S, Markham DW, Drazner MH et al. Fulminant myocarditis. Nat Clin Pract Cardiovasc Med 2008;5:693-706
2. Mavrogeni S, Bratis K, Terrovitis J et al. Fulminant myocarditis. Can cardiac magnetic resonance predict evolution to heart failure? INT J CARDIOL 2012;159:e37-e38
Figures
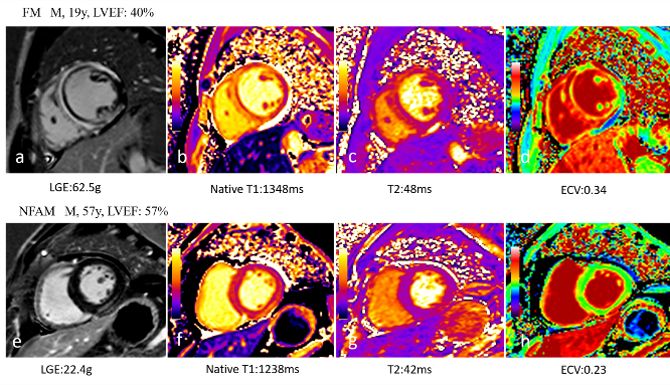
Figure 1: Example of
typical cardiac MRI findings in a 19-year-old male FM patient with septal LGE
and a 57-year-old male NFAM patient with inferolateral
LGE. The LGE mass, global native T1, T2 and ECV
were higher in FM patient (first row) compared with NFAM (second row).
Note.-FM= fulminant myocarditis, NFAM= non-fulminant acute myocarditis
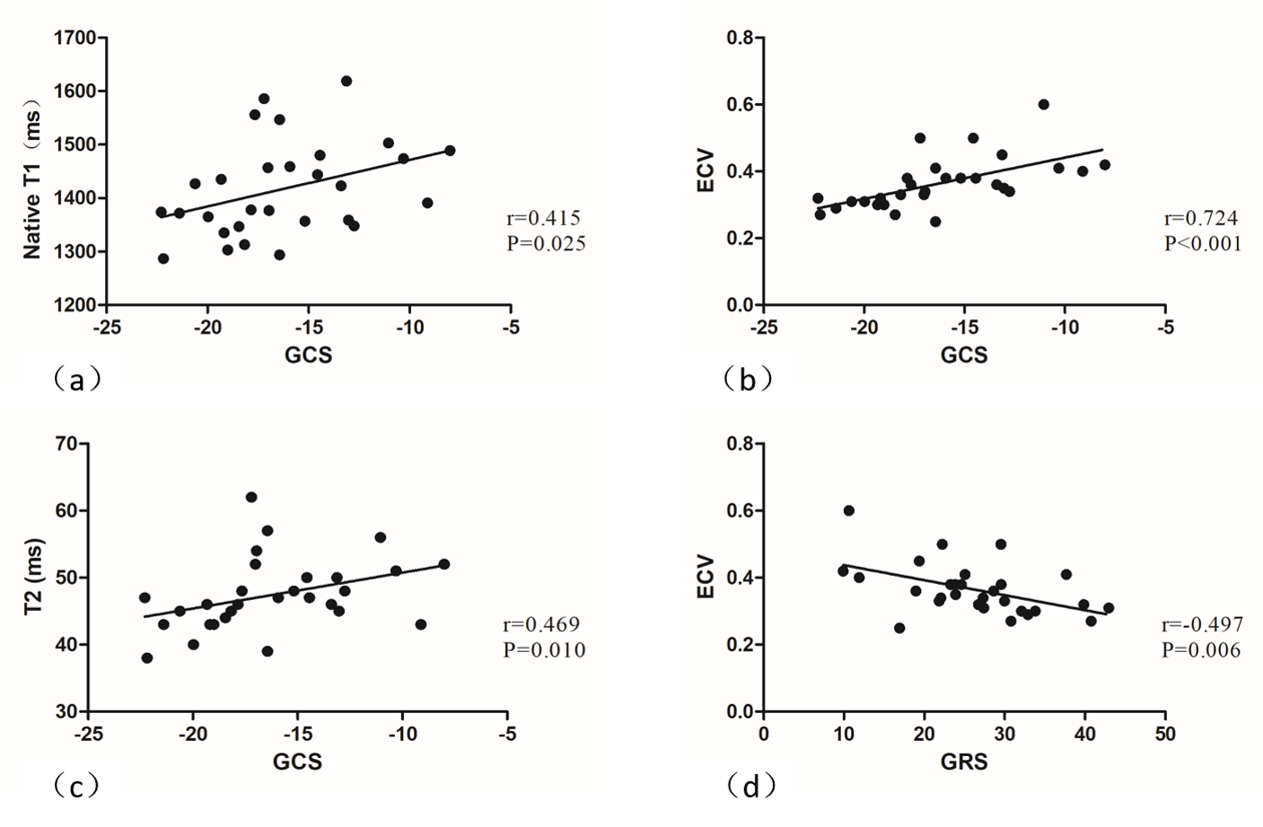
Figure 2: Scatter
plots displaying correlations between global circumferential (GCS) and radial strain(GRS)
and native T1 (a),T2 (c) and extracellular volume
fraction(ECV) (b, d).