1207
ECG-free, free-breathing myocardial T1/ECV mapping at high heart rates using MR Multitasking: A feasibility study in a HFpEF rat model1Department of Bioengineering, UCLA, Los Angeles, CA, United States, 2Biomedical Imaging Research Institute, Cedars-Sinai Medical Center, Los Angeles, CA, United States, 3Smidt Heart Institute, Cedars-Sinai Medical Center, Los Angeles, CA, United States, 4Department of Cardiology, Xin-Hua Hospital Affiliated to Shanghai Jiao Tong University School of Medicine, Shanghai, China, 5Department of Medicine, UCLA, Los Angeles, CA, United States
Synopsis
CMR T1 and ECV quantification can be used to characterize focal or diffuse myocardial fibrosis. However, it is technically challenging to acquire high-quality maps in small animals for preclinical research because of high heart rates and high respiration rates. In this study, we developed an ECG-free, free-breathing MR Multitasking T1 mapping method on a 9.4T small animal MRI system. The feasibility of characterizing diffuse myocardial fibrosis was tested in a HFpEF rat model. Elevated ECV found in the HFpEF group is consistent with previous human studies and shows strong correlation with the histological data.
Introduction
Cardiac magnetic resonance (CMR) T1 mapping is a powerful diagnostic modality for various abnormalities of the myocardium. Combined with gadolinium contrast enhancement, T1 mapping allows extracellular volume fraction (ECV) quantification, which can be used to characterize focal or diffuse myocardial fibrosis1-3. However, it is technically challenging to acquire high-quality T1 and ECV maps in small animals for preclinical research because of high heart rates (usually faster than 300 bpm) and high respiration rates (around 60 cpm).Several studies have been done to improve CMR T1 mapping4 and ECV measurement5 in small animals. In previous works, dual cardiac/respiratory gating or ECG-triggering only was used to reduce motion artifact. In this study, we developed an ECG-free, free-breathing MR Multitasking6,7 T1 mapping method on a 9.4T small animal MRI system. The feasibility of characterizing diffuse myocardial fibrosis was tested and histologically validated in a rat heart failure model with preserved ejection fraction (HFpEF).
Methods
Rat modelThe Dahl salt-sensitive (DSS) rat model was used8. In this model, male DSS rats (Charles River Laboratories, MA) were normally fed (0.3% NaCl) until the age of 7 weeks. Rats were then randomly assigned to a high-salt diet group (8% NaCl) to induce HFpEF or a low-salt diet group (0.3% NaCl) to serve as controls, until the age of 14 weeks. Imaging experiments and all measurements were done between the age of 14 and 15 weeks.
Imaging protocol
Nine control rats (control group, n=9) and nine high-salt fed rats diagnosed with HFpEF (HFpEF group, n=9) were imaged. All MRI data were acquired on a 9.4 T Bruker BioSpec preclinical system with a single-channel volume coil.
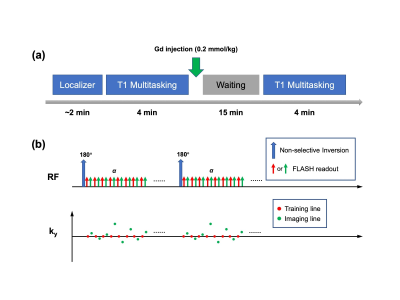
Fig. 1(a) shows the imaging workflow of the study. The sequence design of Multitasking T1 mapping is illustrated in Fig. 1(b), with the following imaging parameters: matrix size=128x128, FOV=40x40mm2, voxel size=0.31x0.31x1.5mm, flip angle=5°, TR/TE=7.0/2.4ms, recovery period (time between adjacent IR pulses) = 2.9 s. In each Multitasking T1 mapping module, 85 IR preparation pulses were applied, resulting in a scan time of 4 min 10 s. The total exam time for one rat was around 25 minutes. After the scan, hematocrit (HCT) was measured for ECV calculation.
Image reconstruction and analysis
The basic steps of Multitasking image reconstruction were as follows7: First, real-time temporal basis and corresponding spatial coefficient maps were reconstructed from the training data and imaging data respectively; these images were used for cardiac and respiratory binning. Then, low-rank tensor reconstruction was performed with a tensor subspace constraint estimated from a dictionary of Bloch-simulated T1 recovery evolutions, 10 cardiac bins and 5 respiratory bins. A major novelty for this work is that pre- and post-Gd data were reconstructed jointly by modeling the paired T1 recovery evolutions, ensuring co-registration and improving SNR. Finally, pixel-wise T1 maps were fitted at the end-expiration and diastolic phase with a joint pre- and post-Gd T1 recovery model.
ECV values were calculated as (1-HCT) times the ratio of ΔR1 in the septal myocardium to ΔR1 in the aorta. The signal from aorta rather than the LV was used for blood ΔR1, to avoid the signal loss resulting from LV inflow in this single slice setup. Both image reconstruction and analysis were done in MATLAB.
Histological analysis
Masson's trichrome stain was used to measure the extent of fibrosis. The hearts from five rats (n=5) of the control group and five rats (n=5) of the HFpEF group were sectioned. Fractional myocardial fibrosis (blue-gray pixels divided by total pixels) was measured with ImageJ. A quantitative fibrosis percentage was calculated for each rat using an average of five different sections.
Results
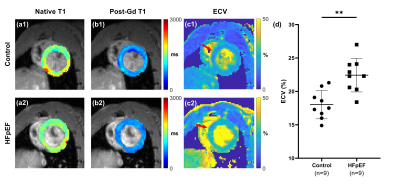
Fig. 2(a-c) shows representative T1 and ECV maps from the control group and HFpEF group. Welch’s t-test showed that ECV was significantly higher in the HFpEF group (22.4%±2.5%) compared with those in the control group (18.0%±2.1%), p < 0.005, as displayed in Fig. 2(d).Fig. 3(a-b) shows representative Masson trichrome-stained sections of the control and HFpEF rats. The myocardial fibrosis can be clearly seen in Fig. 3(b). Fig. 3(c) shows the relationship between ECV value and the extent of fibrosis, in which a strong correlation can be found (r2 = 0.73, p = 0.0017).
Discussion
In this study, Multitasking ECV measurements were higher in the HFpEF group and strongly correlated with histological fibrosis measurements. Future work will include evaluating the use of more cardiac bins; 10 bins here correspond to a cardiac temporal resolution of 20 ms for a heart rate of 300 bpm. For higher heart rates, such as those in mice (~450 bpm), more cardiac bins may be required. For use in other disease models featuring focal fibrosis, future work may include expanded spatial coverage with 3D volumetric imaging and sequence improvements to address potential B1 and B0 issues affecting T1 homogeneity in the inferior and lateral walls, as visible in Fig. 2.Conclusion
ECG-free, free-breathing CMR Multitasking T1/ECV mapping produces T1 and ECV maps in a high heart rate rat model. Elevated ECV found in the HFpEF group is consistent with previous human studies and shows strong correlation with the histological data. This technique can be a powerful tool for myocardial tissue characterization in small animal models.Acknowledgements
No acknowledgement found.References
- Moon JC, Messroghli DR, Kellman P, Piechnik SK, Robson MD, Ugander M, Gatehouse PD, Arai AE, Friedrich MG, Neubauer S, Schulz-Menger J. Myocardial T1 mapping and extracellular volume quantification: A Society for Cardiovascular Magnetic Resonance (SCMR) and CMR Working Group of the European Society of Cardiology consensus statement. Journal of Cardiovascular Magnetic Resonance. 2013 Dec;15(1):92.
- Haaf P, Garg P, Messroghli DR, Broadbent DA, Greenwood JP, Plein S. Cardiac T1 mapping and extracellular volume (ECV) in clinical practice: a comprehensive review. Journal of Cardiovascular Magnetic Resonance. 2017 Jan;18(1):89.
- Su MY, Lin LY, Tseng YH, Chang CC, Wu CK, Lin JL, Tseng WY. CMR-verified diffuse myocardial fibrosis is associated with diastolic dysfunction in HFpEF. JACC: Cardiovascular Imaging. 2014 Oct 1;7(10):991-7.
- Zhang H, Ye Q, Zheng J, Schelbert EB, Hitchens TK, Ho C. Improve myocardial T1 measurement in rats with a new regression model: application to myocardial infarction and beyond. Magnetic resonance in medicine. 2014 Sep;72(3):737-48.
- Messroghli DR, Nordmeyer S, Buehrer M, Kozerke S, Dietrich T, Kaschina E, Becher PM, Hucko T, Berger F, Klein C, Kuehne T. Small animal Look-Locker Inversion Recovery (SALLI) for simultaneous generation of cardiac T1 maps and cine and inversion recovery–prepared images at high heart rates: initial experience. Radiology. 2011 Oct;261(1):258-65.
- Christodoulou AG, Shaw JL, Nguyen C, Yang Q, Xie Y, Wang N, Li D. Magnetic resonance multitasking for motion-resolved quantitative cardiovascular imaging. Nature biomedical engineering. 2018 Apr;2(4):215.
- Shaw JL, Yang Q, Zhou Z, Deng Z, Nguyen C, Li D, Christodoulou AG. Free-breathing, non-ECG, continuous myocardial T1 mapping with cardiovascular magnetic resonance multitasking. Magnetic resonance in medicine. 2019 Apr;81(4):2450-63.
- Gallet R, de Couto G, Simsolo E, Valle J, Sun B, Liu W, Tseliou E, Zile MR, Marbán E. Cardiosphere-derived cells reverse heart failure with preserved ejection fraction in rats by decreasing fibrosis and inflammation. JACC: Basic to Translational Science. 2016 Mar 2;1(1-2):14-28.
Figures

Figure 1: Imaging workflow and sequence diagram.
(a) Imaging workflow: A self-gated localizer was used to select a mid-cavity short-axis slice of the left ventricle (LV). T1 Multitasking was performed before and 15 mins after Gd injection. The total exam time was around 25 mins.
(b) Sequence design: The T1 Multitasking sequence was performed using a continuous FLASH acquisition with repeated IR preparation. Odd-numbered readouts (imaging lines) followed randomized Gaussian-density sampling, and even-numbered readouts (training lines) collected the k-space center line.

Figure 2: Representative T1 and ECV maps (local) from control and HFpEF group.
(a-c) Representative T1 and ECV maps from control group (1) and HFpEF group (2). Myocardial R1 changes for the final ECV analysis were calculated within septal myocardium, as indicated by red arrows in (c).
(d) Calculated ECV values were significantly higher in HFpEF group (22.43%±2.51%), compared with the control group (18.02%±2.13%), p < 0.005.

Figure 3: Representative histological sections and ECV(%)-fibrosis(%) scatterplot.
(a/b) Representative Masson trichrome-stained sections of control group and HFpEF group.
(c) ECV values and the extent of fibrosis showed a strong correlation: r2 = 0.73, p = 0.0017.