1204
Measuring Cardiac Strain in Duchenne Muscular Dystrophy with a Convolutional Neural Net Tag Tracking Method1Radiology, Stanford, Palo Alto, CA, United States, 2Radiology, Veterans Administration Health Care System, Palo Alto, CA, United States, 3Mechanical Engineering, University of Central Florida, Orlando, FL, United States, 4Radiology, University of California Los Angeles, Los Angeles, CA, United States, 5Cardiovascular Institute, Stanford, Palo Alto, CA, United States, 6Center for Artificial Intelligence in Medicine & Imaging, Stanford, Palo Alto, CA, United States
Synopsis
The objective of this work was to demonstrate the feasibility of using a convolutional neural net (CNN) based tag tracking algorithm for deriving strain measurements in grid tagged cardiac MR images. The method was tested in 23 subjects. When compared to commercial software the CNN-based method produces similar measurements for peak Ecc and shows lower strain in boys with DMD compared to healthy subjects [CNN = -0.15±0.03 vs -0.21±0.03] and [Conventional = -0.16±0.03 vs -0.21 ± 0.02] (p < .001). Peak Ecc was not significantly different within cohorts when compared between methods [DMD cohort: p=0.32, Healthy cohort: p=0.99]
Introduction
Duchenne Muscular Dystrophy (DMD) is a fatal inherited genetic disorder, causing muscle degeneration that eventually leads to respiratory and/or heart failure [1]. Cardiomyopathy is a significant factor in the morbidity and mortality of the disease, and cardiac MRI (CMR) has become an important clinical tool used to follow the progression of the disease and plan appropriate treatment [2].Measures of cardiac function using left ventricular ejection fraction (LVEF) is a routine biomarker for staging and predicting cardiac outcomes in boys with DMD [3]. Cardiac strain has also been suggested to be a useful biomarker, and has been shown to provide earlier insight and better distinguish DMD hearts from healthy hearts compared to LVEF [4].
While strain measurements appear to be a useful biomarker for studying DMD cardiomyopathy, deriving strain from CMR tagged images is labor intensive . Tracking tag lines through the cardiac cycle measures the myocardial motion, from which strains can be calculated. Herein, we investigate the use of a recently validated CNN based tag tracking algorithm for following tag lines through the cardiac cycle, and compare it to a commercially available method in a cohort of boys with DMD and healthy volunteers. The CNN method requires little user input, and has been trained and validated on synthetic data with known truth. This has increased tag tracking accuracy and ease-of-use.
Methods
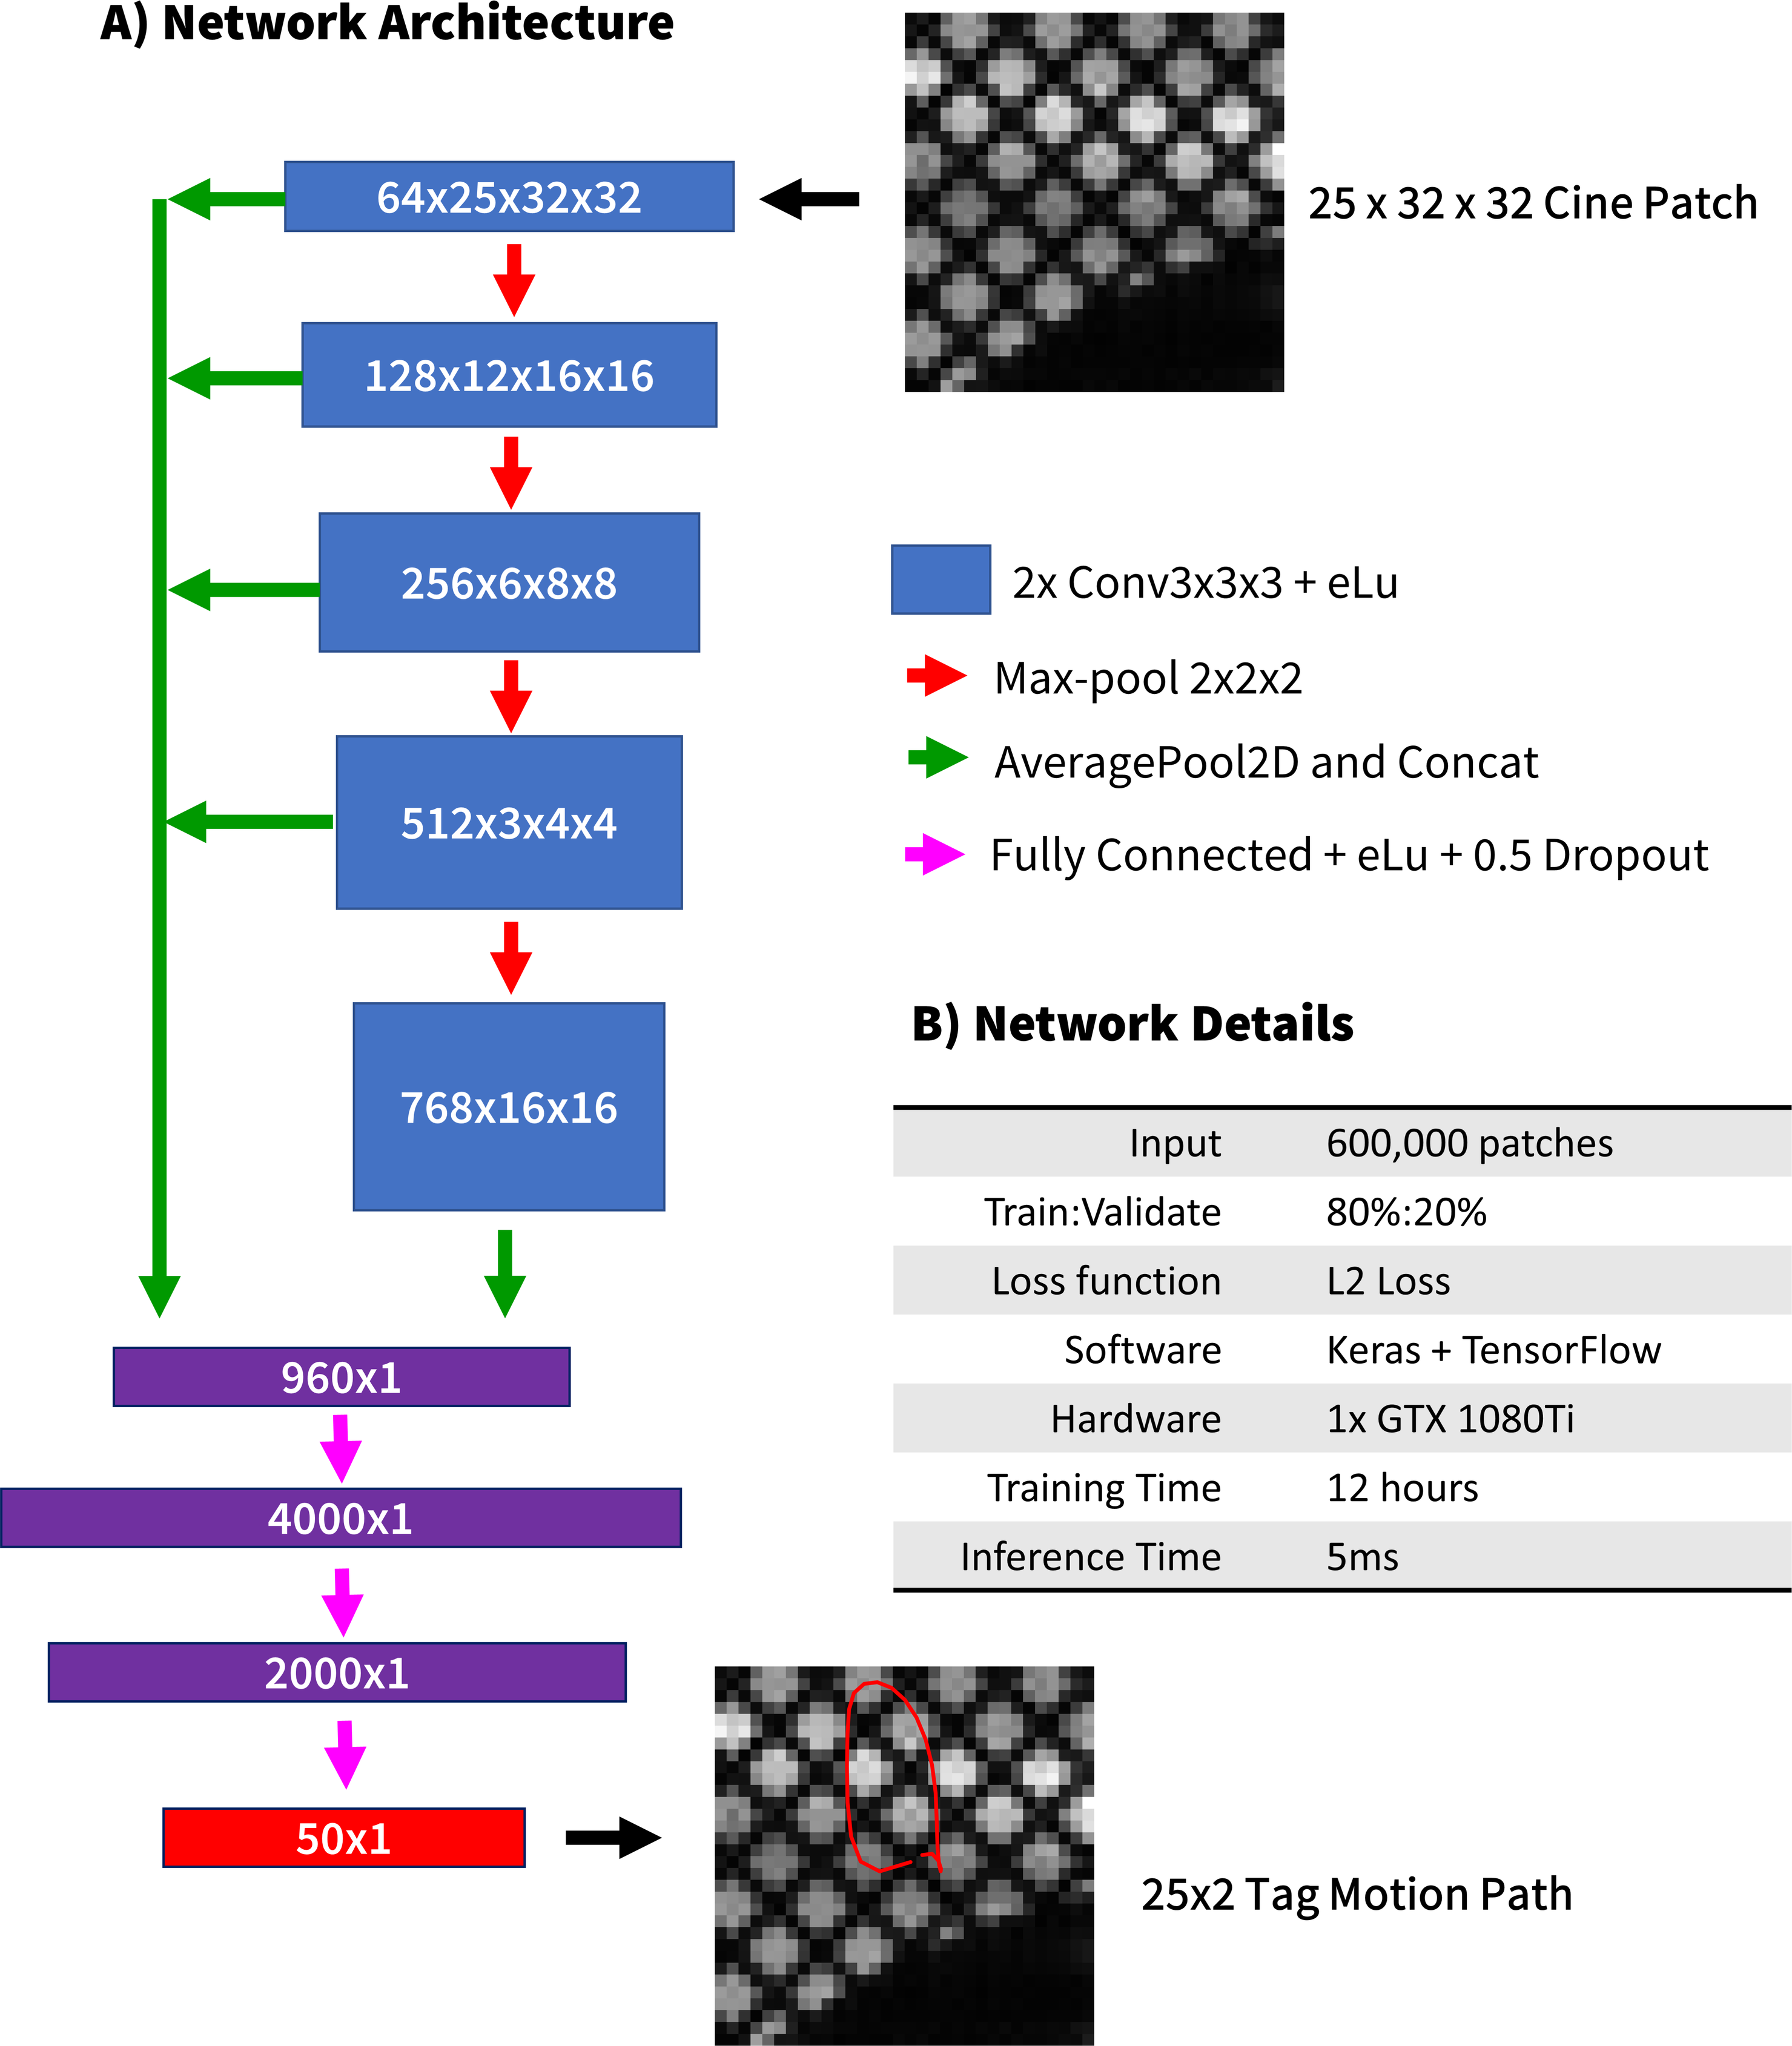
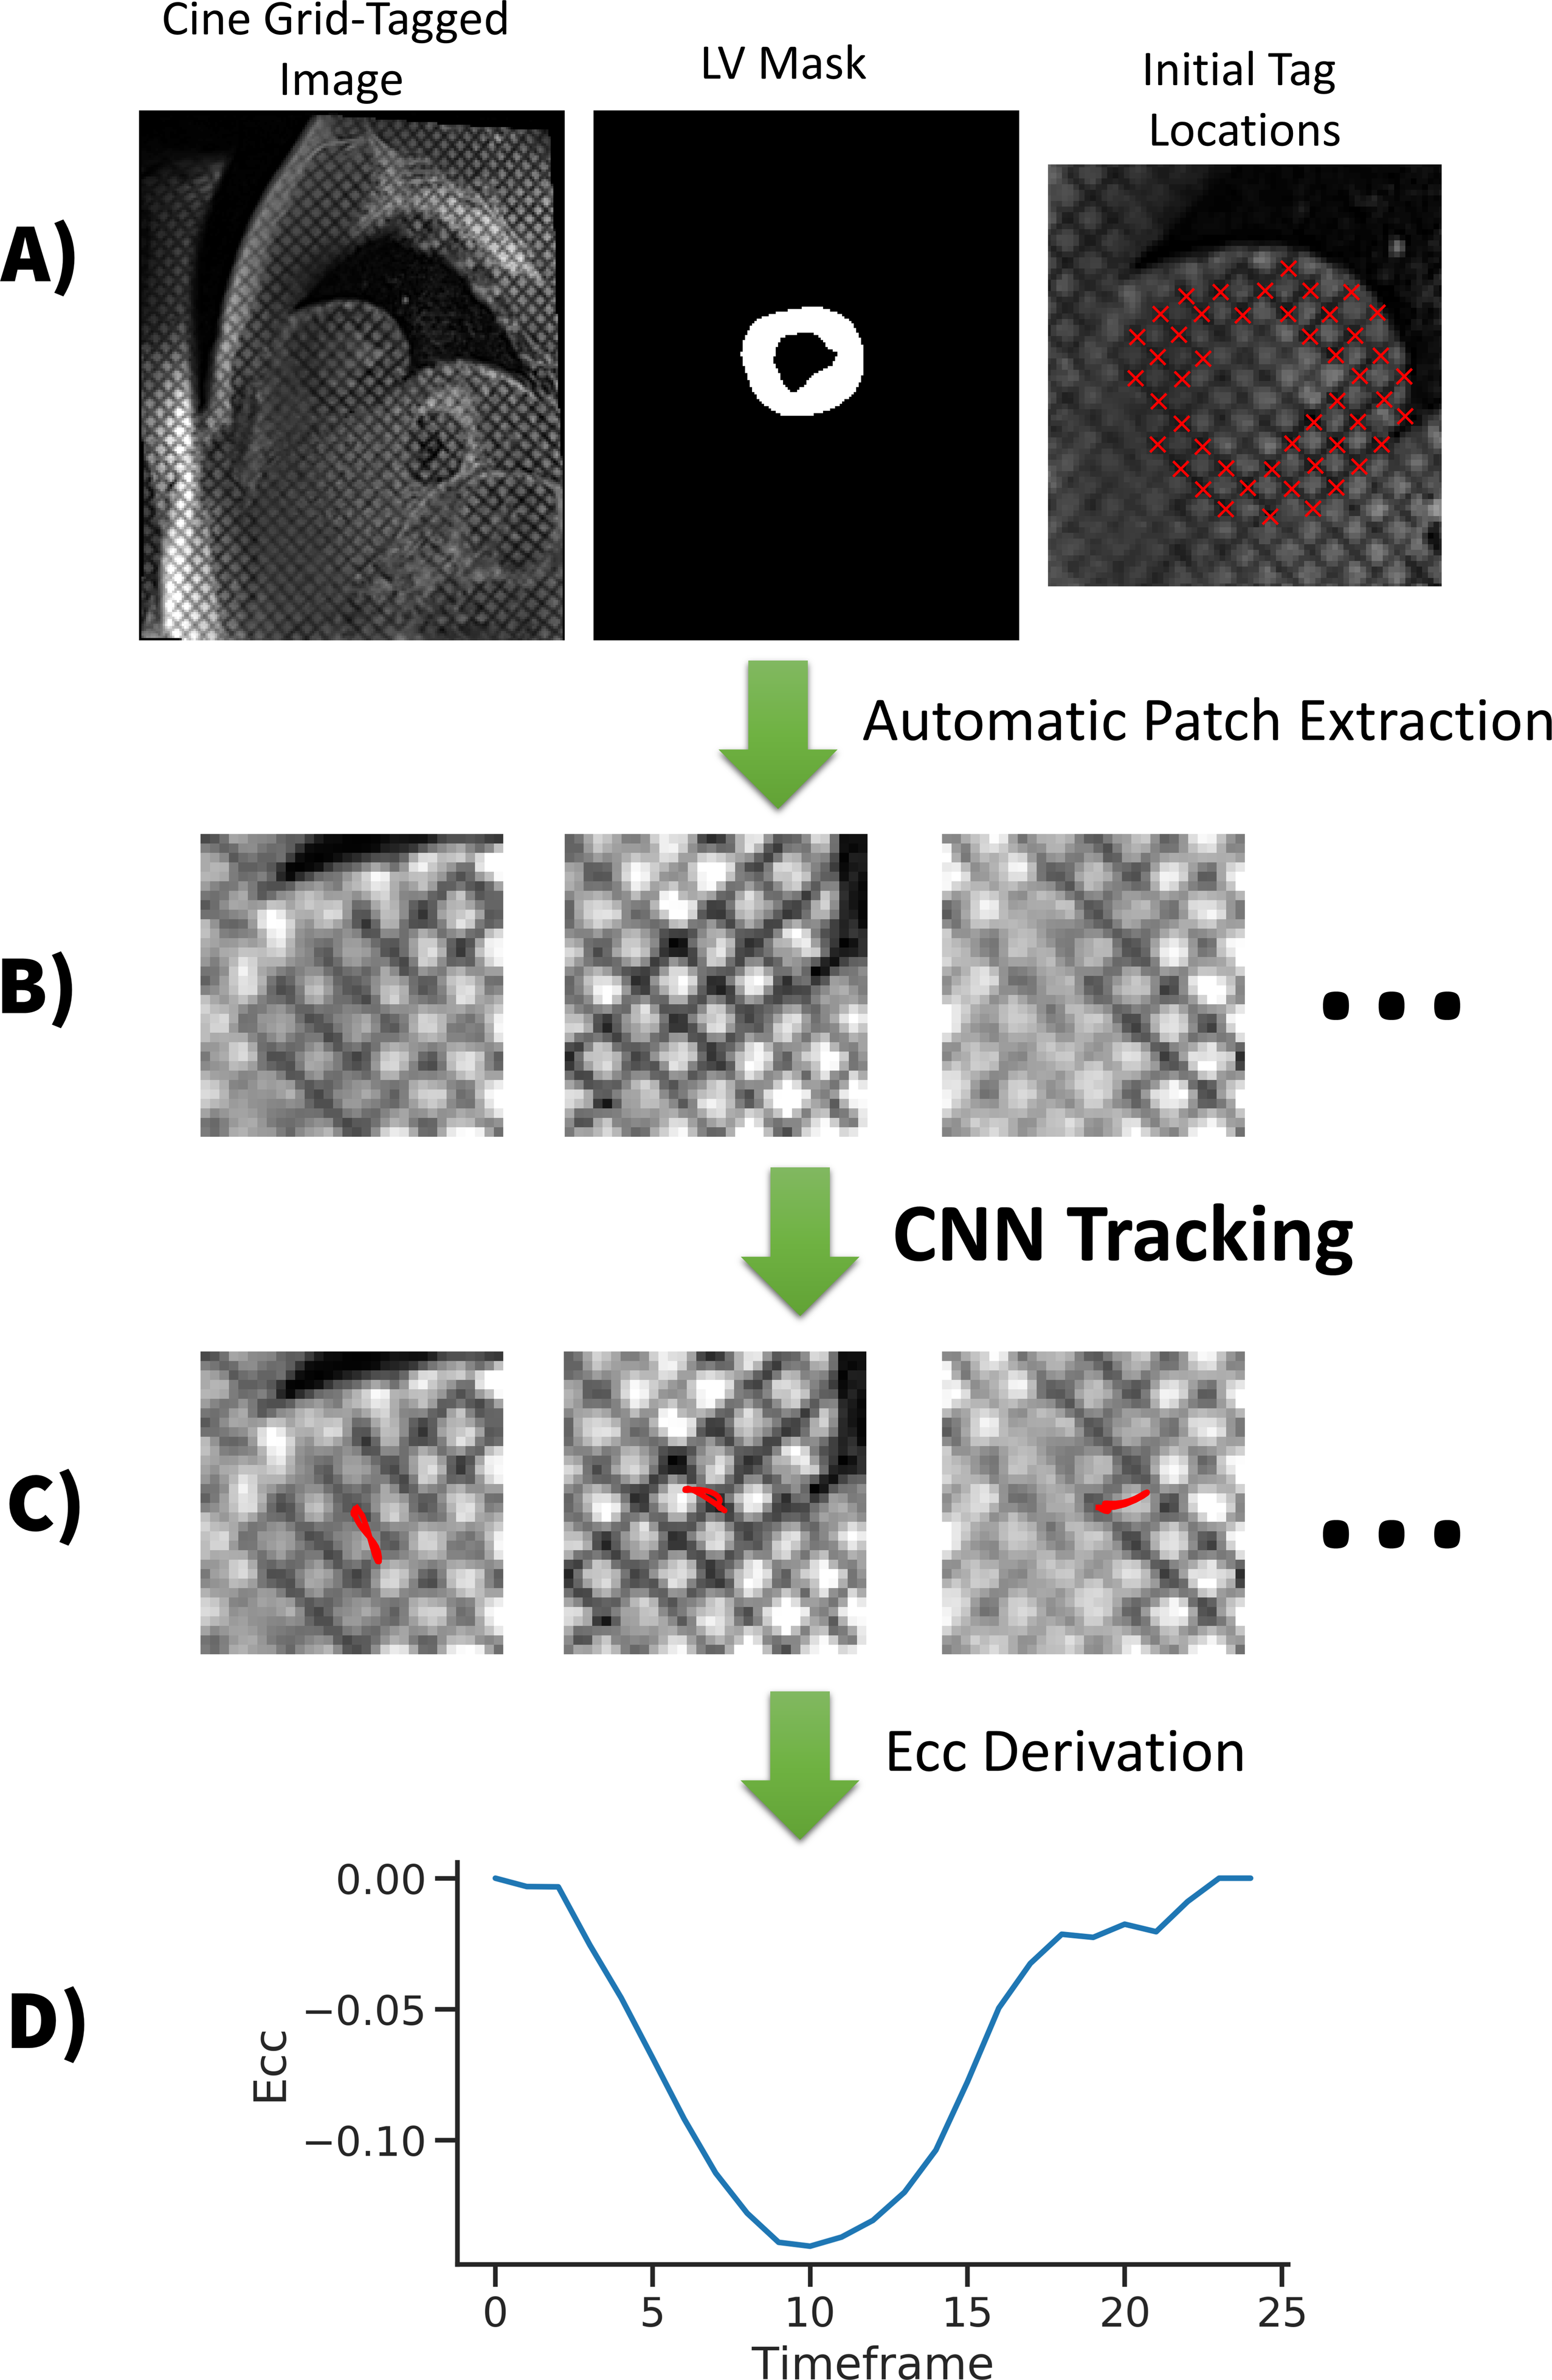
Figure 1 gives an overview of the CNN used for tag tracking. With a cine tagged cardiac image as input and initial tag locations in the myocardium at t=0, the method solves for tag motion paths throughout the cardiac cycle for each tag point. To improve computational efficiency the image is automatically cropped to a patch for each tag location to be tracked. The CNN was previously trained on synthetically generated data covering a wide range of possible motion paths, underlying object shapes, relaxations, noise, and tagging properties. The tag motion paths were then used to derive circumferential strains (Ecc) in a mask of the LV (Figure 2) [5]. The Ecc values measured with the CNN were compared to a traditional method from commercial software (Diagnosoft, Myocardial Solutions).14 patients (median age = 14Y) and 9 healthy controls (median age = 15Y) underwent a CMR exam including a mid-ventricular gridded tagged acquisition (spatial resolution=1.4x1.4x8mm, TE/TRes=2.12/24-48 ms, 25 retrospectively binned phases, grid tag spacing=8mm). Subjects were imaged at either 1.5T or 3T (Siemens Avanto or Skyra).
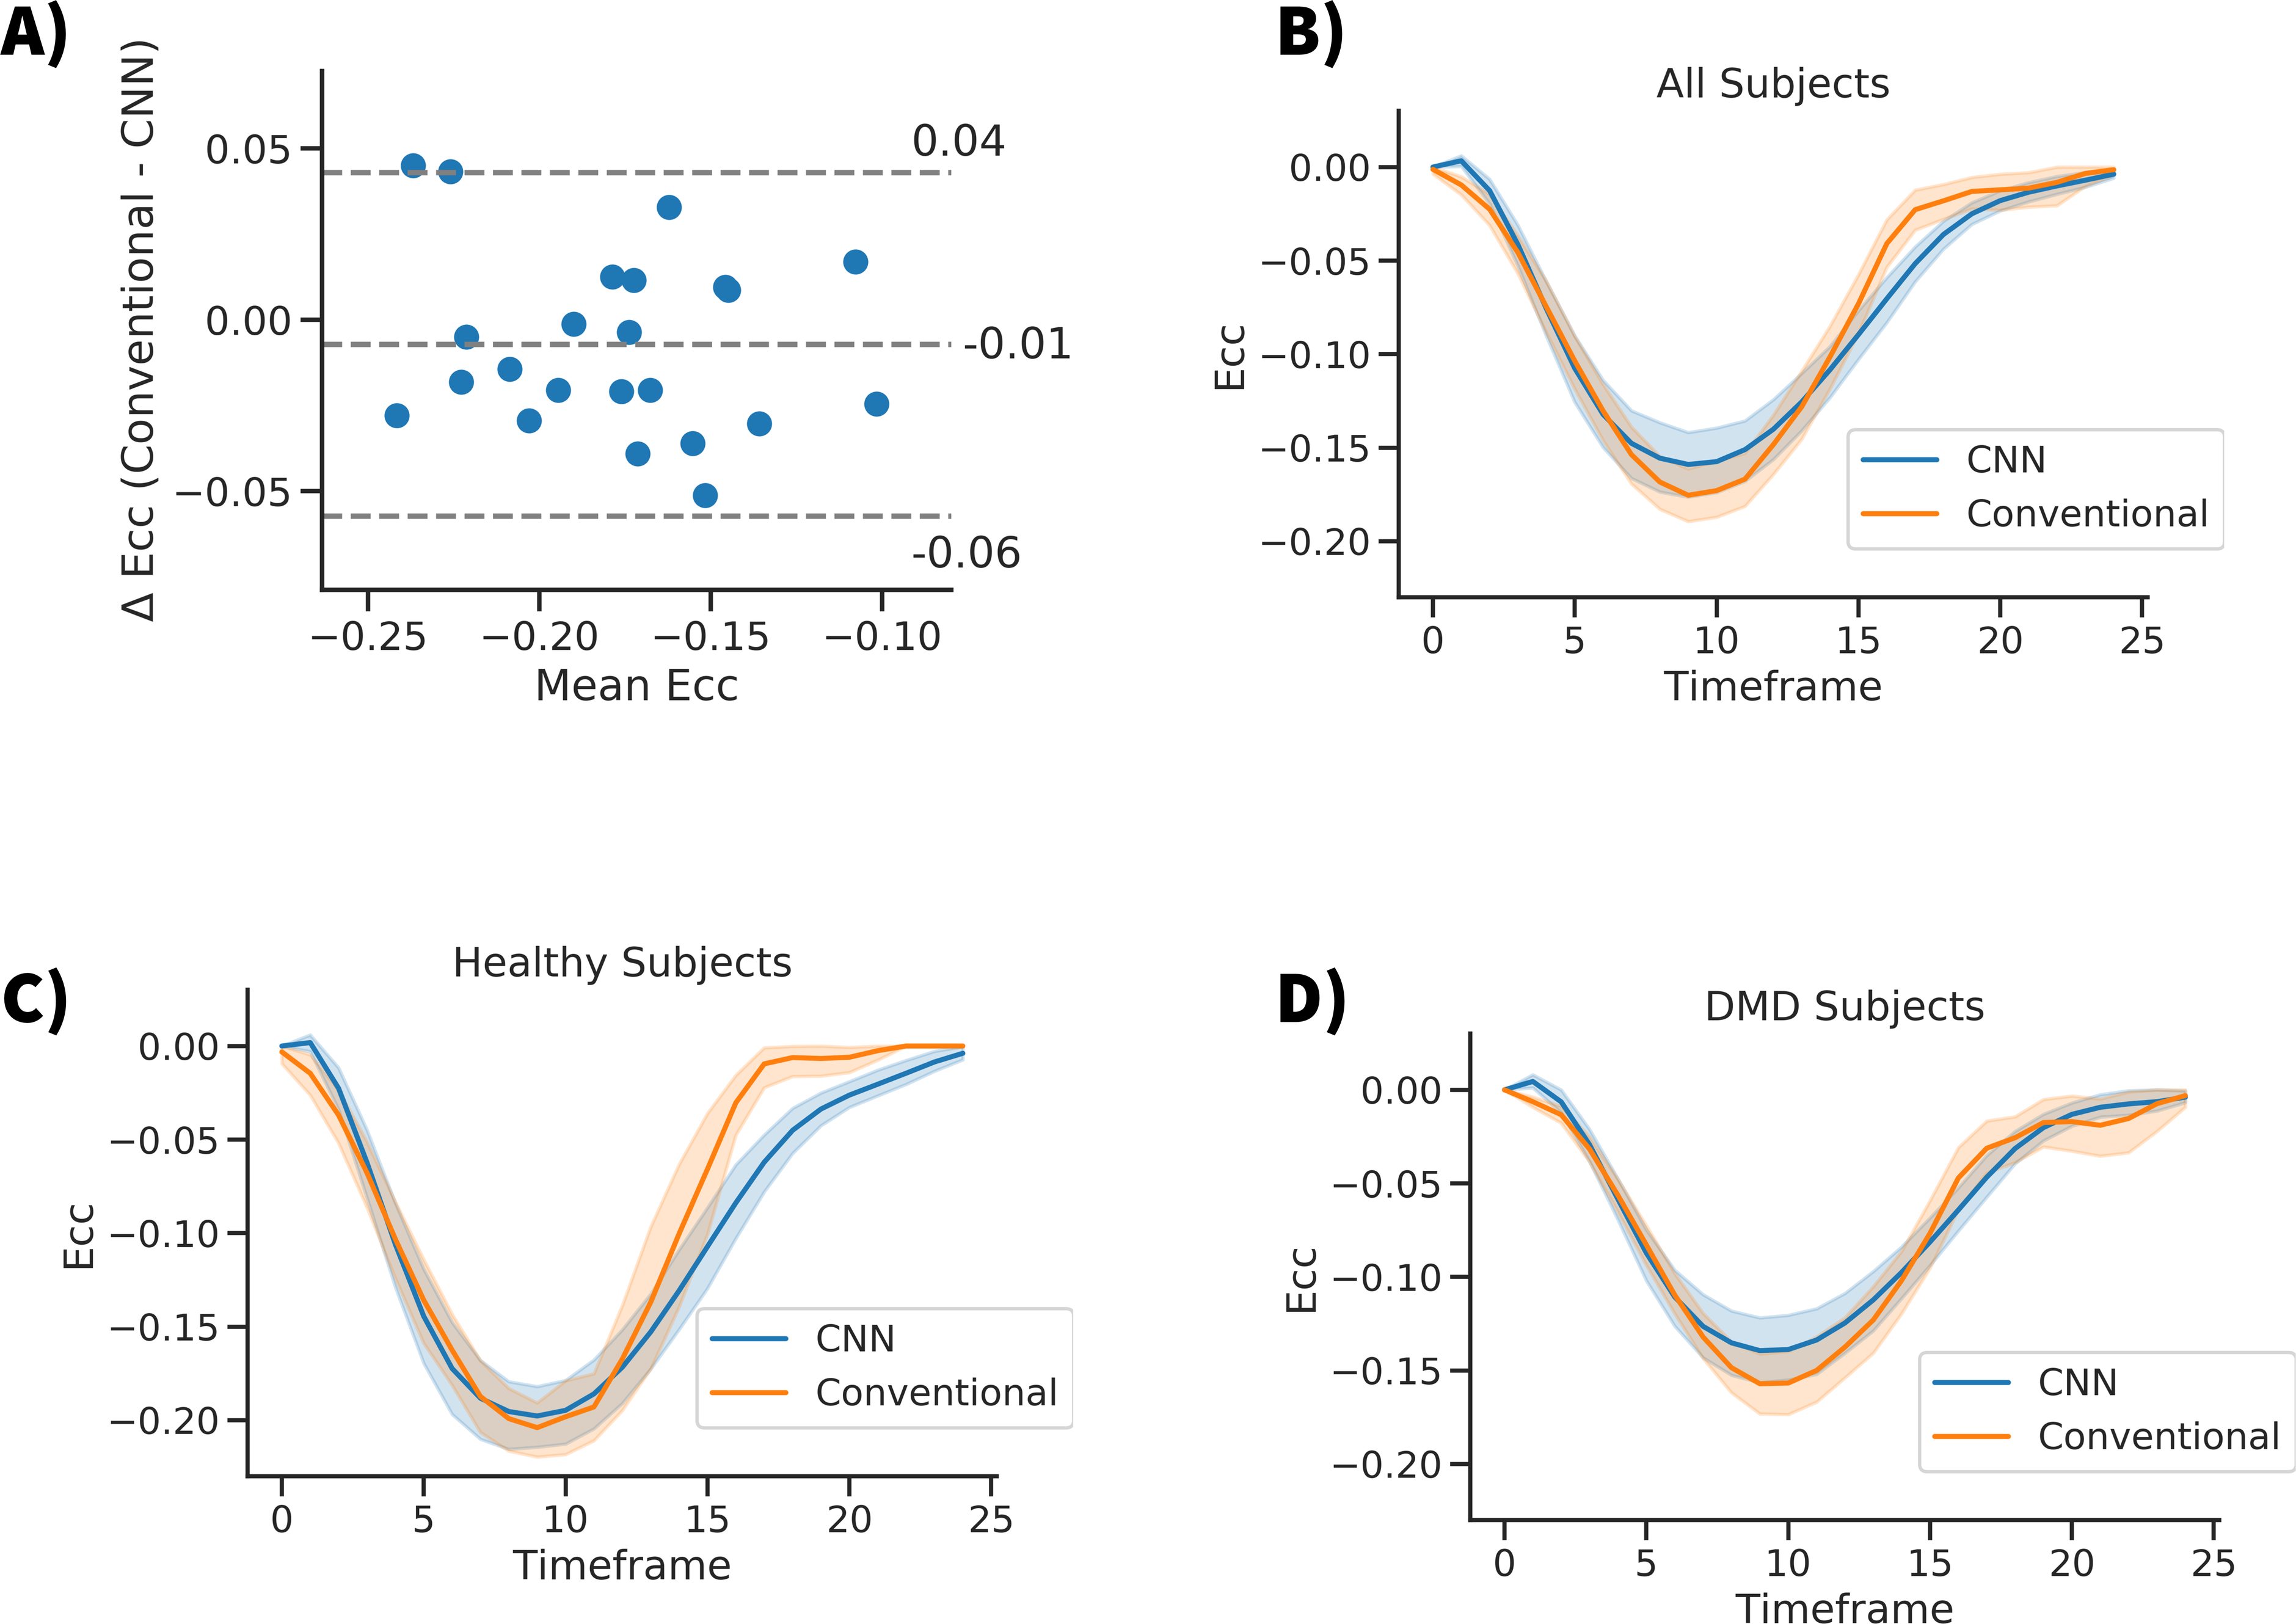
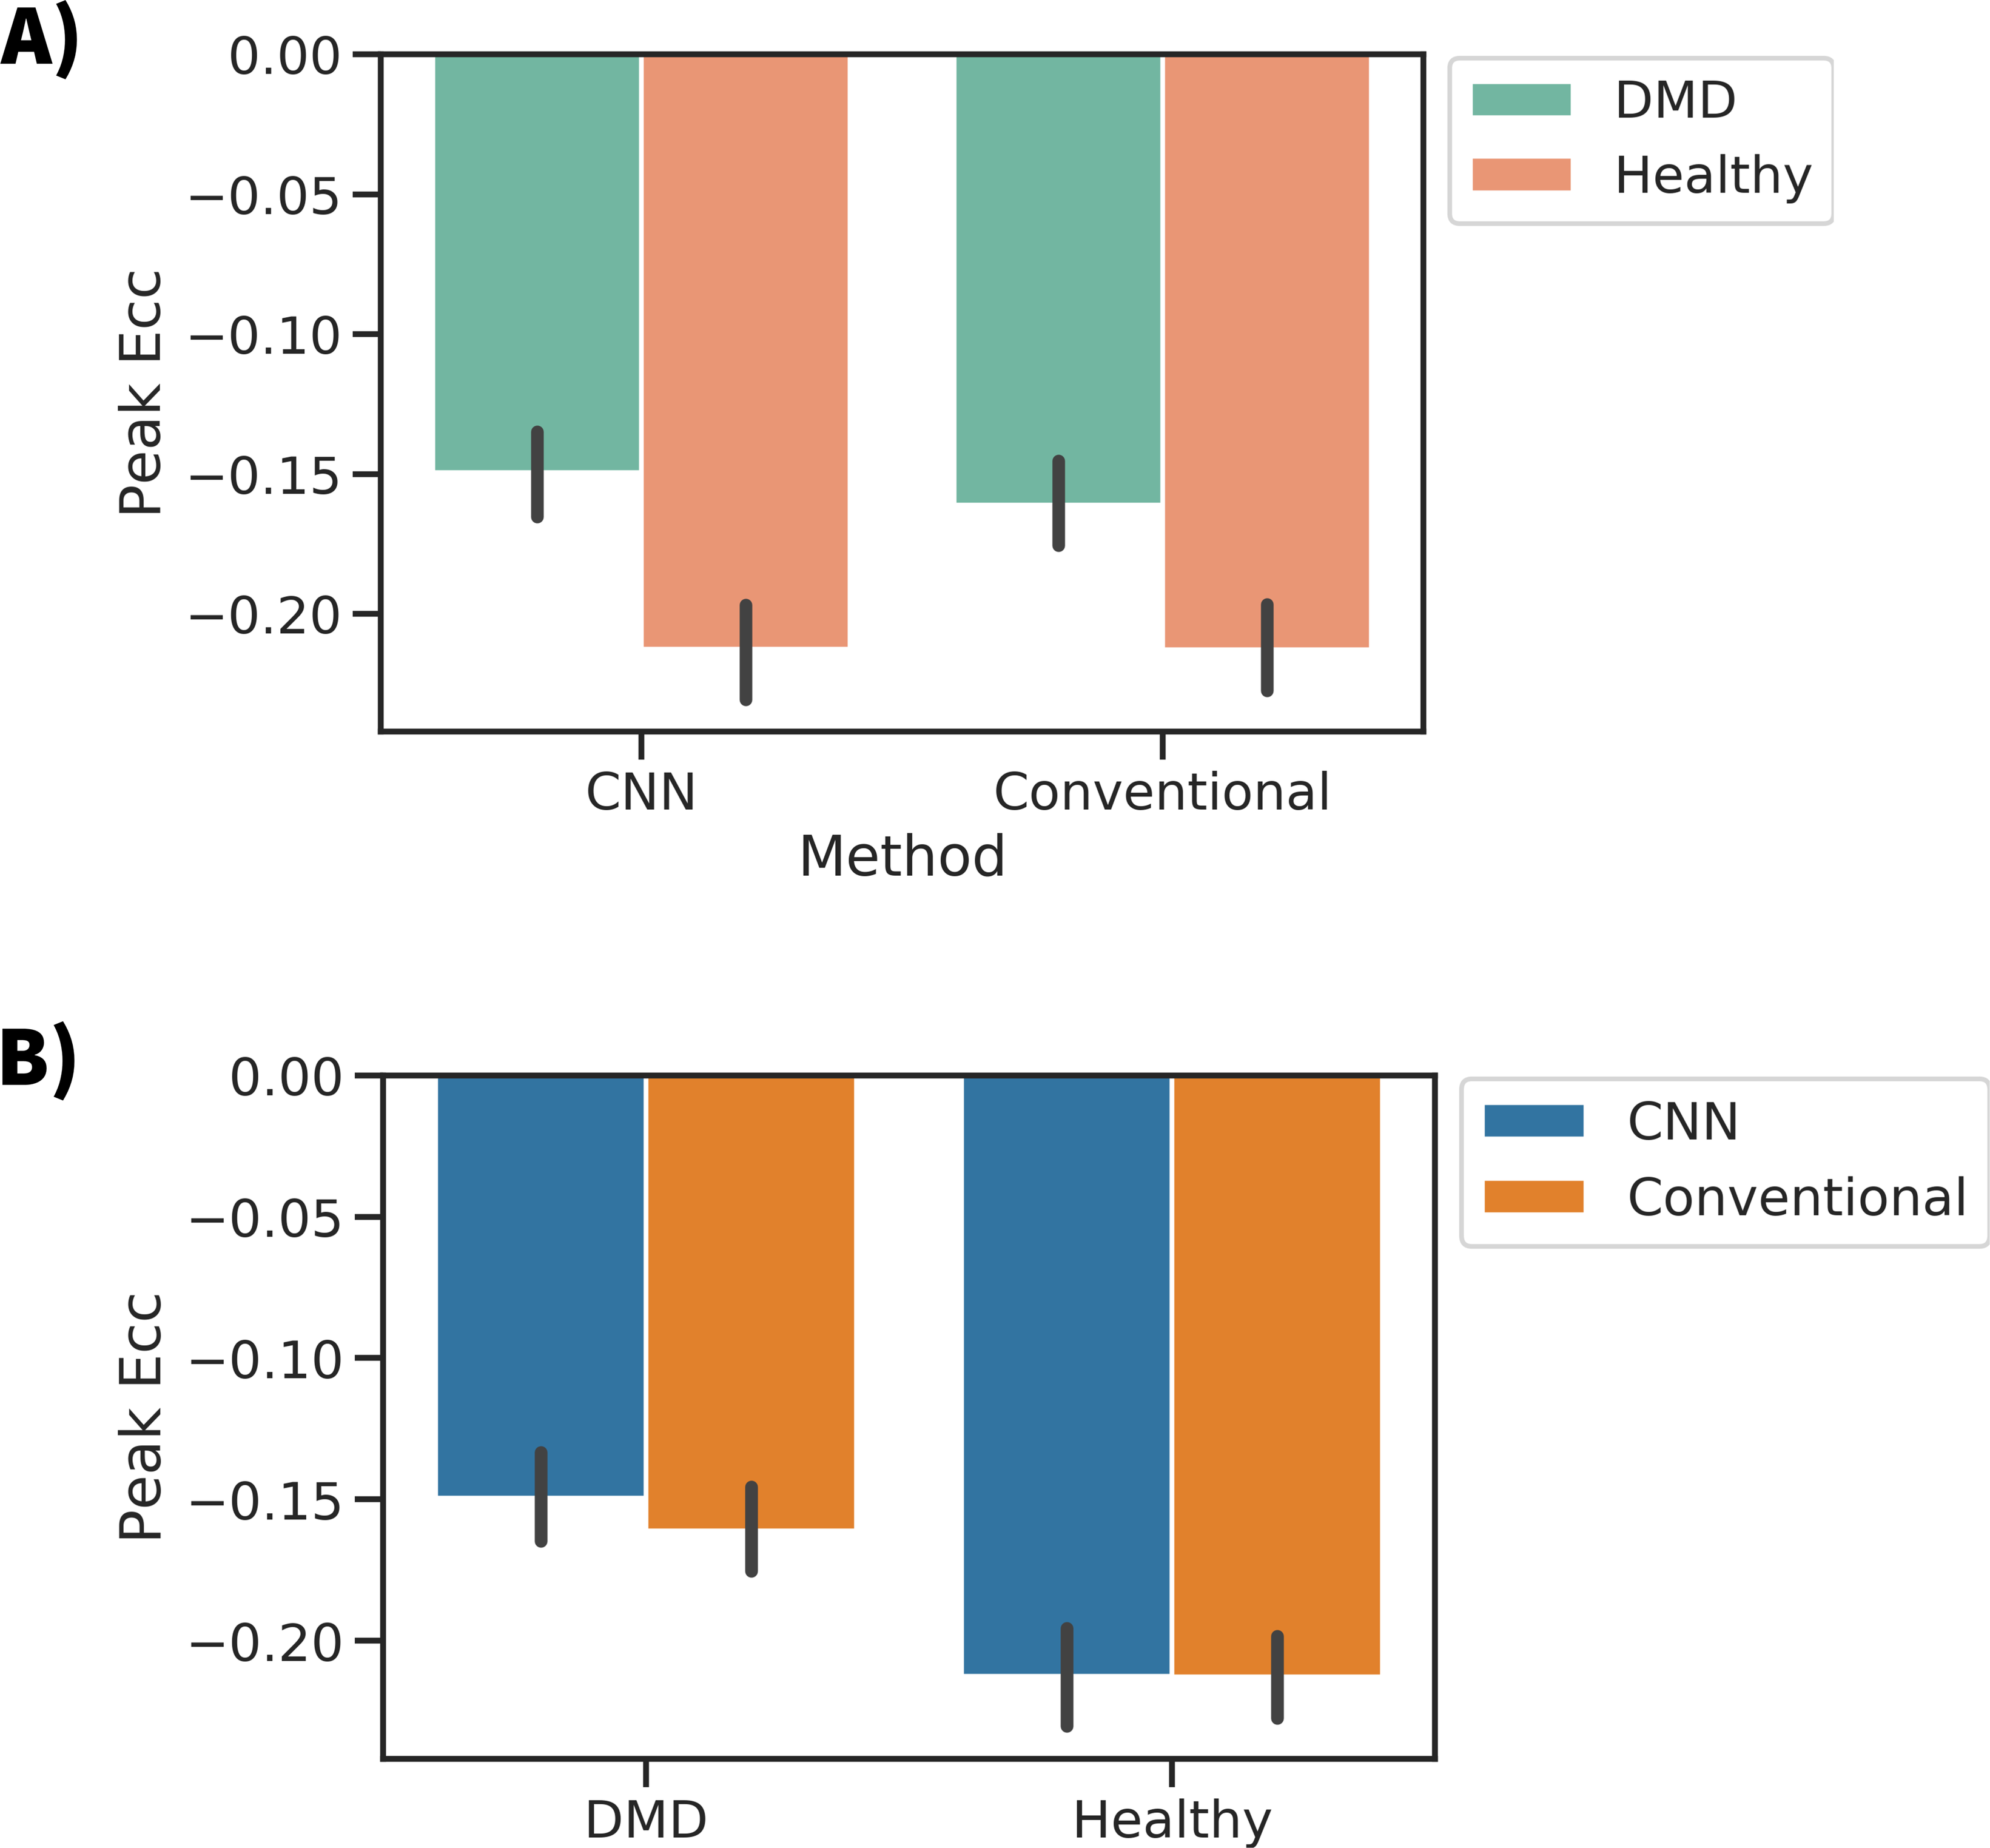
After computing Ecc curves for all subjects with both methods (CNN and conventional), we compared peak Ecc with Bland-Altman plots, and temporally resolved Ecc curves. Additionally, the peak midwall Ecc of both cohorts was measured and compared.
Results
Figure 3A shows a Bland-Altman plot comparing the peak Ecc values measured for both methods. A bias of -0.01 was seen with a -0.06 to 0.04 confidence interval (1.96 x SD). The difference between methods within cohorts was not significant [DMD cohort: p=0.32 t-test, Healthy cohort: p=0.99 t-test] (Fig 4b). Figures 3B-C show line plots of the time resolved Ecc averaged over a given subject population. Good agreement was seen between the curves, especially during the first ~⅔ of the cardiac cycle. Figure 4 shows the peak Ecc values measured in healthy subjects and boys with DMD with both methods. Both methods show a significant (p<0.001 t-test) difference in Ecc between the cohorts (Fig 4a).Discussion
This work shows the use of a CNN based tag tracking algorithm and its effectiveness in a population of boys with DMD and healthy controls. Good agreement between the strain measures was seen in the cohorts as a whole for peak Ecc and for temporally resolved Ecc, but larger differences were apparent late in the cardiac cycle. Careful inspection of subject-specific differences showed that improvements in the CNN may still be needed. These differences may be due to the tag tracking methodology, or other choices in the workflow such as different definitions of mid-wall, segmentation differences, or differences in the strain computation. Future work will compare multiple tag tracking workflows and carefully controlled comparisons of specific aspects of the workflow. Additionally we intend to automate the initial selection of tag points at t=0, as well as segmentation, to make the strain calculations fully automated.Acknowledgements
NIH K25 HL135408 to LEP
NIH R01 HL131823 to DBE
NIH R01 HL131975 to DBE
References
[1] McNally EM, Kaltman JR, Benson DW, Canter CE, Cripe LH, Duan D, Finder JD, Groh WJ, Hoffman EP and Judge DP. Contemporary cardiac issues in Duchenne muscular dystrophy. Circulation. 2015;131:1590-1598.
[2] Bushby K, Finkel R, Birnkrant DJ, Case LE, Clemens PR, Cripe L, Kaul A, Kinnett K, McDonald C and Pandya S. Diagnosis and management of Duchenne muscular dystrophy, part 1: diagnosis, and pharmacological and psychosocial management. The Lancet Neurology. 2010;9:77-93.
[3] Sadek, Abdelrahim Abdrabou et al. “Evaluation of cardiac functions in children with Duchenne Muscular Dystrophy: A prospective case-control study.” Electronic physician vol. 9,11 5732-5739. 25 Nov. 2017, doi:10.19082/5732
[4] Hor KN, Wansapura J, Markham LW, Mazur W, Cripe LH, Fleck R, Benson DW and Gottliebson WM. Circumferential strain analysis identifies strata of cardiomyopathy in Duchenne muscular dystrophy. Journal of the American College of Cardiology. 2009;53:1204-1210
[5] L.E. Perotti, P. Magrath, I.A. Verzhbinsky, E. Aliotta, K. Moulin, D.B. Ennis “Microstructurally Anchored Cardiac Kinematics by Combining In Vivo DENSE MRI and cDTI'' Functional Imaging and Modelling of the Heart, Toronto, Canada, June 2017
Figures