1203
Cardiac Rhythm Impacts Left Atrial Hemodynamics Measured with 4D Flow and Real Time PC MRI in Controls and Patients with Atrial Fibrillation1Radiology, Northwestern University, Chicago, IL, United States, 2Department of Medicine (Cardiovascular Division), Beth Israel Deaconess Medical Center & Harvard Medical School, Boston, MA, United States, 3Cardiac Surgery, Northwestern University, Chicago, IL, United States, 4Preventive Medicine, Northwestern University, Chicago, IL, United States, 5Biomedical Engineering, Northwestern University, Chicago, IL, United States
Synopsis
Stroke prevention is a major therapeutic goal in atrial fibrillation (AF) management. Flow quantification using MRI can provide information about left atrium hemodynamics implicated in stroke risk. This study evaluates the impact of cardiac arrhythmia on velocity and stasis, reflective of slow flow, measurements using both 4D-flow and real time phase contrast techniques in a cohort of healthy controls and AF patients in sinus rhythm and arrhythmia. Both real time phase contrast and 4D-flow showed a similar increase in left atrium stasis between controls and patients and between patients with low and high heart rate variability, but real time phase contrast was more sensitive to differences.
INTRODUCTION
Atrial fibrillation (AF) is the most common persistent cardiac arrythmia in adults, affecting over 2.7 million people in the United States.1 A serious complication of AF is embolic stroke due to thromboembolism in the left atrium (LA). Traditional clinical risk scores in AF such as CHA2DS2-VASc are based on clinical characteristics rather than physiological mechanics and are relatively poor predictors of stroke.2 Studies have shown that stroke prediction may be improved by measuring hemodynamic metrics related to thrombus formation in the LA.3,4 A previous 4D-flow MRI study has demonstrated that low LA peak velocities and increased LA flow stasis (slow flow) are individual physiological risk factors implicated in stroke.5 4D-flow allows three-directional velocity encoding and comprehensive analysis of 3D flow dynamics, however volumetric data must be acquired over many cardiac cycles (several minutes) and is thus inherently insensitive to beat-to-beat variations, which is particularly relevant in imaging patients with AF. Real time flow imaging allows fluctuations due to heart rate variability to be observed. In this study, a previously developed, 28-fold accelerated real-time phase-contrast (RT-PC) imaging technique6 was employed in conjunction with 4D-flow MRI to analyze the effects of rhythm status on measured LA hemodynamics in patients with AF.METHODS
In this study, 10 healthy controls (mean age 59±19, 5 females) and 12 patients with AF (age 68±8, 1 female) underwent back-to-back 4D-flow and RT-PC MRI on a 1.5T scanner (Siemens, AERA). In addition, all 10 controls and 5 patients returned for repeat MRI scans (to assess scan-rescan reproducibility) for a total of 37 individual MRI datasets. 4D-flow data were acquired using an ECG triggered and respiratory gated pulse sequence with left heart coverage (venc=100 cm/s in three spatial directions, spatial resolution 2.4x2.4x2.6mm, TE=2.6 ms, temporal resolution 40.8ms). RT-PC data were continuously acquired using radial k-space sampling7 with golden angles8 for a 2D oblique slice located in the mid LA and parallel to the mitral valve (venc=60-70 cm/s in through-plane direction, slice thickness 7mm, spatial resolution 2.1x2.1mm, TE=2.5ms, temporal resolution 50.4ms). Acquisition duration varied from 5-20s. Undersampled k-space data were reconstructed using the GROG-GRASP9 framework (Figure 1A) with temporal total variation as the sparsifying transform (normalized regularization weight =0.0078%). The data analysis workflow and co-registration of 4D-flow MRI and 2D RT-PC data is shown in Figure 1. Prior to analysis, both the 4D-flow and rt-PC data were corrected for background phase offsets by subtracting a least squares polynomial fit to static tissue. The 2D RT-PC slice was co-localized with the 4D-flow volume based on image orientation and location embedded in the DICOM header (Figure 1B). 4D-flow data were interpolated within the slice and velocities were projected in the normal direction. LA contours were semi-automatically segmented using a region growing algorithm (Figure 1C). Stasis, previously defined as the percent of time velocities were less than 10cm/s, was calculated here with an adjusted threshold (10/√3) due to measuring only a single velocity component.RESULTS
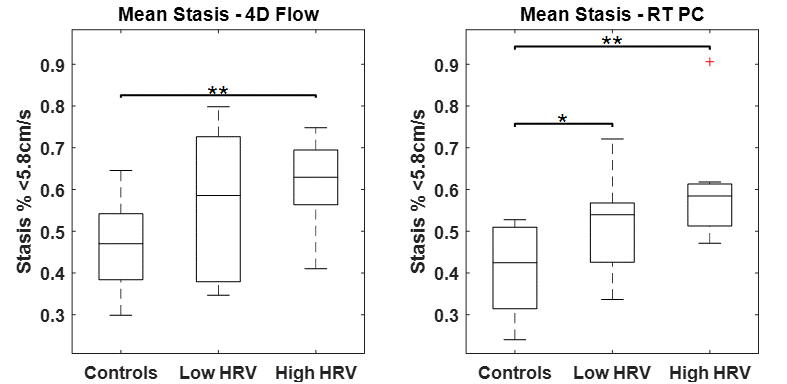
Figure 2 shows LA flow data extracted from RT-PC for an AF patient in sinus rhythm and with arrhythmia. As expected, for the patient in sinus rhythm RR-interval length is consistent over time and flow waveform shape is similar between cycles. In contrast, for patients with arrhythmia, waveform shape is more unpredictable for periods of time, and a large variation in RR-interval length were observed. A side-by-side real-time vs. 4D-flow comparison of LA peak velocity and stasis maps is shown in Figure 3, illustrating good agreement between patterns of both high and low velocities. Across the entire cohort, real-time mean peak velocity (top 5%) and mean stasis measurements were strongly correlated with 4D-flow derived flow metrics (Figure 4, R2=0.72, p<0.001 for velocity and R2 = 0.57, p<0.001 for stasis). Figure 5 shows trend towards higher stasis measured by 4D-flow and RT-PC from controls to AF groups with low heart rate variability (HRV, RR-interval standard deviation < 200, n=6) and high HRV (RR-interval standard deviation ≥ 200, n=6), but the variability was less for RT-PC. Statistically significant differences in mean stasis were observed between controls and high HRV (p<0.001) measured with 4D-flow, and between controls and low HRV (p<0.05) and controls and high HRV (p<0.0001) measured with RT-PC.DISCUSSION AND CONCLUSIONS
Despite challenges associated with unpredictability of cardiac rhythm and breathing patterns, this study demonstrates a framework for comparing 4D-flow and RT-PC. Both 4D-flow and RT-PC were able to detect differences in flow stasis between controls and high HRV groups, while RT-PC was more sensitive to detect differences between controls and the low HRV group. A future study with a larger cohort of AF patient is warranted to fully evaluate the sensitivity of 4D flow and RT-PC acquisitions to cardiac rhythm status for quantification of LA stasis.Acknowledgements
This work is supported by National Institutes of Health (R01HL116895, R01HL138578, R21EB024315, R21AG055954) and the American Heart Association (19IPLOI34760317, 14SFRN20480260).References
1. January CT, Wann LS, Alpert JS, Calkins H, Cigarroa JE, Cleveland JC Jr, et al. 2014 AHA/ACC/HRS guideline for the management of patients with atrial fibrillation. J Am Coll Cardiol. 2014; 64(21):2246–80.
2. Lip GY, Nieuwlaat R, Pisters R, Lane DA, Crijns HJ. Refining clinical risk stratification for predicting stroke and thromboembolism in atrial fibrillation using a novel risk factor-based approach: the euro heart survey on atrial fibrillation. Chest 2010; 137:263–72.
3. Goldman ME, Pearce LA, Hart RG, Zabalgoitia M, Asinger RW, Safford R, Halperin JL. Pathophysiologic correlates of thromboembolism in nonvalvular atrial fibrillation: I. Reduced flow velocity in the left atrial appendage (The Stroke Prevention in Atrial Fibrillation [SPAF-III] study). J Am Soc Echocardiogr. 1999; 12:1080–1087.
4. Fatkin D, Kelly RP, Feneley MP. Relations between left atrial appendage blood flow velocity, spontaneous echocardiographic contrast and thromboembolic risk in vivo. J Am Coll Cardiol. 1994; 23:961–969.
5. Markl M, Lee DC, Ng J, Carr M, Carr J and Goldberger JJ. Left Atrial 4D Flow MRI: Stasis and Velocity Mapping in Patients with Atrial Fibrillation. Invest Radiol. 2016; 51:147.
6. Haji-valizadeh H, Bradley Allen, Roberto Sarnari, Matthew Barrett, Daniel Kim, Rapid, real-time phase-contrast MRI using a combination of radial k-space sampling and compressed sensing with spatially varying regularization weights. ISMRM-ESMRMB 2018.
7. Joseph A, Kowallick JT, Merboldt KD, Voit D, Schaetz S, Zhang S, Sohns JM, Lotz J, Frahm J. Real-time flow MRI of the aorta at a resolution of 40 msec. J Magn Reson Imaging. 2014 40(1):206-13.
8. Winkelmann S, Schaeffter T, Koehler T, Eggers H, Doessel O. An optimal radial profile order based on the golden ratio for time-resolved MRI. IEEE Trans Med Imaging. 2007; 26(1):68-76.
9. Benkert T, Tian Y, Huang C, DiBella EVR, Chandarana H, Feng L. Optimization and validation of accelerated golden-angle radial sparse MRI reconstruction with self-calibrating GRAPPA operator gridding. Magn Reson Med. 2018; 80(1):286-293.
Figures
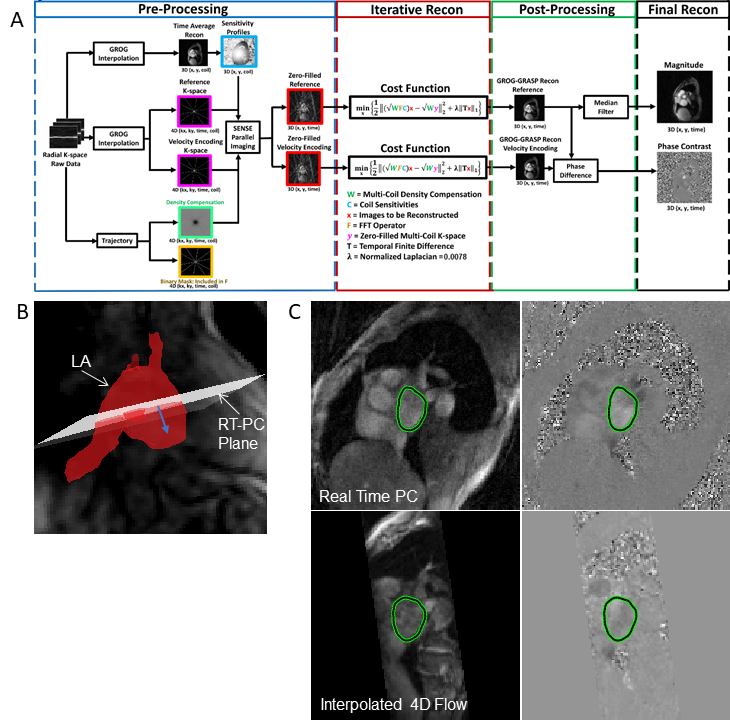
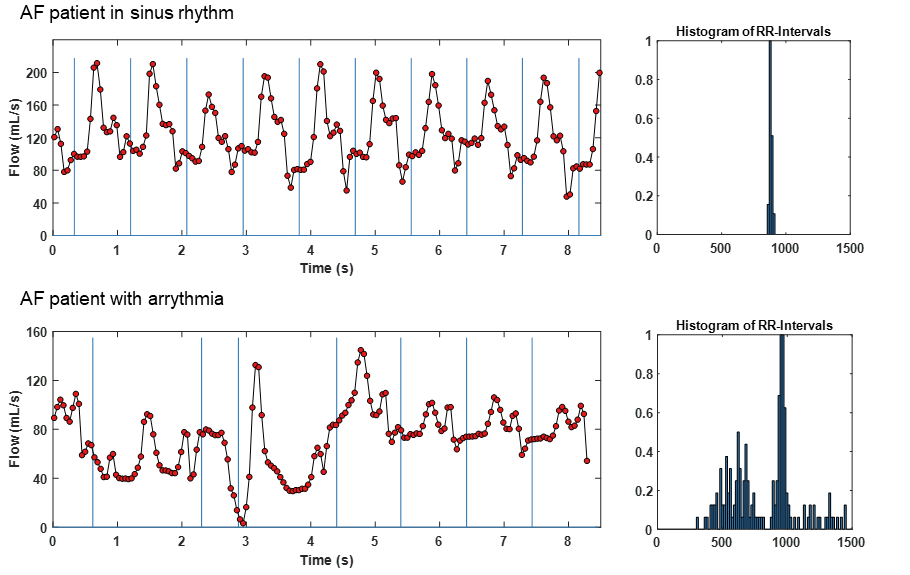
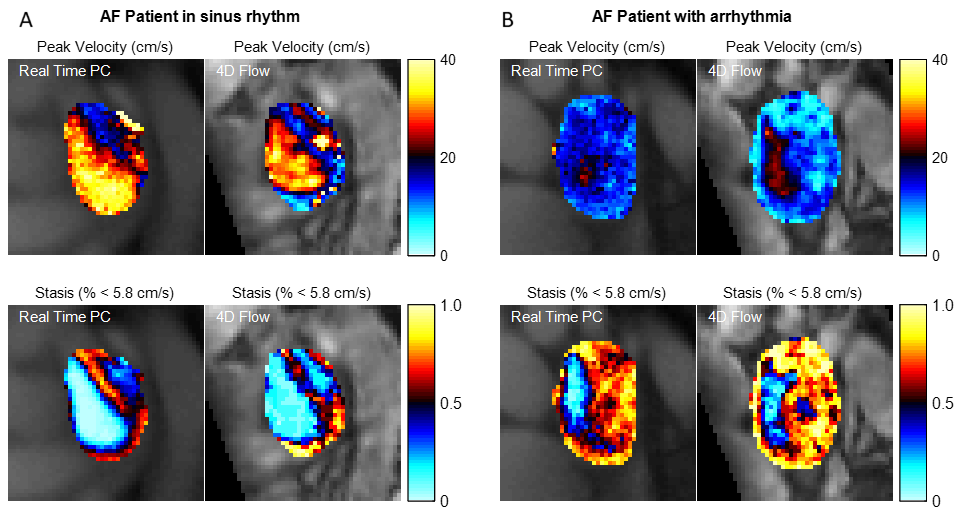
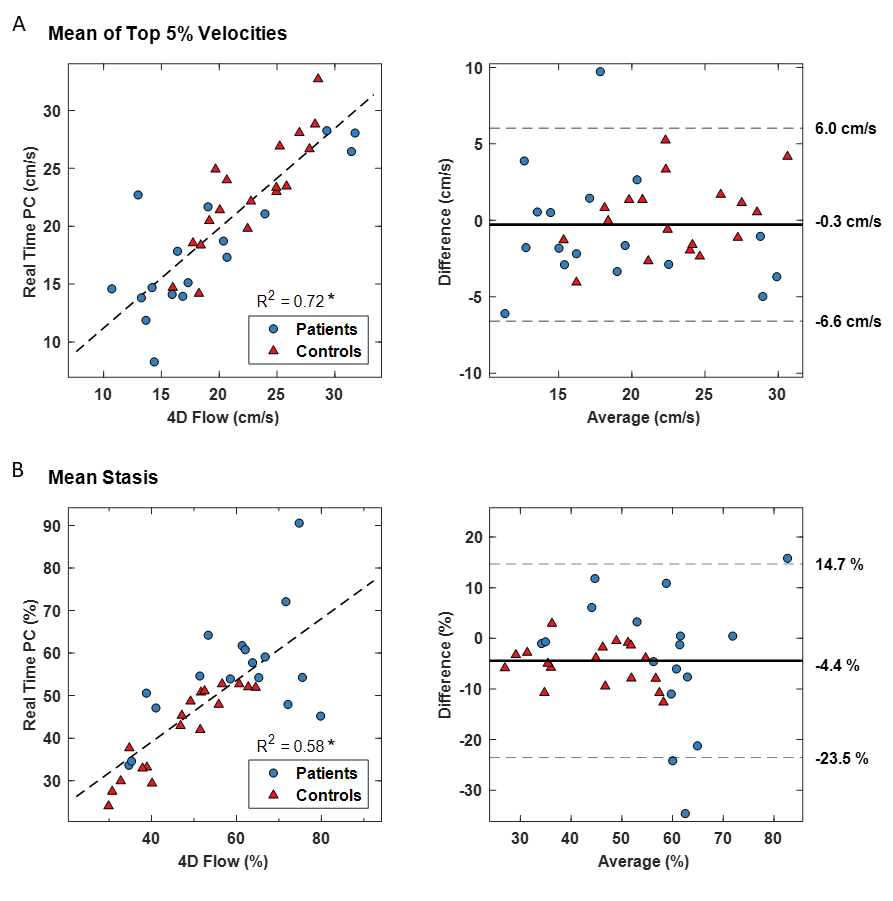
Figure 4: Regression and Bland Altman analysis. A) Peak velocities measured as mean of the top 5% of all velocities in segmented region over time. B) Mean stasis over the segmented region. *p<0.0001