1201
Estimating Blood Volume with Ferumoxytol at 0.55 T1National Heart Lung and Blood Institute, National Institutes of Health, Bethesda, MD, United States
Synopsis
Off-label use of ferumoxytol as an intravascular contrast agent for cardiovascular imaging is increasing. Measurements of circulating blood volume using dilution techniques has been previously demonstrated with ferumoxytol at 1.5 T. The relaxivity of ferumoxytol at low field (0.55 T) is increased, making it an attractive approach potentially requiring reduced dosages. Here we successfully demonstrate the feasibility of measurement of total circulating blood volume at lower field strength in swine.
Introduction
Measurement of total circulating blood volume can have impact in the management of various cardiac conditions including heart failure.1,2 Previous work demonstrated the feasibility of estimating circulating blood volume at 1.5 T based on an infusion of ferumoxytol, an intravascular contrast agent.3-5 Ferumoxytol, a superparamagnetic iron nanoparticle with a long half-life (9-14 hrs),6 significantly shortens T1 of the blood pool. This change in T1 can be used to estimate the total plasma volume, and after correction for hematocrit, the total circulating blood volume.This work evaluates the technique’s suitability in application at 0.55 T where the increased relaxivity of ferumoxytol (35.7 mM-1s-1 vs. 18.0 mM-1s-1 at 1.5 T),7 can improve the signal-to-noise ratio of T1 mapping. We investigate reduced dosages of ferumoxytol test a new biexponential fitting approach for estimation of blood volume.
Theory
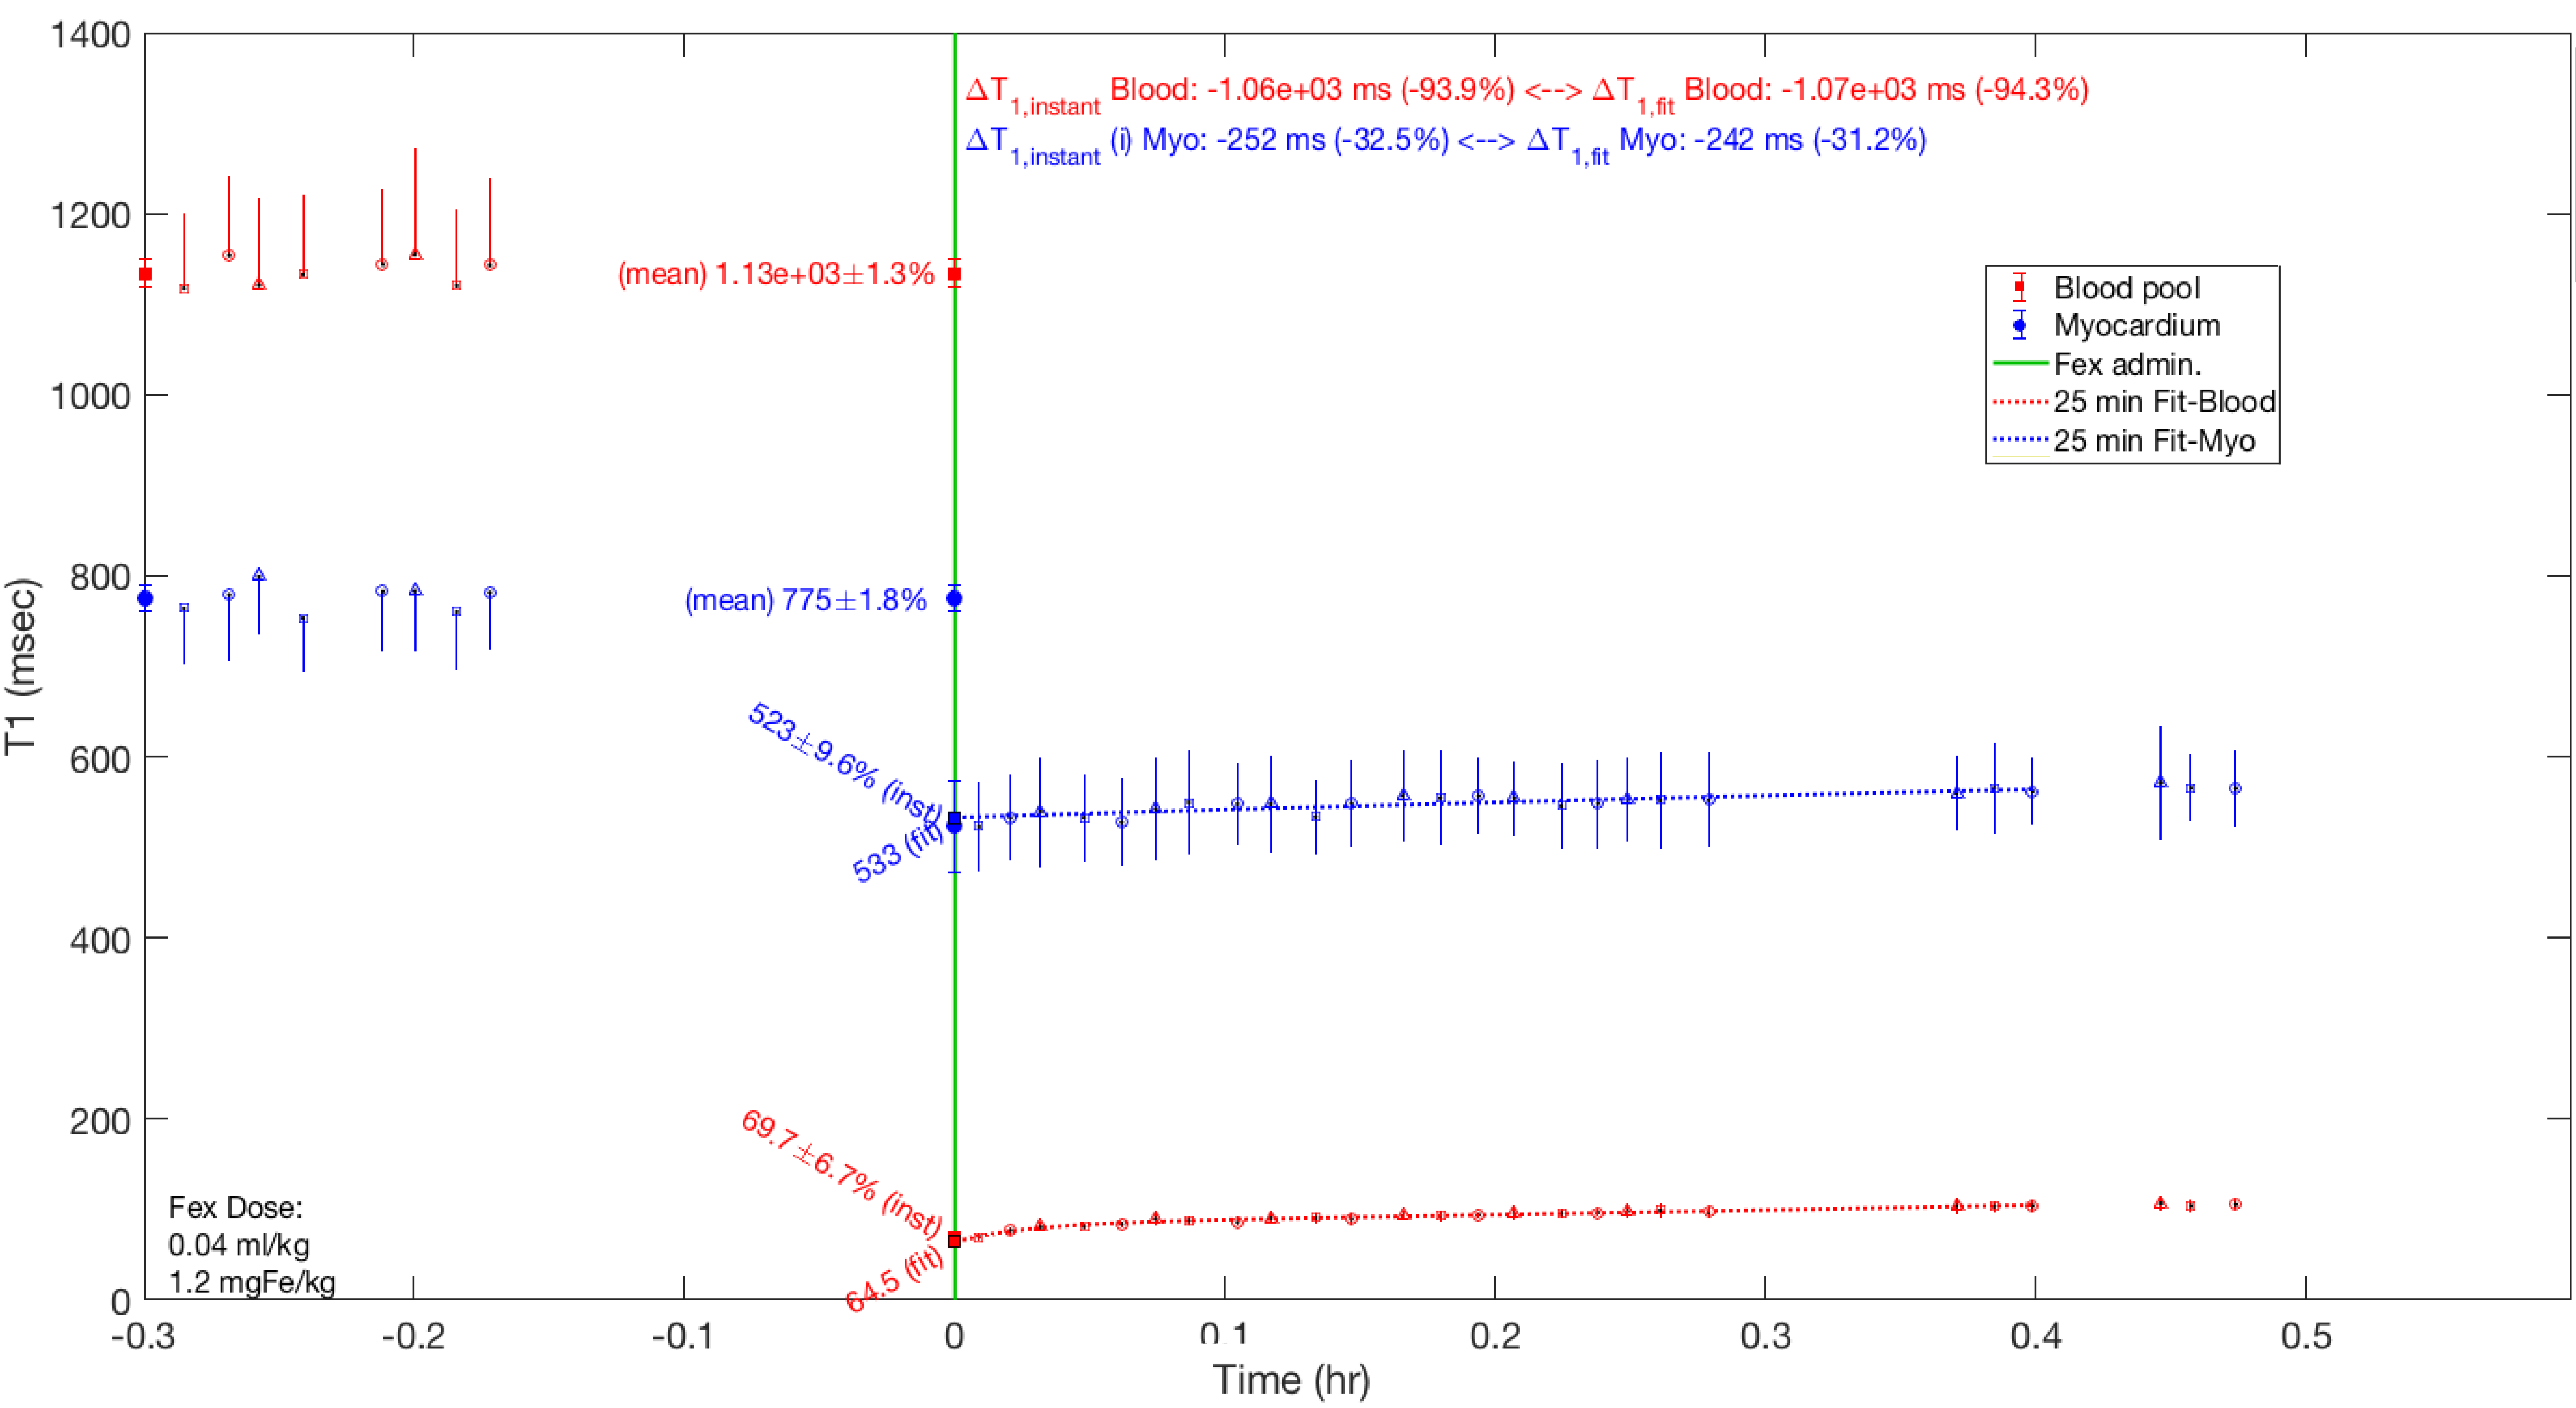
Plasma volume can be estimated with ferumoxytol with two methods: (1) by acquiring sequential measurements of T1 and fitting the resulting temporal relationship (e.g. T1 or plasma volume vs. time) to estimate the intercept,3-4 and (2) by measuring T1 immediately post infusion, before potential removal of iron by the liver.4 The first method is more accurate though requires multiple measurements of T1 spanning 10-15 min for robust fitting,3 and while the second method is more efficient, requiring only a one post-infusion measurement, it is time- and infusion rate-dependent. This work builds on method (1), using a bi-exponential fit to characterize the acute behavior following ferumoxytol infusion.Methods
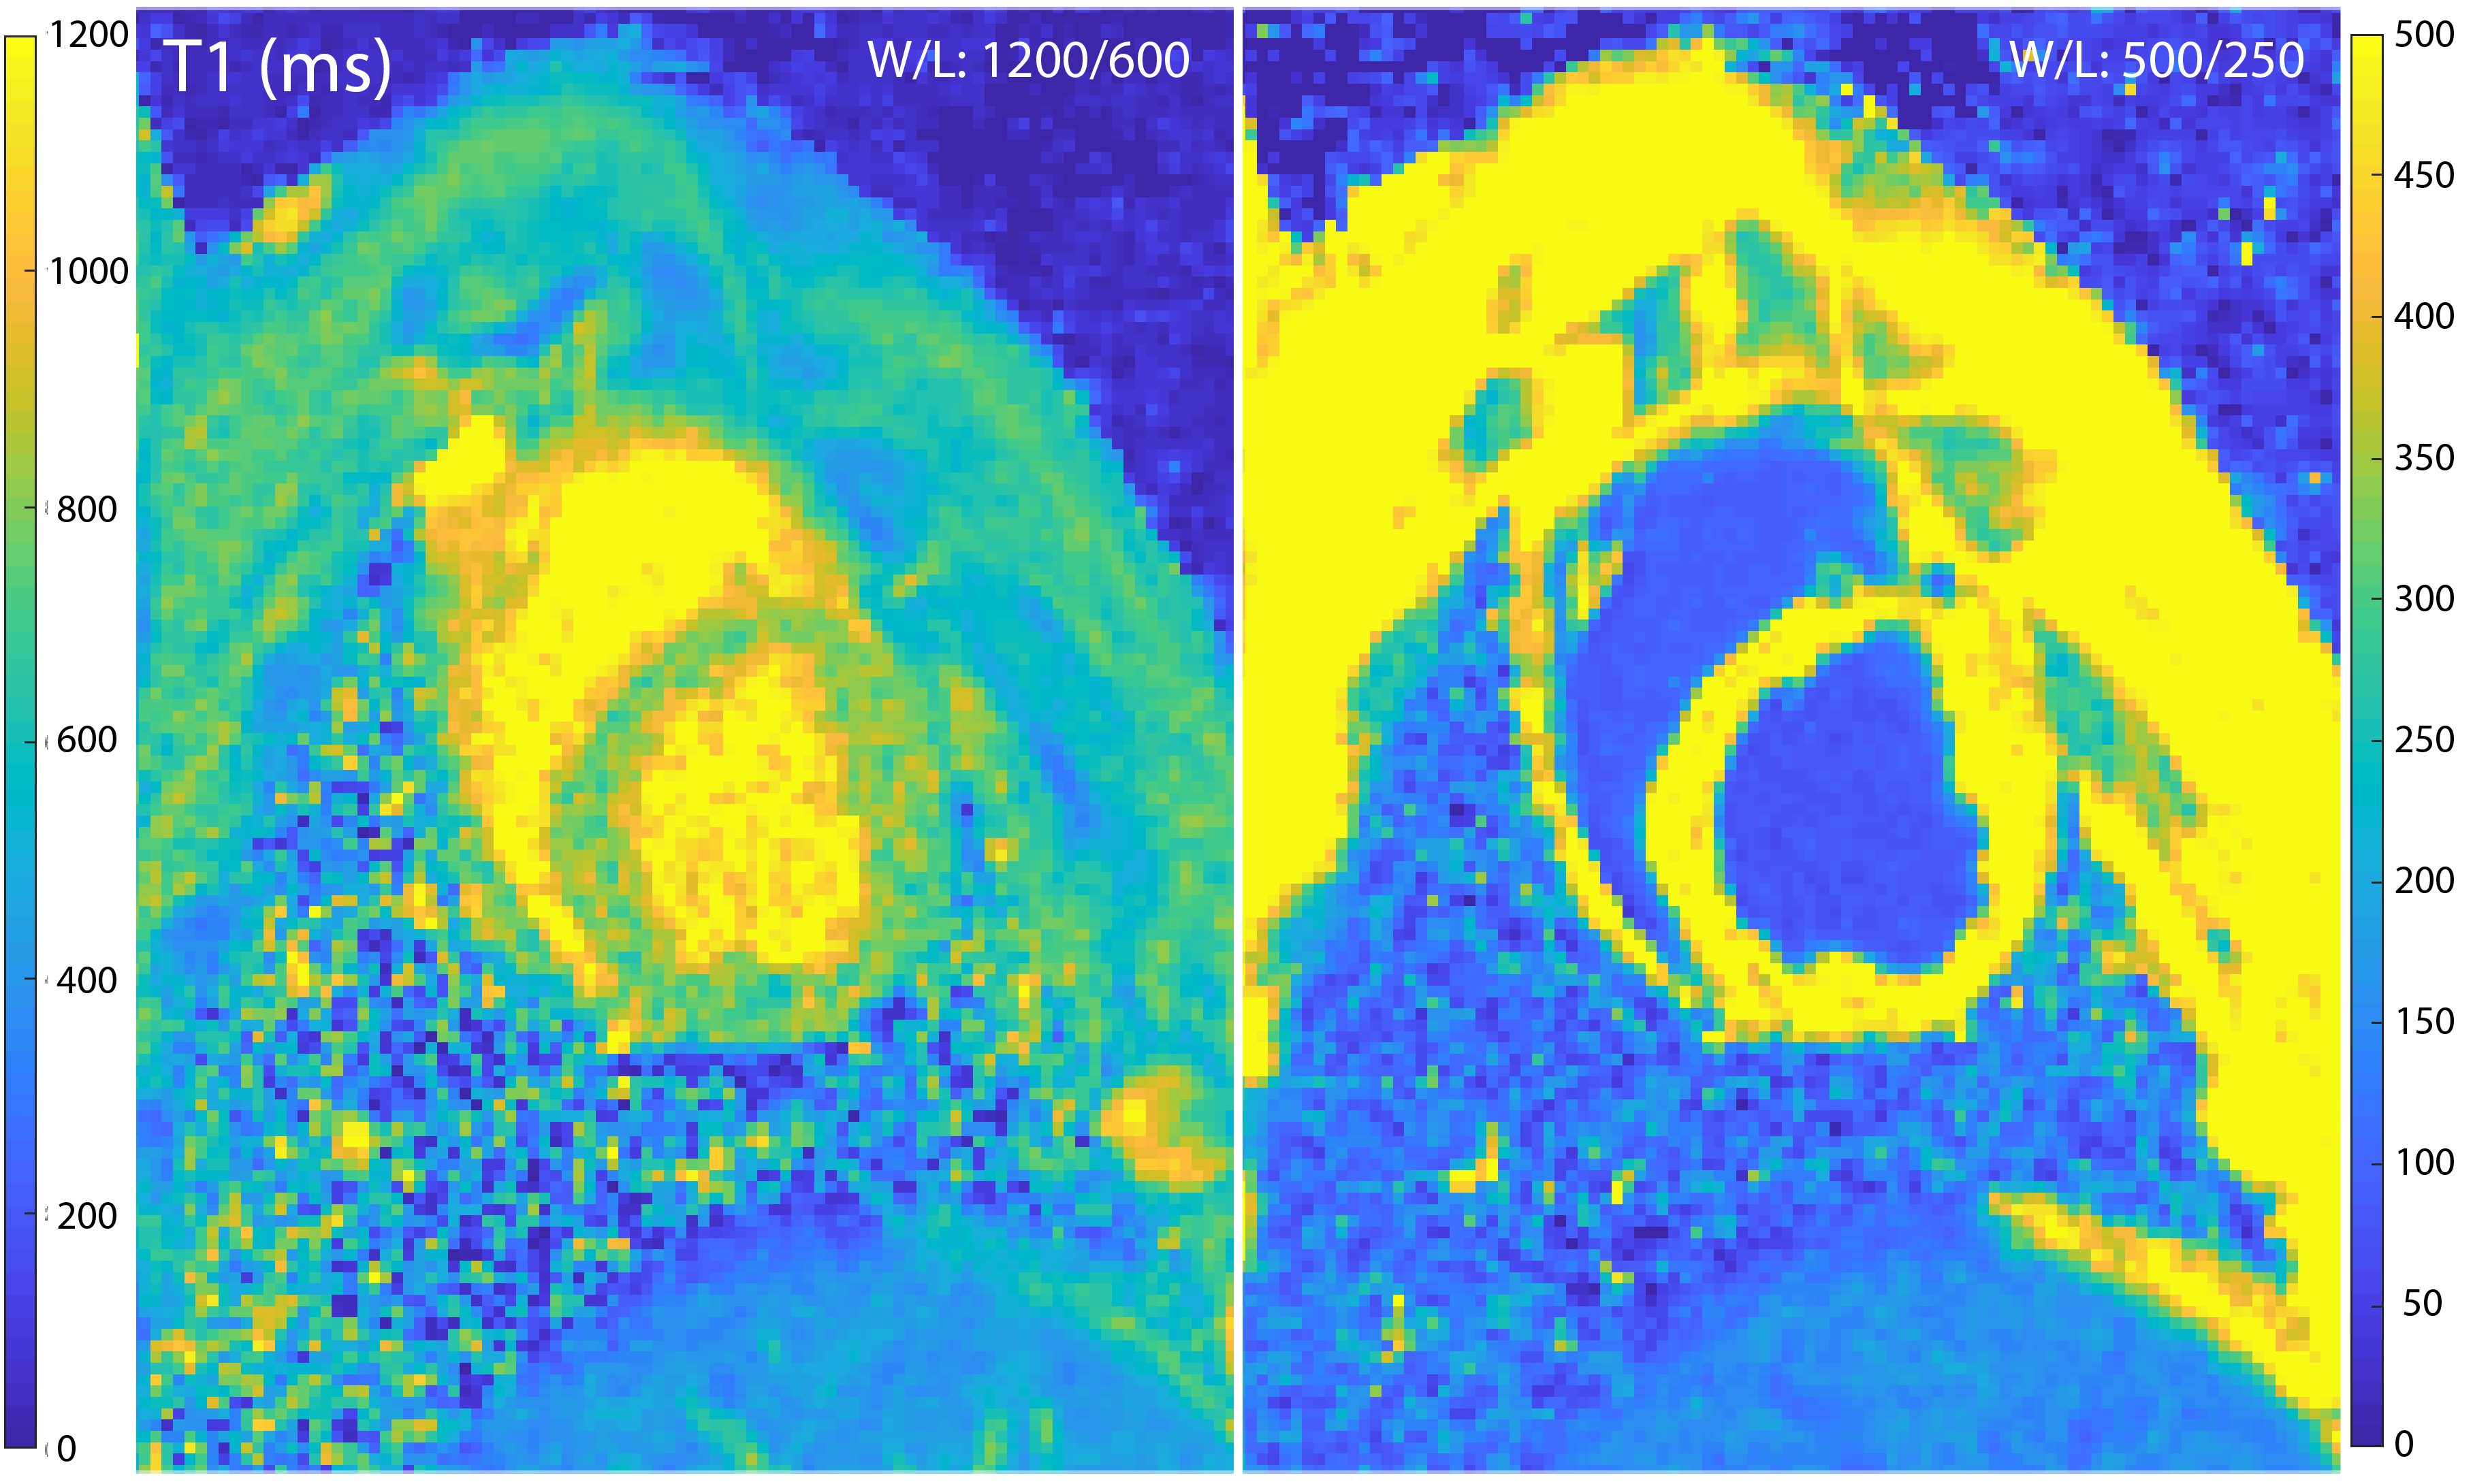
All imaging was performed at 0.55 T (prototype MAGNETOM Aera, Siemens Healthcare, Erlangen, Germany) in accordance with the local ethics board. Ferumoxytol (Feraheme, AMAG Pharmaceuticals, Waltham, MA, USA) was injected repeatedly over multiple sessions in N=3 Yucatan swine (43.4±1.7 kg, range 41-47 kg, S&S Farms, USA), and in N=9 Yorkshire swine (48.3±6.2 kg, range 35-56 kg, S&S Farms, USA). The two swine breeds are expected to have different plasma volumes as blood volume tends to decrease with age and Yorkshire swine are not fully mature at the given weight range. Doses of 0.015 (n=2), 0.03 (n=6), 0.06 (n=9) and 0.12 (n=6) mgFe/kg were used. Ferumoxytol was diluted with saline into a total volume of 9 ml (doses<0.12 ml) or 12 ml and infused at a rate of 0.1 ml/sec.Breath-held T1 mapping was carried out prior and periodically up to 30 min after infusion. A customized saturation-recovery single-shot acquisition,8 (SASHA) was used with the following typical imaging parameters: spatial resolution 1.6x1.6x8 mm, 0.875 partial Fourier sampling, GRAPPA acceleration factor 2, and 80° flip angle. Three short-axis slices were imaged and LV blood pool and septal myocardium ROIs were manually drawn. The pre-ferumoxytol T1s were averaged from 9 repeats.
Results
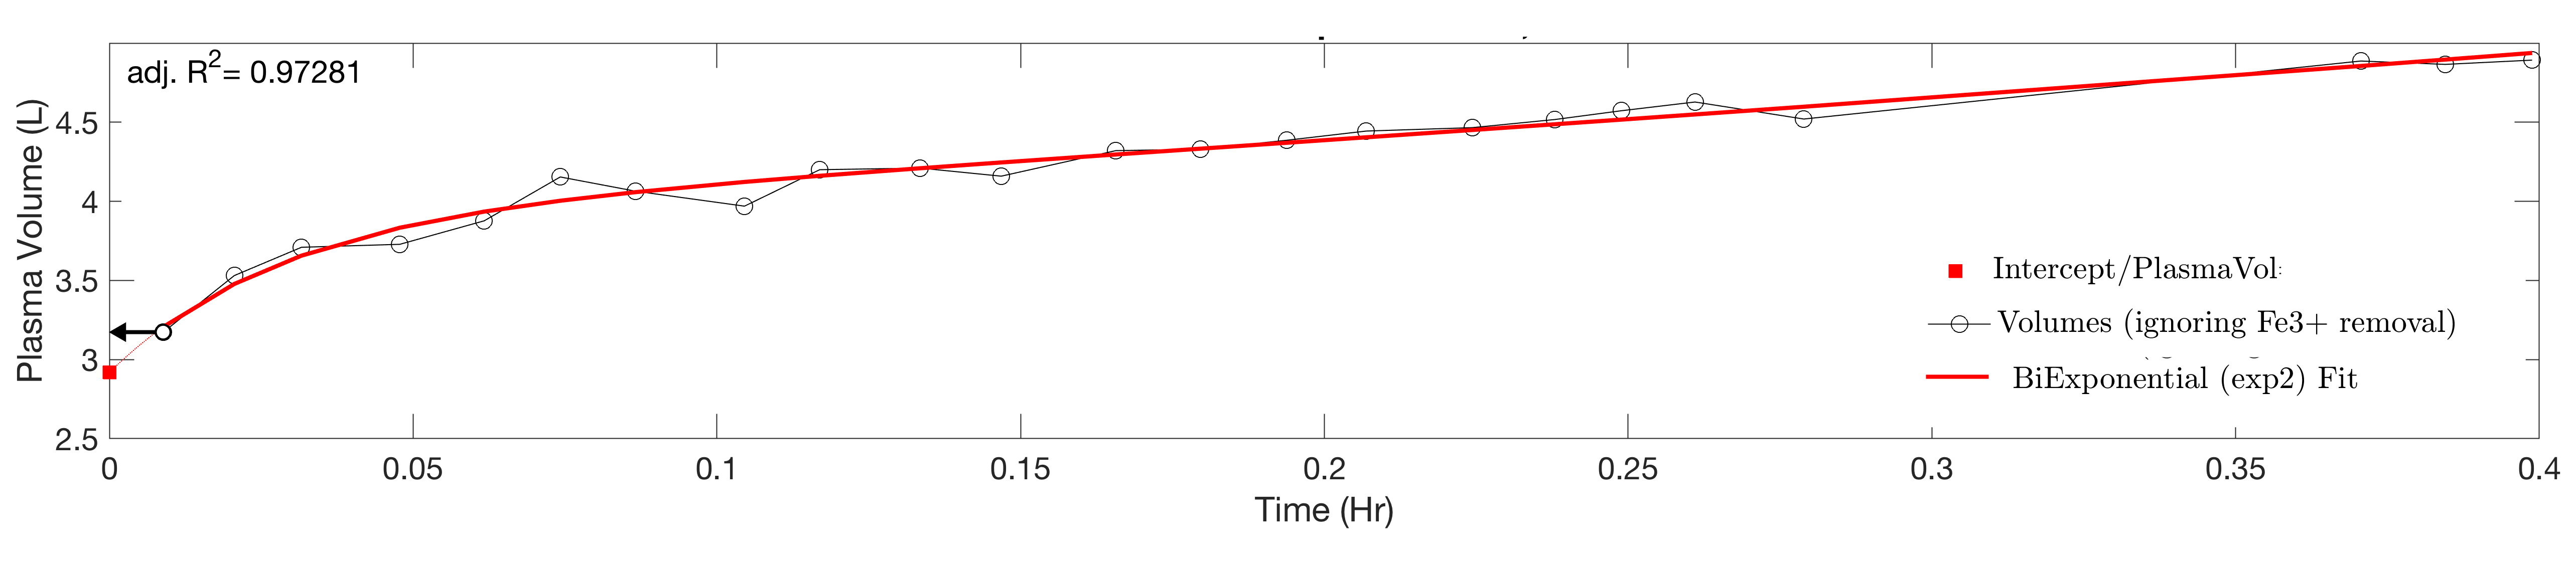
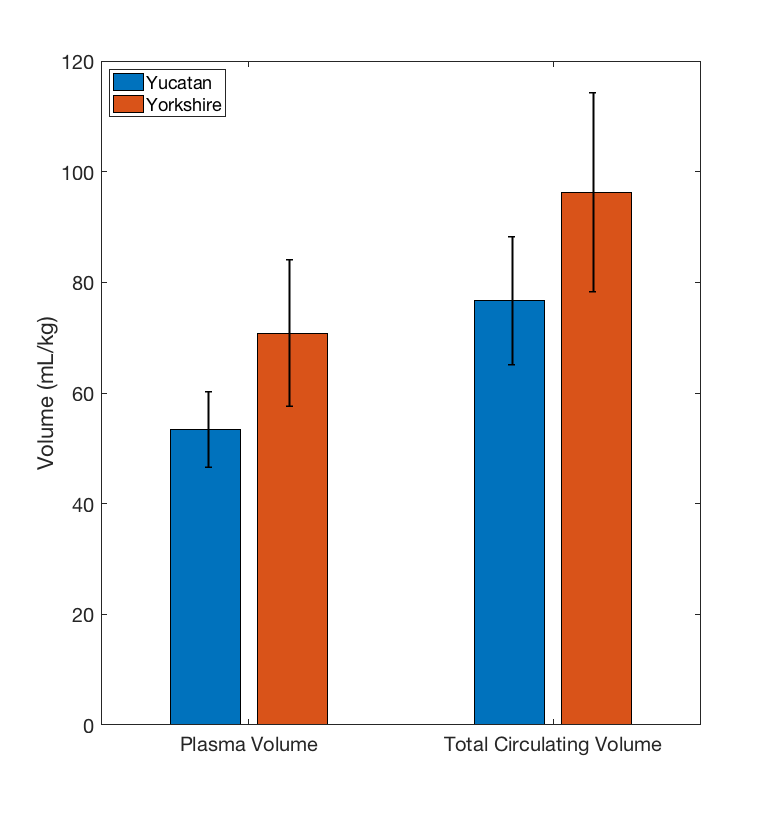
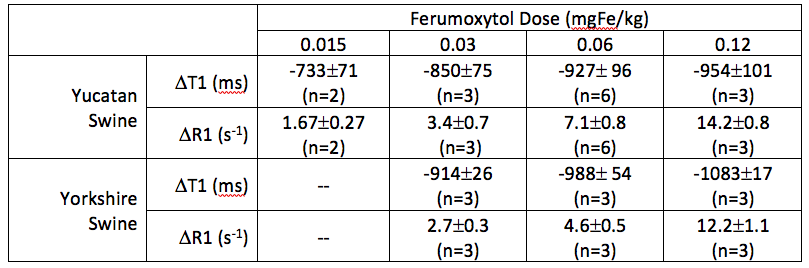
Sample T1 maps can be seen in Figure 1 and Table 1 contains the changes in T1 and R1 (=1/T1) observed at the various doses. Data from a representative set of serial T1 measurements can be seen in Figure 2. Figure 3 displays the corresponding fitting curve generated from sequential T1 measurements.Figure 4 displays the measured plasma and total circulating blood volumes. Plasma volume estimation was feasible at all doses tested as demonstrated by the fitting regression coefficient (average adjusted r2=0.91±0.9). Yucatan swine had a plasma volume of 53.4±6.9 ml/kg and a total circulating volume of 76.3±11.6 ml/kg. Yorkshire swine had a plasma volume of 70.8±13.3 ml/kg and a total circulating volume of 96.3±17.9 ml/kg.
Discussion
Biexponential fitting of plasma volume resulted in more accurate estimation, as it accounts for the non-linear blood pool T1-behaviour observed within the first 10 minutes after infusion. It is unclear whether human subjects demonstrate the same behavior upon administration of ferumoxytol. Fitting required frequent measurements post-infusion while instantaneous estimation of plasma volume based on the earliest (or lowest) T1 measurement yielded equivalent values as long as the time between administration of agent and measurement of T1 was minimal (~ <2 min). The measurements of blood plasma volume obtained are within ranges measured in swine from the literature and are slightly smaller than those reported at 1.5 T (61.9±4.3 ml/kg at 1.5 T in Yucatan swine,3), potentially due to the use of more accurate biexponential fitting.Though all doses resulted in viable estimation of plasma volume, a dose 0.015 mgFe/kg is likely unattractive as it resulted in blood pool T1 nearing normal myocardium T1, significantly reducing tissue contrast. Doses >0.12 mgFe/kg would be more representative of those used in human subjects,5 but were not considered as (1) swine tend to have anaphylactoid responses to the agent more commonly than humans and at much lower doses, and (2) blood pool T1 shortens enough (<60-70 ms) to reach the bounds of accurate measurements with standard T1 mapping techniques.
Conclusion
Due to current uncertainties associated with Gadolinium-based contrast agents, ferumoxytol present a viable and safe alternative for diagnostic scans based on blood pool signals such as flow and angiography.5 We demonstrate that ferumoxytol-based estimation of plasma and total circulating blood volume is feasible at low field strength, even when using low dosage, providing additional diagnostic value.Acknowledgements
This work was supported by the NHLBI DIR (Z01-HL006039, Z01-HL005062). We would like to acknowledge the assistance of Siemens Healthcare in the modification of the MRI system for operation at 0.55T under an existing cooperative research agreement between NHLBI and Siemens Healthcare.References
1) Yancy CW, et al. 2013 ACCF/AHA guideline for the management of heart 0failure: executive summary: a report of the American College of Cardiology Foundation/American Heart Association Task Force on practice guidelines. Circulation. 2013;128(16):1810–52.
2) Miller WL , et al. Understanding the heterogeneity in volume overload and fluid distribution in decompensated heart failure is key to optimal volume management: role for blood volume quantitation. JACC: Heart Failure. 2014;(2)3: 298-305.
3) Ramasawmy et al. Blood volume measurement using cardiovascular magnetic resonance and ferumoxytol: preclinical validation. J Cardiovasc Magn Reson. 2018;20:62.
4) Pannek K, et al. Contrast agent derived determination of the total circulating blood volume using magnetic resonance. MAGMA. 2012;25(3):215–22.
5) Nguyen KL, et al. Multicenter safety and practice for off-label diagnostic use of ferumoxytol in MRI. Radiol. 2019:00:1-12.
6) Landry R, et al. Pharmacokinetic study of ferumoxytol: a new iron replacement therapy in normal subjects and hemodialysis patients. Am J Nephrol. 2005;25(4).
7) Campbell-Washburn AE, et al. Opportunities in Interventional and Diagnostic Imaging by Using High-Performance Low-Field-Strength MRI. Radiology. 2019 Nov;293(2):384-393.
8) Chow K, et al. Saturation recovery single-shot acquisition (SASHA) for myocardial T(1) mappin. Magn Reson Med. 2014 Jun;71(6):2082-95.
Figures