1199
Evaluation of potential hemodynamic biomarkers in experimental PAH using center-out stack-of-stars 4D phase contrast velocity mapping1Institute of Diagnostic and Interventional Radiology, Medical Physics Group, University Hospital Jena, Jena, Germany, 2Institute of Medical Microbiology, University Hospital Jena, Jena, Germany, 3Institute of Computer Science, Department of Mathematics and Computer Science, Westfälische Wilhelms-Universität Münster, Muenster, Germany, 4Department of Internal Medicine I, Division of Cardiology, Angiology, Pneumology, and Intensive Medical Care, University Hospital Jena, Jena, Germany, 5Department of Cardiothoracic Surgery, University Hospital Jena, Jena, Germany, 6Institute of Molecular Cell Biology, Center of Molecular Biomedicine, University Hospital Jena, Jena, Germany, 7Department of Internal Medicine, Division of Cardiology, University Hospital Düsseldorf, Düsseldorf, Germany, 8Institute of Legal Medicine, Section of Pathology, University Hospital Jena, Jena, Germany, 9Department of Clinical Radiology, University Hospital Muenster, Muenster, Germany
Synopsis
Potential hemodynamic biomarkers of pulmonary arterial hypertension (PAH) and consecutive right ventricular remodeling were investigated by 4D flow center-out stack-of-stars velocity mapping in a rat model of monocrotaline induced PAH in comparison to healthy controls and a treatment group taking Macitentan. The averaged-mean values of blood flow velocities of pulmonary tract were substantially decreased in the diseased animal group compared to the control and under-treatment group. Diseased animals further showed a pronounced pressure gradient drop between the pulmonary artery bronchial branches and pulmonary veins. The effect of vascular resistance was additionally noted in the velocity-time curve of the pulmonary arteries.
INTRODUCTION
Pulmonary arterial hypertension (PAH) which is the first of five groups of pulmonary hypertension (PH) is defined as an increase of resting mean pulmonary atrial pressure > 25mmHg, pulmonary capillary wedge pressure < 15mmHg, and pulmonary vascular resistance ≥ 3 Wood units in right heart catheterization (RHC)1,2. PAH is associated with increased right ventricular (RV) afterloads; thus, an adaptive or maladaptive right ventricular remodeling is a natural result of this disease with significantly different prognostic impact1,3,4. The transition mechanism from adaptive to maladaptive remodeling and right ventricle failure is still unknown3. To this end, potential hemodynamic biomarkers were investigated in an animal model of monocrotaline (MCT) induced PAH by 4D flow center-out stack-of-stars velocity mapping MRI to differentiate between the diseased, healthy, and under-treatment populations with a specific focus on the development of right ventricle failure.METHODS
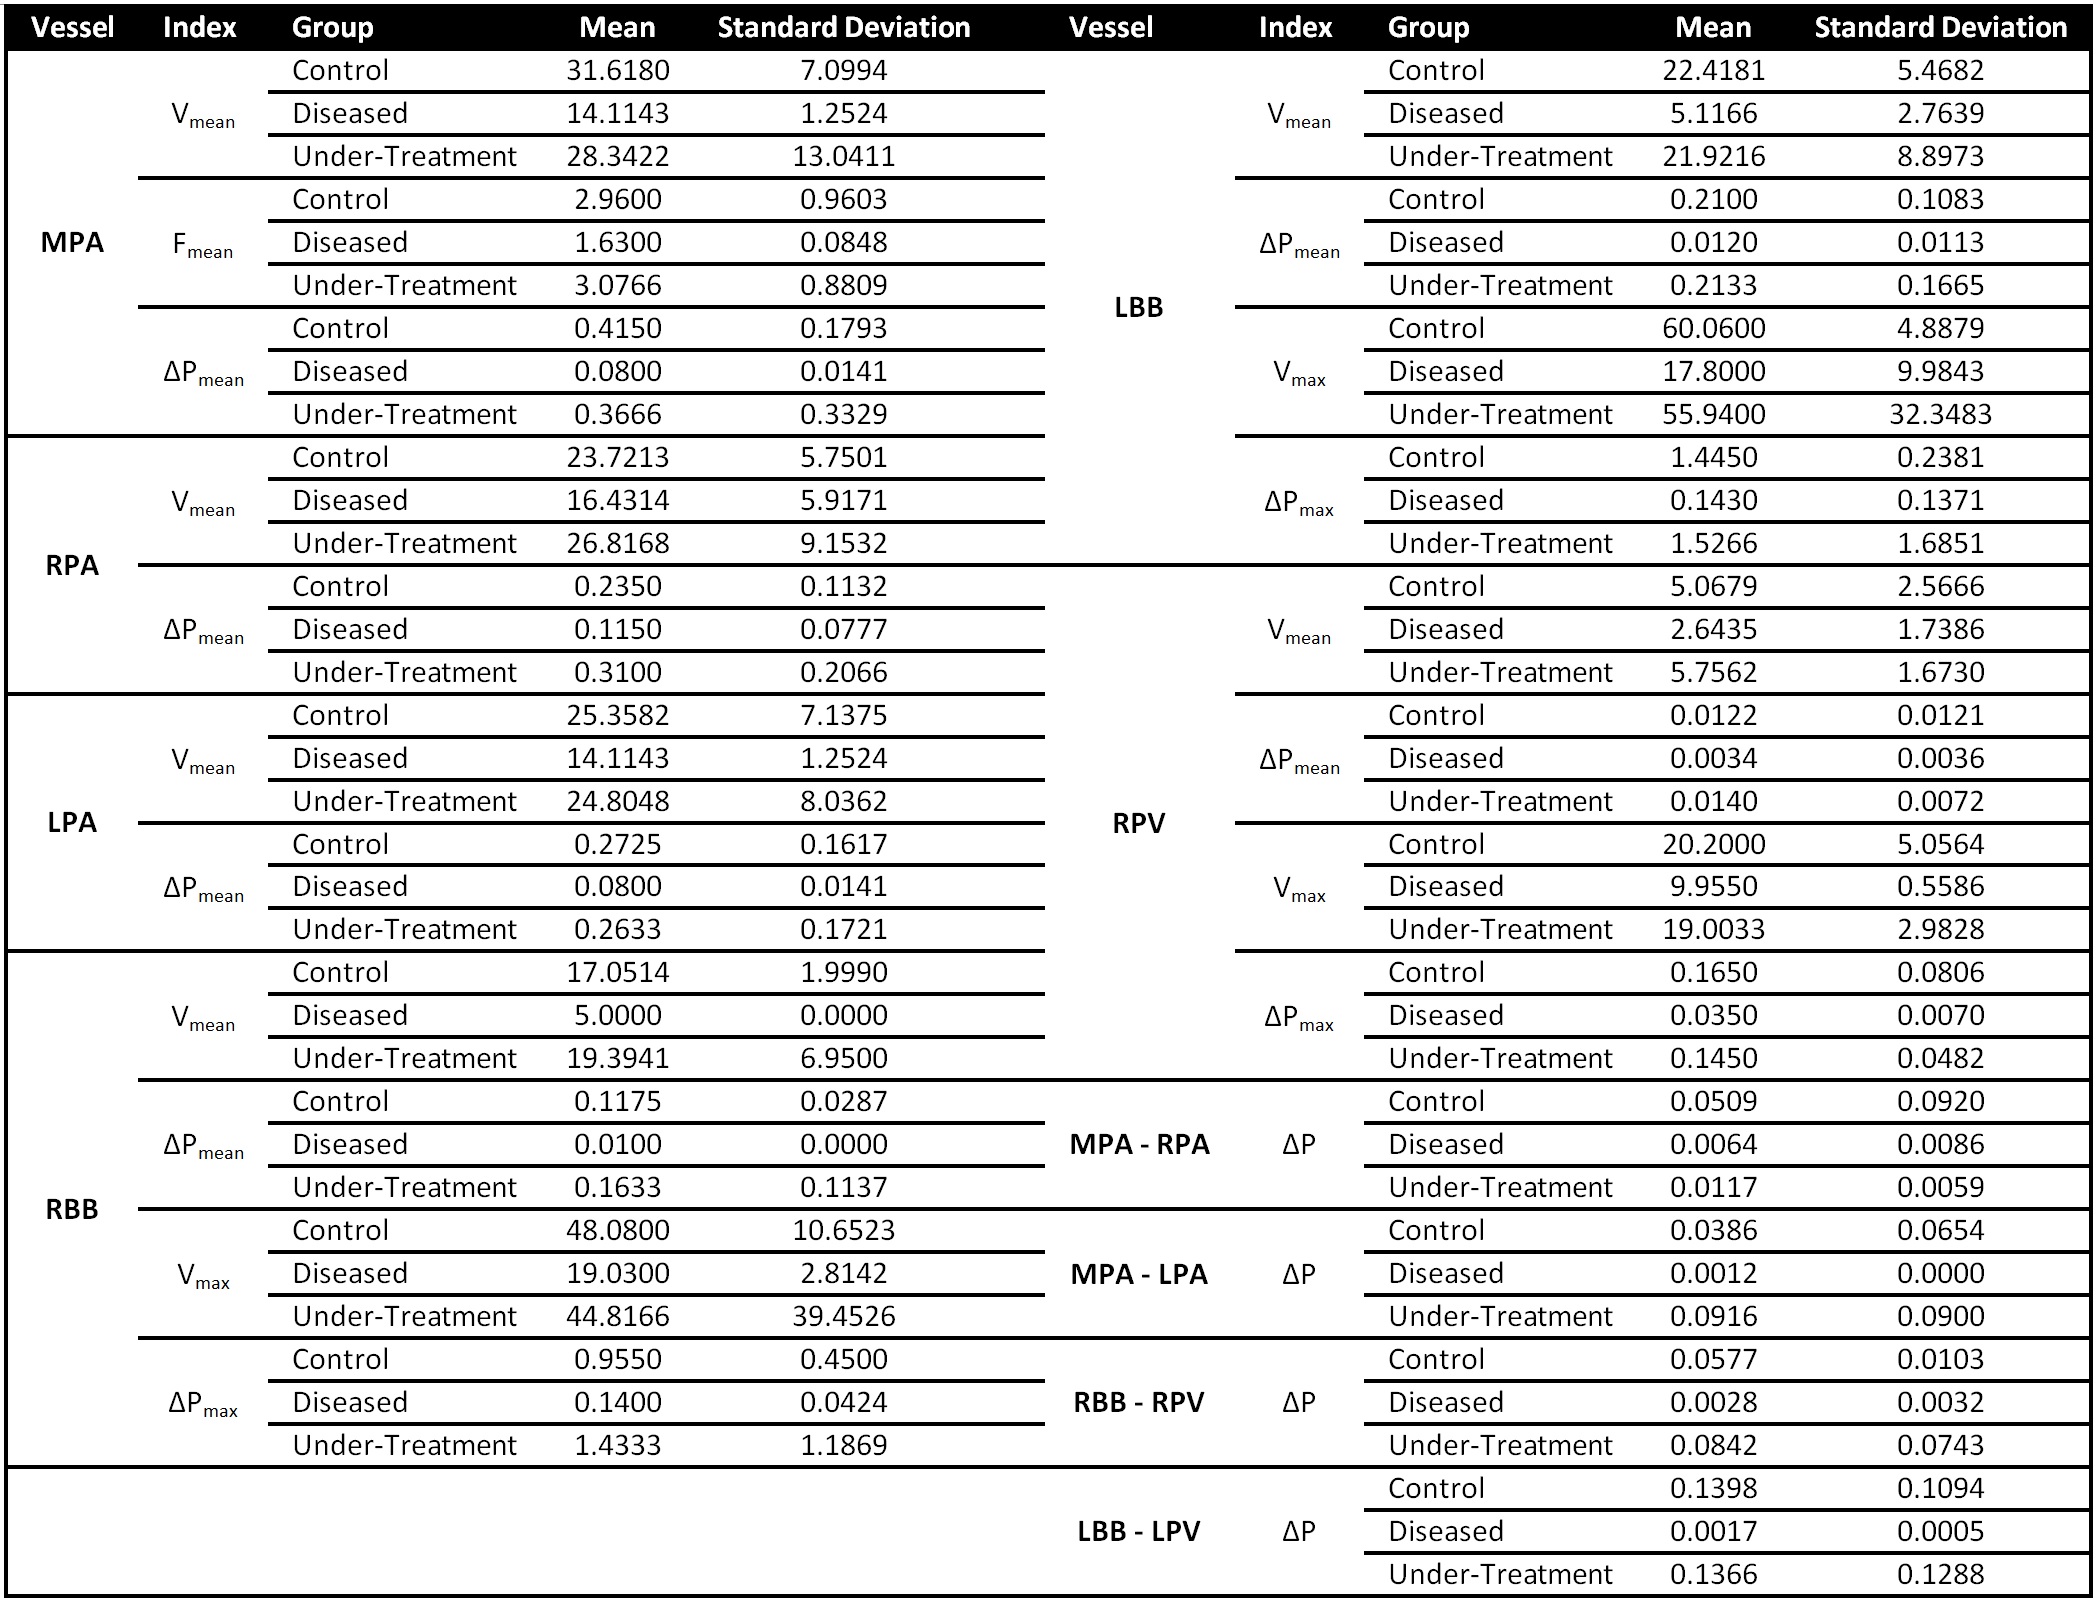
Three different groups of Sprague Dawley rats were included in the study: control (n=6); PAH diseased (n=6, s.c. injection of a single dose of 60mg/kg Monocrotalin); and under-treatment (n=6, with the additional oral application of 15mg/kg Macitentan from day 14 to 28). Non-invasive and invasive investigations were performed between day 26 and 28 of the study. All animals underwent TTE (Vevo-770 Rodent-Ultrasound system, Visual Sonic, Canada, 17MHz probe RMV176) one day prior to and RHC via the right internal jugular vein (1.4F micro-conductance pressure-volume catheter, model SPS-839, Millar Instruments Inc, Oxford, UK) right after the MRI scans. A prospectively respiratory and cardiac gated 4D flow center-out stack-of-stars phase contrast (PC) sequence with balanced 4-point (HADAMARD) velocity encoding gradient scheme was performed on all groups by the use of a 9.4 Tesla Bruker BioSpec USR 94/20 and a vendor supplied 72-mm-diamater quadrature volume coil with the following parameters: TR=10ms; TE=1.1ms; RF-pulse-shape=SINC; FA=10°; BW=100kHz; polar undersampling factor=1.5; averages=1; resolution=375*375*375 µm3; VENC=90-200 cm/s. All acquired free-induction-decay (FID) raw data were regridded offline with iterative sampling density estimation and optimized kernel by the use of a local MATLAB (MathWorks, Natick, MA, USA) framework to produce transformable k-space data. A three-dimensional Fast-Fourier-Transform was performed on each time frame and velocity encoding module to calculate final velocity maps. Region- of-interest (ROI) based quantitative analysis of hemodynamic velocities and pressure gradients were performed in pulmonary arteries, veins and bronchial branches (see Table 1).RESULTS
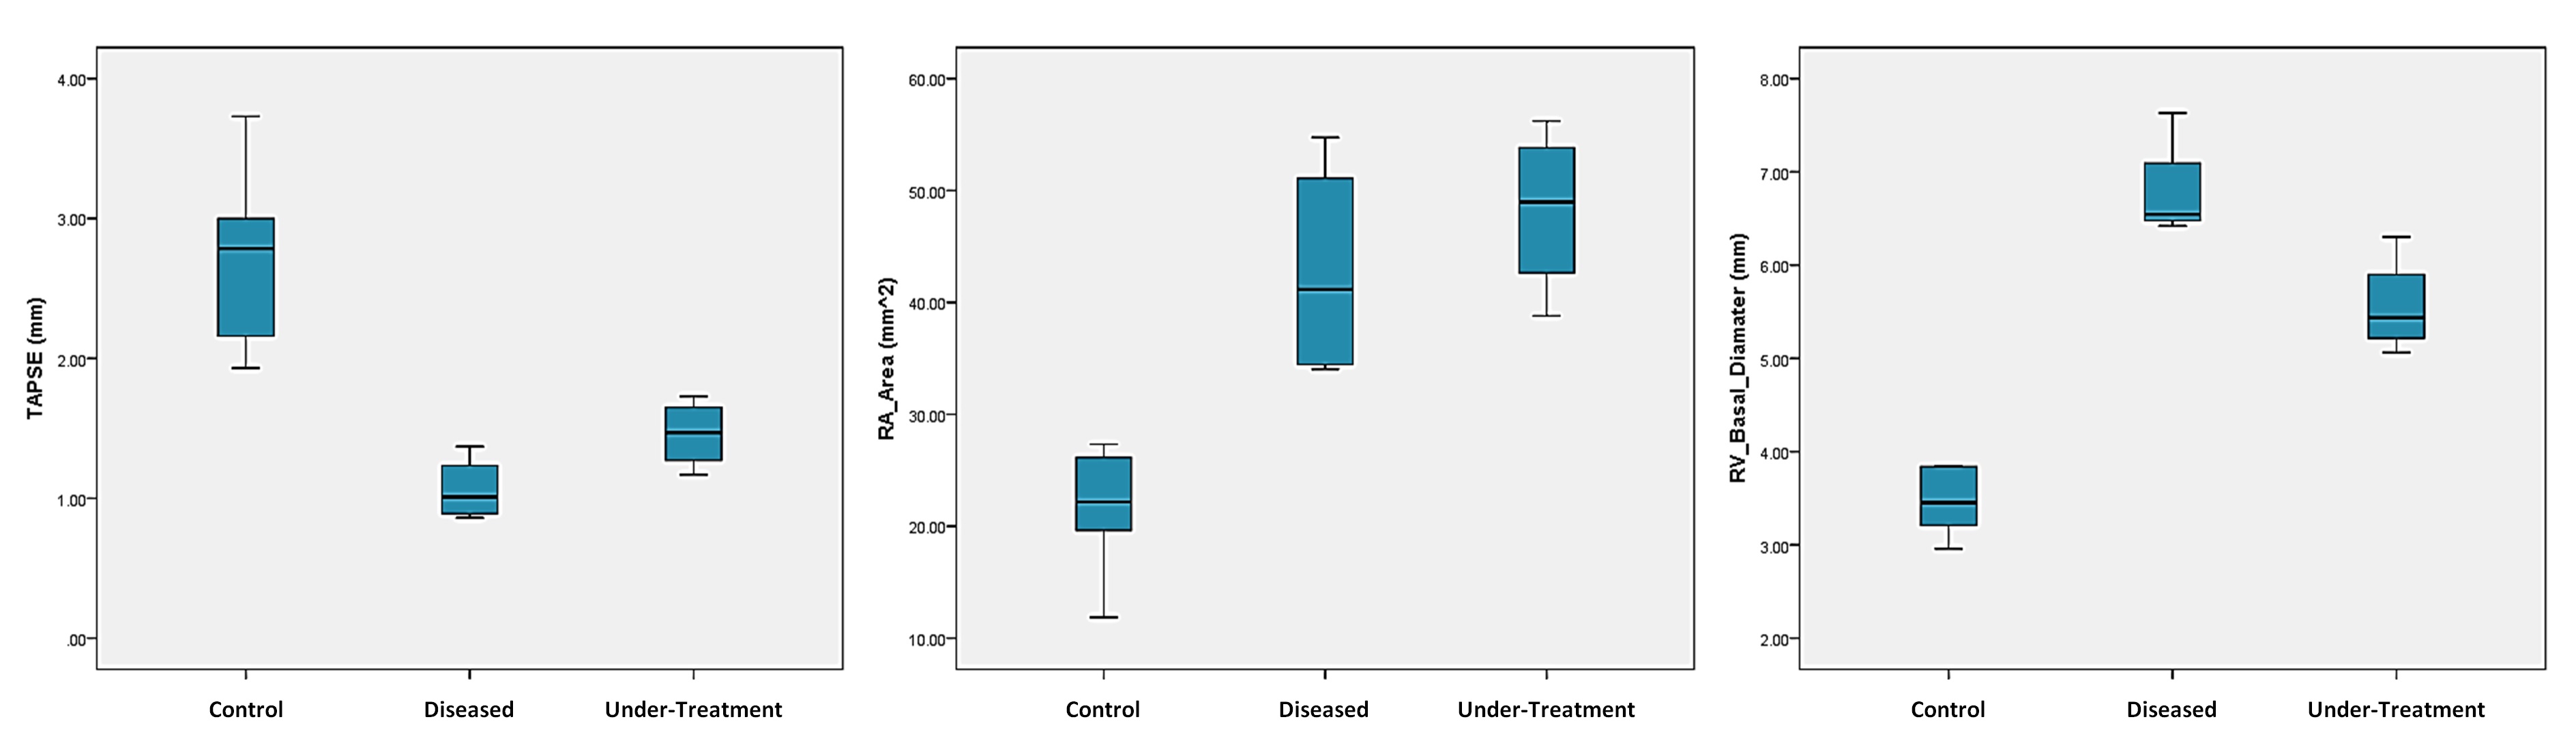
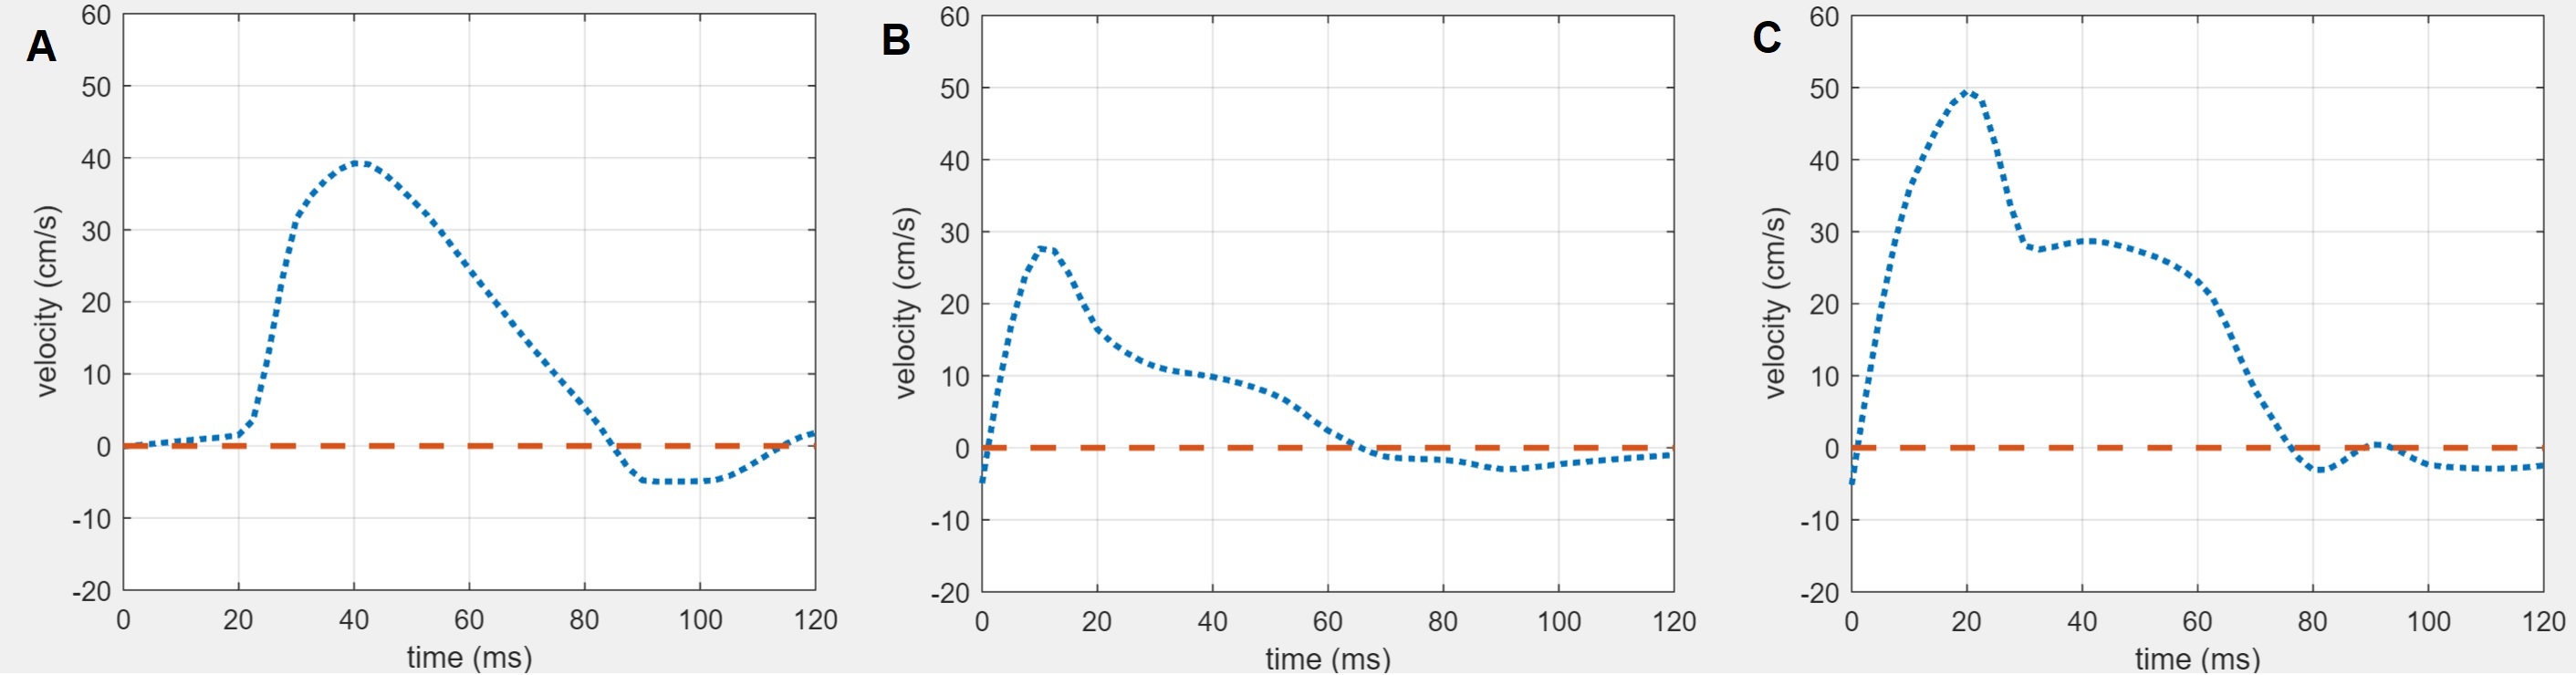
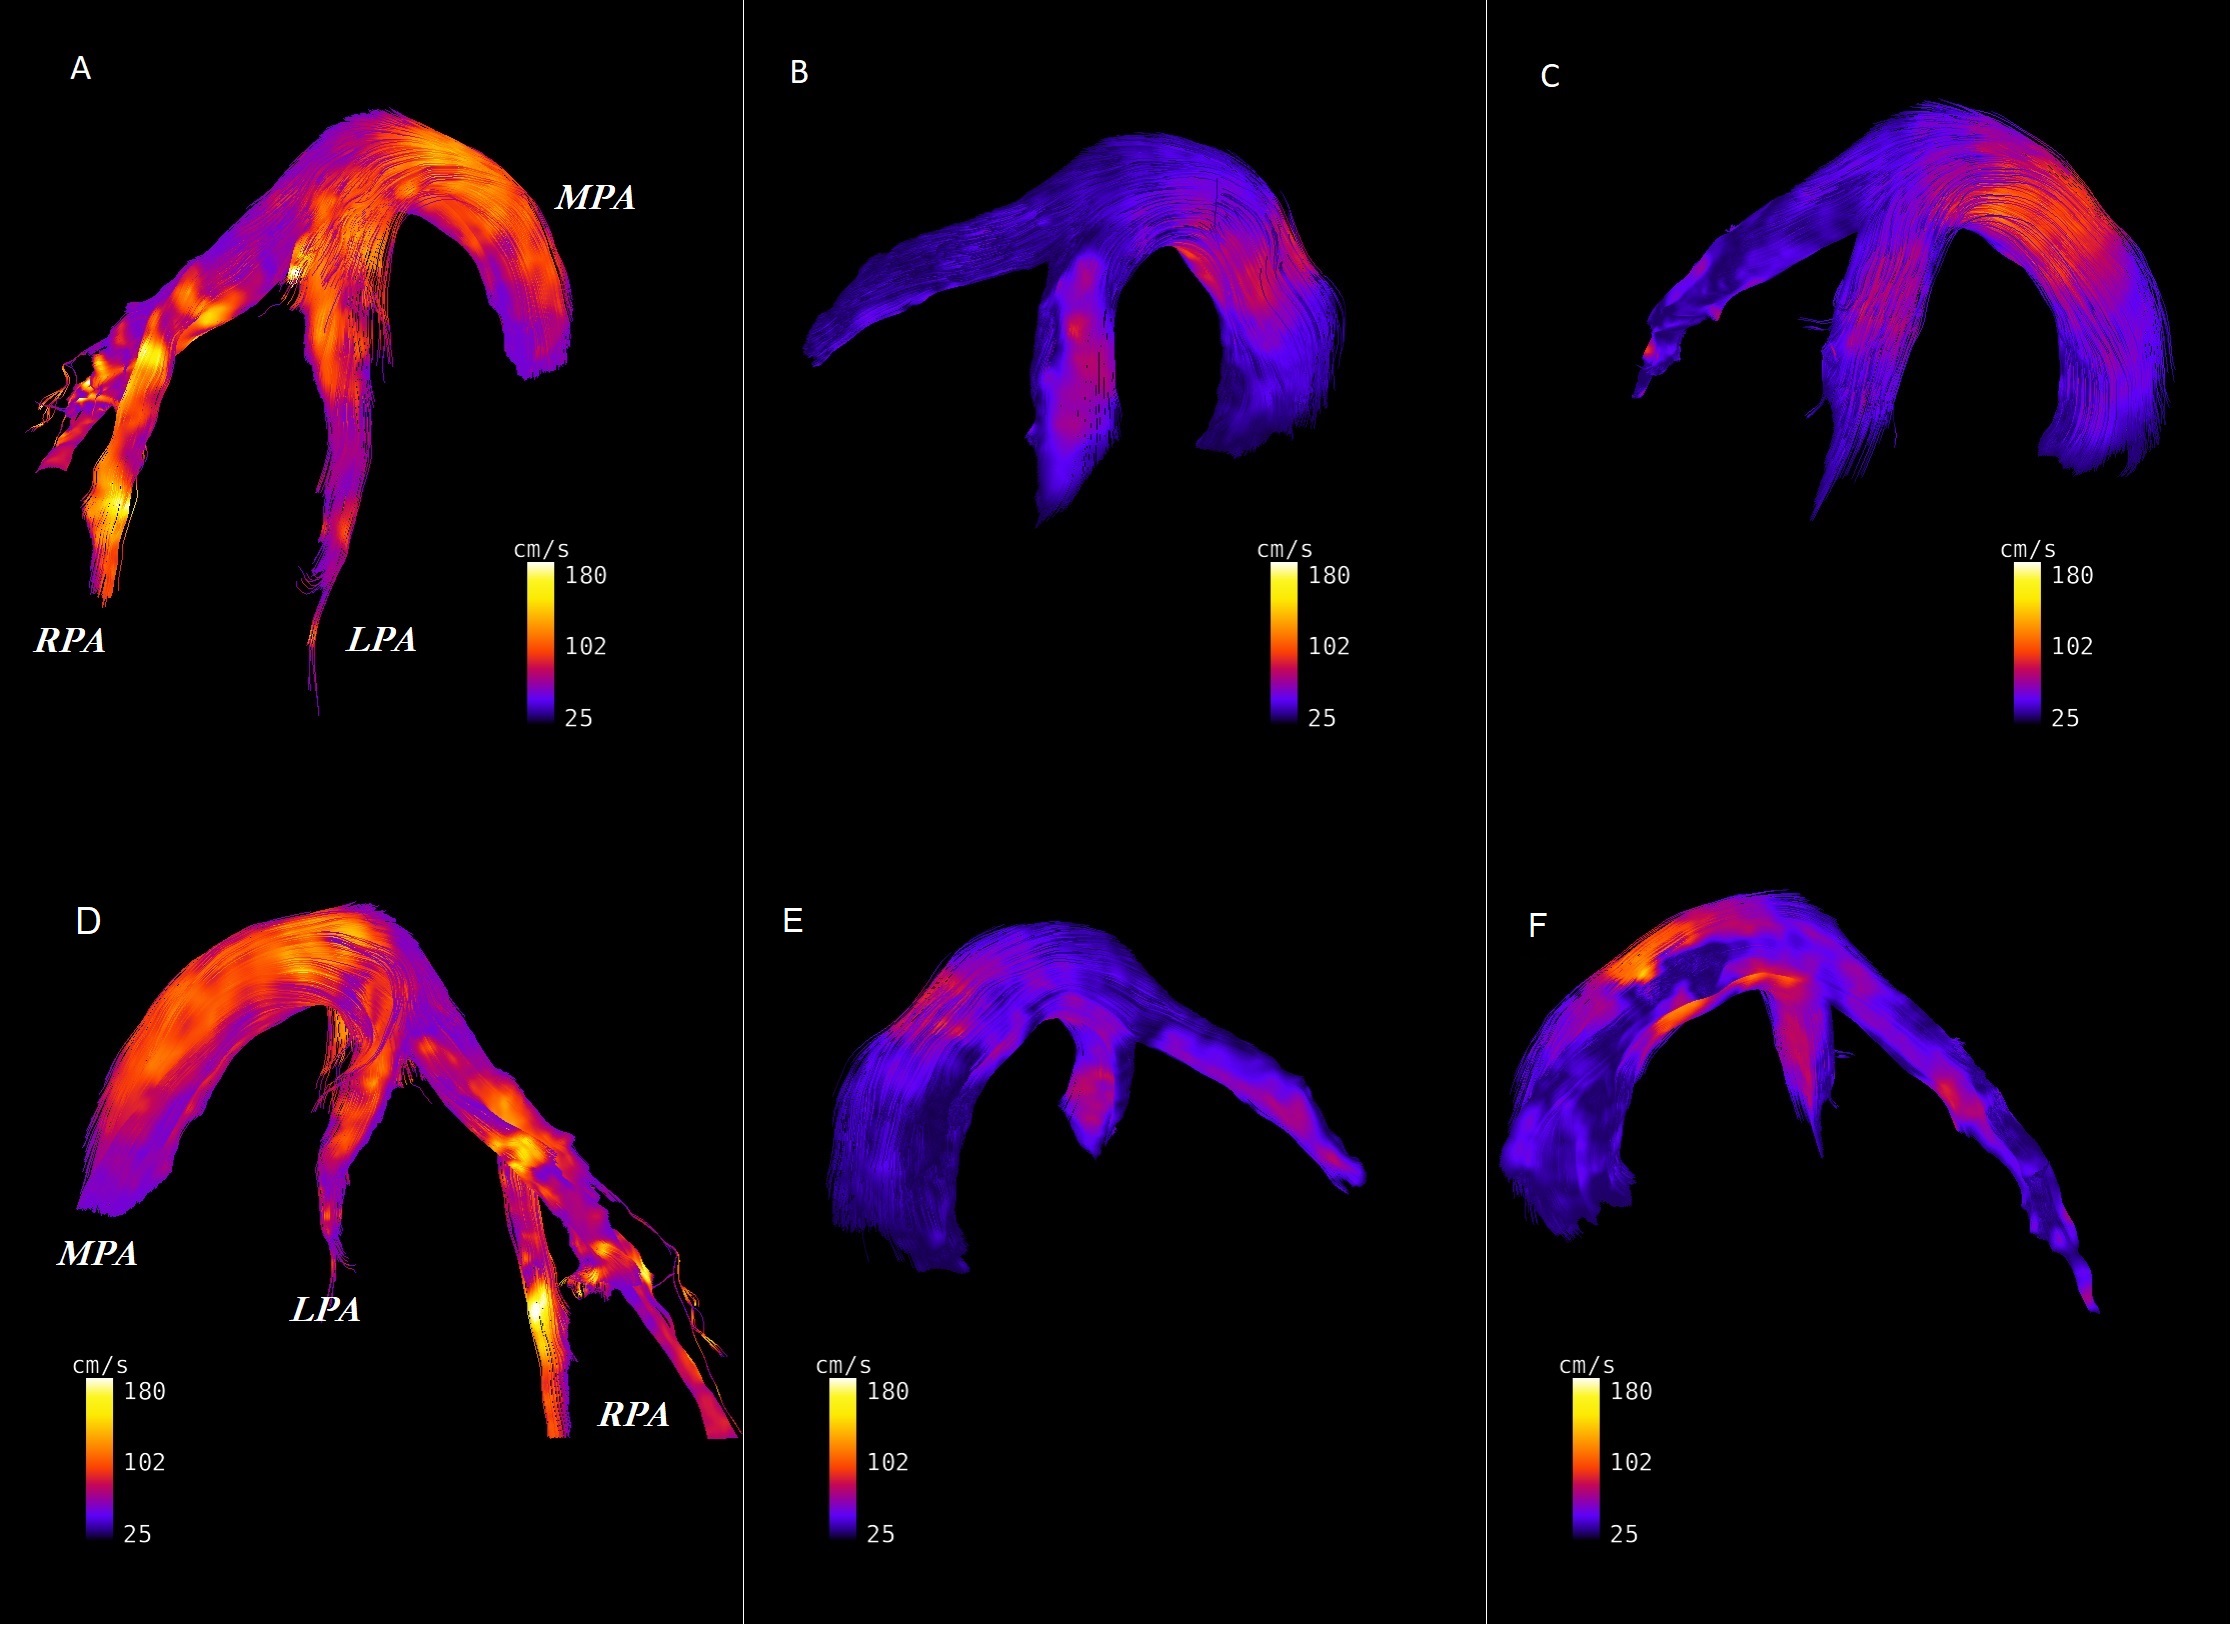
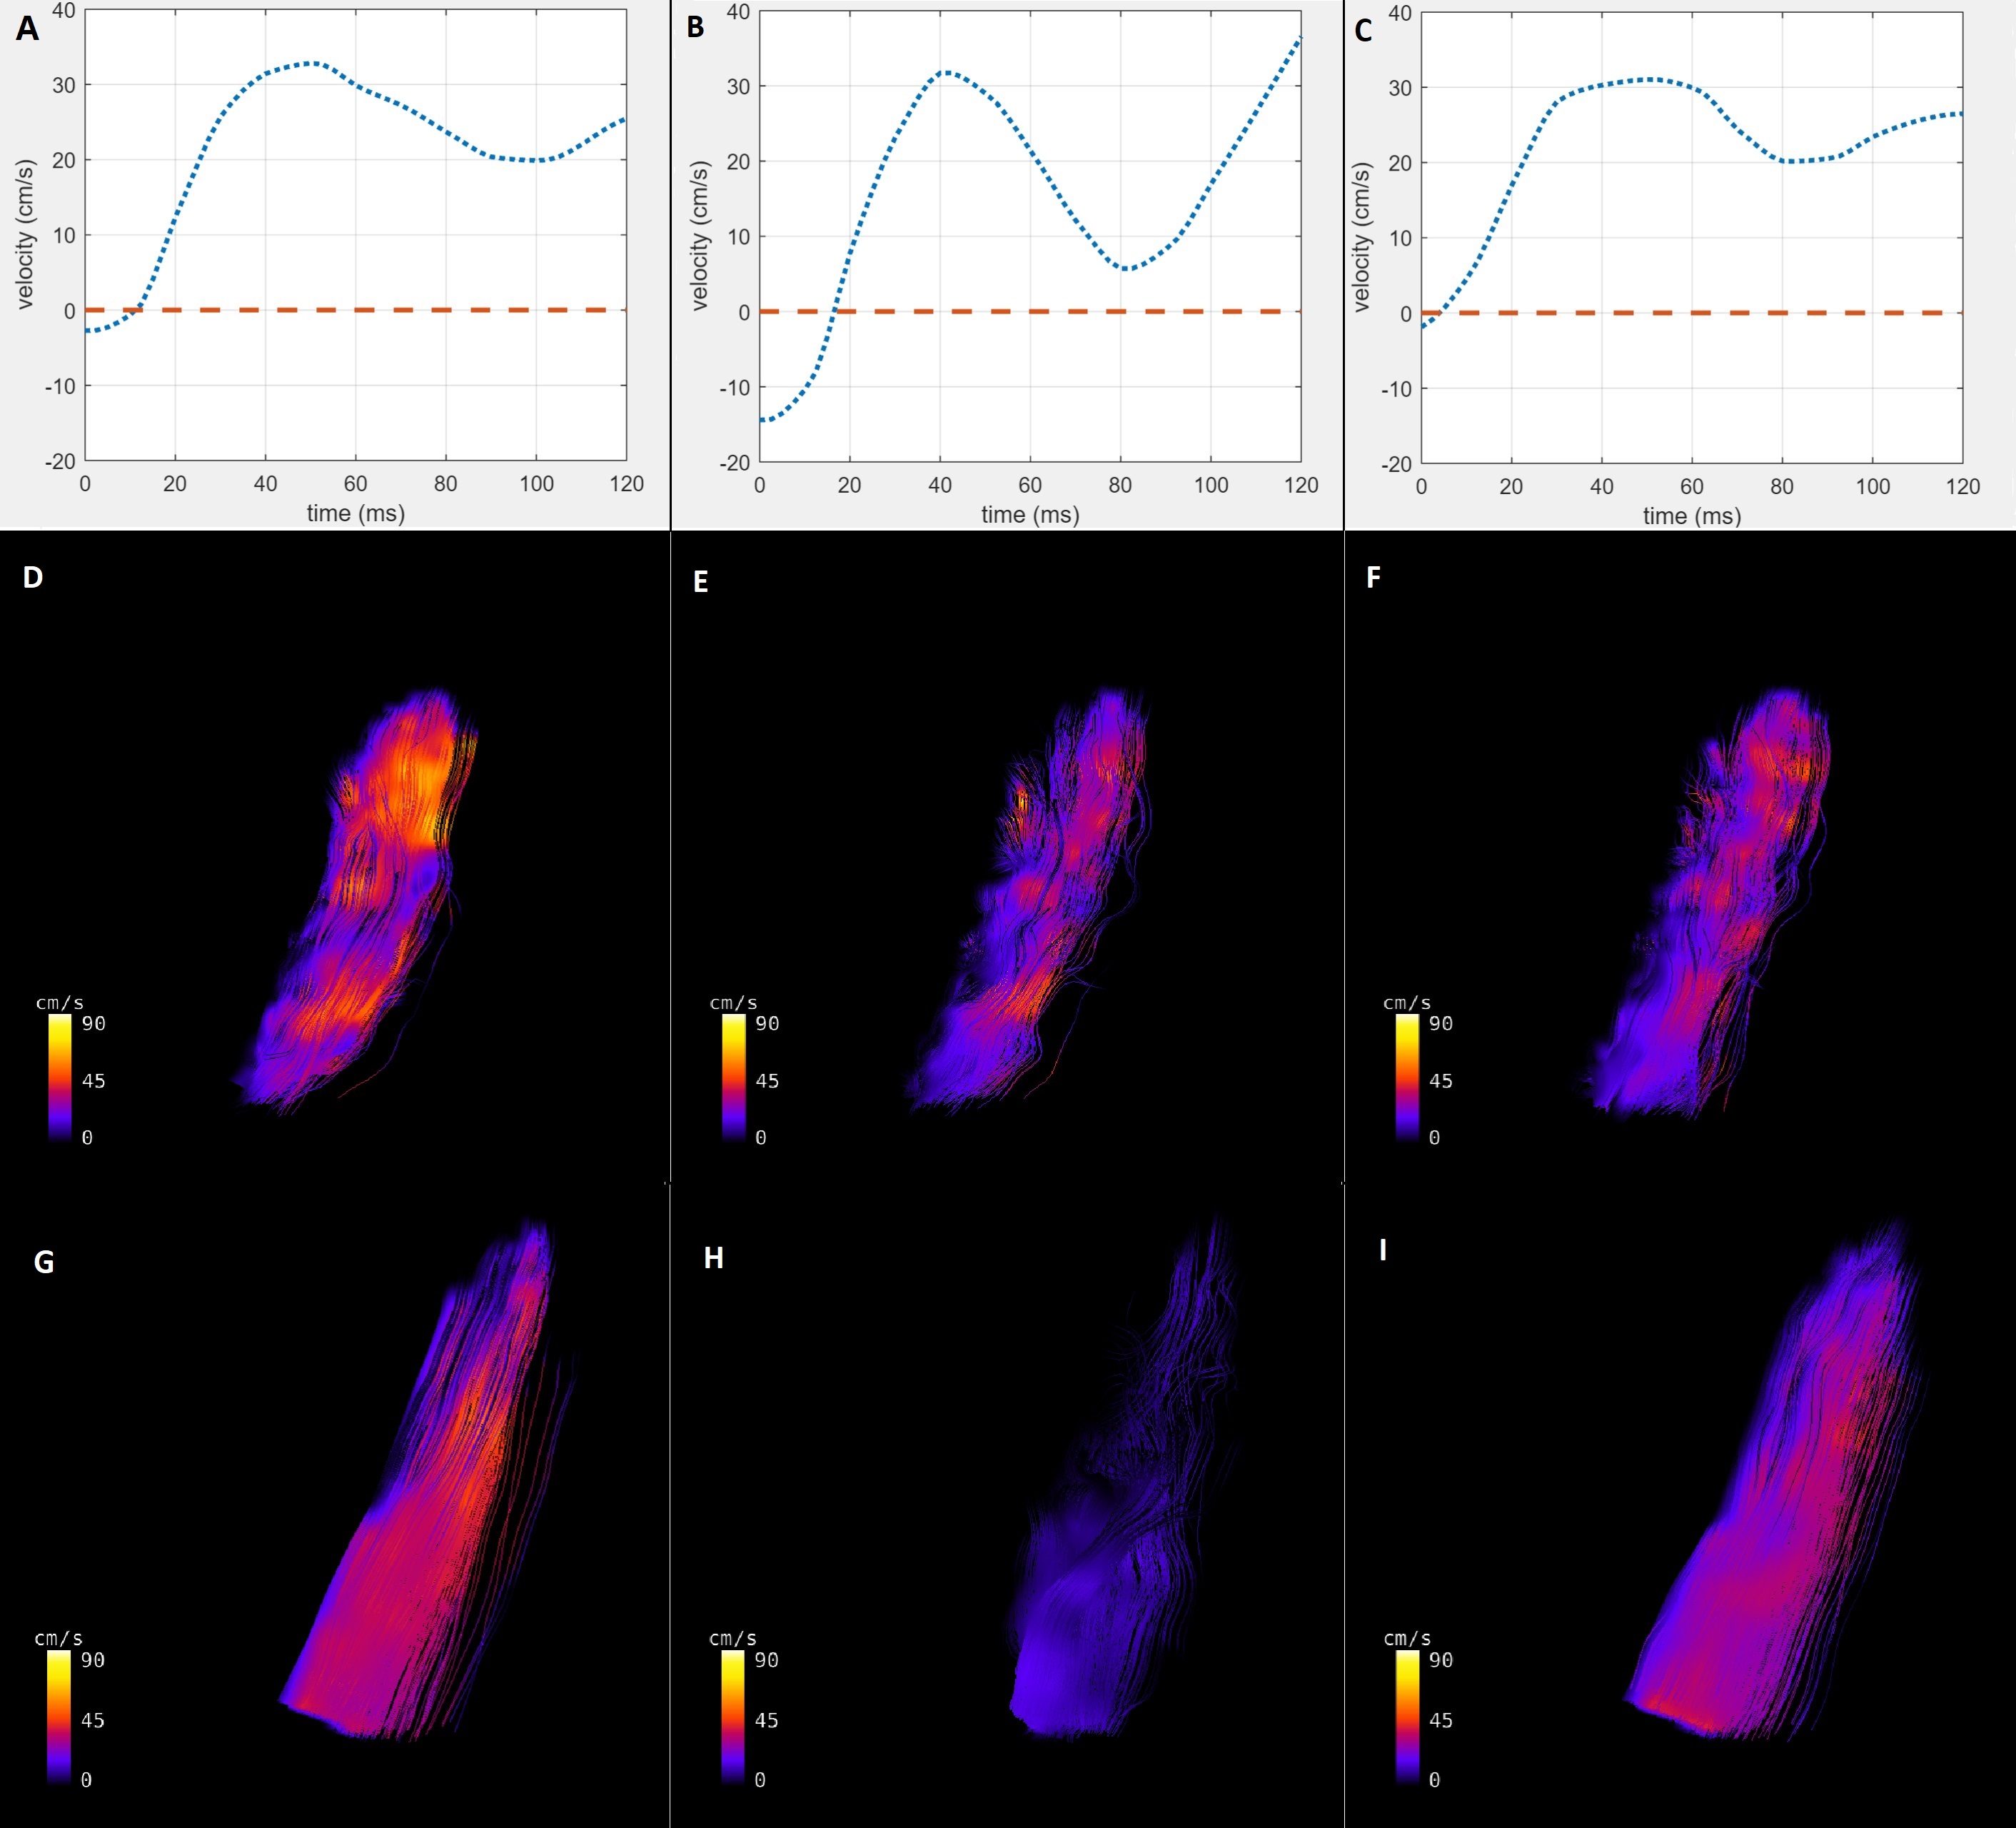
In TTE, animals of the control and diseased group showed significant differences in right ventricular hemodynamic parameters (Fig. 1, p<0.05). In addition, a significantly higher systolic RV pressure was measured in diseased animals by RHC. A list of all PC-MRI parameters demonstrating substantial changes between the three study groups is presented in Table 1. The mean values of blood flow velocity and pressure gradient in pulmonary arteries, veins and bronchial branches were substantially decreased in the diseased group compared to the control and diseased animals having received treatment. The increasing velocity values in the hemodynamic phase contrast streamline patterns obtained for the treated animals clearly demonstrated the reversibility of the positive functional changes in response to Macitentan (Fig. 2). From a qualitative point of view, in both diseased and under-treatment animals the velocity-time (v-t) curves of different pulmonary artery vessels showed a delayed period of time for the velocity to return to its baseline after the initial systolic peak (velocity notch) (Fig. 3). In v-t curves of the inferior vena cava (IVC), a deep drop of velocity was noted only in the diseased animals (Fig. 4).DISCUSSION
It is well known that PAH is associated with arterial intima hyperplasia, media hypertrophy, and adventitial proliferation (a process known as vascular remodeling)5; all of this contributes to vascular resistance to blood flow. The extracted maximum and average-mean blood flow velocities and pressure gradients of the small endpoint arteries (such as the pulmonary artery bronchial branches) were substantially decreased in diseased animals compared to the control and under-treatment groups, suggesting that the hemodynamics of these regions is of potential diagnostic value and is a predictor of maladaptive RV remodeling in PAH. Especially, the observed systematic pressure drop between the pulmonary bronchial branches and pulmonary veins as well as the pressure decrease between the right/left pulmonary arteries and the main pulmonary trunk can be interpreted as an indicator of pulmonary vascular remodeling. In addition, these parameters may be a potential index for distinguishing between reversible and irreversible/fibrotic remodeling of the pulmonary vasculature in a PAH population under treatment. The qualitative assessment of v-t curves may also contribute to the distinction between the control and diseased groups, as the velocity notch may be associated with an increase of pulmonary artery resistance. Besides, the deep drop in v-t curve of IVC may reflect the high pressure at the right atrium due to PAH and RV overload.CONCLUSION
4D-flow PC-MRI is capable to serve as a potential diagnostic and prognostic non-invasive imaging method for the initial evaluation of PAH as it is able to differentiate between the hemodynamics of healthy and diseased populations. In addition, this technique can depict reversible changes secondary to PAH after drug therapy, suggesting that 4D PC velocity mapping is a useful tool for clinical follow-ups.Acknowledgements
No acknowledgement found.References
1. Prins KW, Thenappan T. World Health Organization Group I Pulmonary Hypertension: Epidemiology and Pathophysiology. Cardiol Clin. 2016;34(3):363-74.
2. Galiè N, Humbert M, Vachiery J-L, Gibbs S, Lang I, Torbicki A, et al. 2015 ESC/ERS Guidelines for the diagnosis and treatment of pulmonary hypertension. European Respiratory Journal. 2015;46(4):903.
3. Drake JI, Gomez-Arroyo J, Dumur CI, Kraskauskas D, Natarajan R, Bogaard HJ, et al. Chronic carvedilol treatment partially reverses the right ventricular failure transcriptional profile in experimental pulmonary hypertension. Physiological genomics. 2013;45(12):449-61.
4. Piao L, Fang YH, Parikh KS, Ryan JJ, D'Souza KM, Theccanat T, et al. GRK2-mediated inhibition of adrenergic and dopaminergic signaling in right ventricular hypertrophy: therapeutic implications in pulmonary hypertension. Circulation. 2012;126(24):2859-69.
5. Rich S, Pogoriler J, Husain AN, Toth PT, Gomberg-Maitland M, Archer SL. Long-term effects of epoprostenol on the pulmonary vasculature in idiopathic pulmonary arterial hypertension. Chest. 2010;138(5):1234-9.
Figures