1195
Tracer kinetic modeling of nitroxide-enhanced MRI to quantify oxidative stress in mouse models of heart disease1University of Virginia, Charlottesville, VA, United States
Synopsis
Oxidative stress plays a significant role in the pathogenesis of heart disease. Nitroxide free radicals have been used as redox-sensitive MRI contrast agents where oxidative stress is correlated to the nitroxide-enhanced signal decay rate. We developed a two-compartment exchange and reduction model (2CXRM) to quantify both myocardial nitroxide exchange and reduction and hypothesized that dynamic nitroxide-enhanced MRI can comprehensively assess nitroxide kinetics in mouse models of angiotensin II infusion (ANGII) and myocardial infarction (MI). The 2CXRM detected elevated reduction rates in ANGII and post-MI mice indicative of oxidative stress and reduced nitroxide delivery, consistent with microvascular damage, in post-MI mice.
Introduction
Oxidative stress plays a key mechanistic role in many types of heart disease and is a therapeutic target. Nitroxide stable free radicals can serve as T1-shortening contrast agents that lose the unpaired electron of the oxygen radical and the associated T1-shortening property as they undergo in-vivo reduction reactions with biological compounds (Fig 1A,B). In this way nitroxides are used as redox-sensitive MRI contrast agents where oxidative stress levels are correlated to the decay rate of the nitroxide-enhanced signal (faster signal loss correlates with greater oxidative stress).1-3 However, the signal intensity decay rate does not account for nitroxide exchange between the intravascular and extravascular spaces nor quantify the nitroxide reduction rate. We sought to develop and evaluate a tracer kinetic model to more comprehensively quantify nitroxide kinetics and tissue oxidative stress. A standard two-compartment exchange model (2CXM)4 as previously used for gadolinium-enhanced MRI was modified to include nitroxide reduction in tissue, and the modified model was evaluated experimentally using dynamic nitroxide-enhanced MRI in mouse models of heart disease involving oxidative stress.Theory
A two-compartment exchange and reduction model (2CXRM, Fig. 1C) was developed from a standard 2CXM as shown in Eq. 1, where the addition of the -KRED reduction term represents the difference between the 2CXRM and the 2CXM.(1) dCEV(t)/dt = K1·CA(t) - K2·CEV(t) - KRED
In Eq. 1, CA and CEV are the arterial and extravascular nitroxide concentrations, K1 and K2 are the exchange rates between compartments, and KRED is the nitroxide reduction rate. The solution to Eq. 1 is Eq. 2, where B is a constant:
(2) CEV(t) = K1·[e-K2·t * CA(t)] - KRED·e-K2·t + B
In MRI we measure the signal in tissue, and the tissue nitroxide concentration CT is given by
(3) CT(t) = vA·CA(t) + (1 - vA)·CEV(t)
where vA, the vascular fraction, is estimated to be 0.05.
Methods
Two model systems of cardiac oxidative stress were examined, angiotensin II (ANGII) infusion5 and myocardial infarction (MI).6,7 ANGII is expected to have tissue oxidative stress with normal delivery of contrast agent, whereas MI is expected to show oxidative stress in infarcted tissue regions and slow delivery of contrast agent to infarcted tissue due to severe microvascular damage. The nitroxide contrast agent 3-Carbamoyl-PROXYL (3CP) (Sigma–Aldrich, St. Louis, MO) was chosen because it is water soluble, commercially available, and well tolerated by mice. For the ANGII model, osmotic minipumps (Alzet Model 1002; Durect Corp) loaded with ANGII (n=7) to provide an infusion rate of 0.7 mg/kg body weight per day or saline (n=7) were implanted in male C57Bl/6 mice.8 MRI was performed before and seven days after infusion. For the MI model, male C57Bl/6 mice (n=8) underwent a 40 minute left coronary artery occlusion followed by reperfusion, and MRI was performed at baseline, day 1, and day 21 post-MI.All MRI studies were performed using a 7T system (Clinscan, Bruker). During MRI, mice were anesthetized with 1.25% isoflurane and maintained at 36 ± 0.5°C. Imaging included proton-density weighted MRI and serial T1-weighted MRI performed in a mid-ventricular short-axis slice before and consecutively after 3CP injection for 10 minutes. 3CP (50 mg/mL) was administered through an indwelling tail vein catheter at 2 mmol/kg body weight. Regions of interest (ROIs) of the LV blood pool and myocardium were manually delineated and applied to the nitroxide enhanced images. For MI mice, DENSE MRI9 strain maps were used to define infarcted and remote myocardial ROIs. ROI signal intensity was normalized by proton density signal intensity and converted to 3CP concentration as previously described.10 CA was estimated by least squares fitting of the [3CP] in the LV blood pool to a gamma-variate function combined with an exponential decay function. CT was estimated by nonlinear regression fitting of myocardial ROI [3CP] to the model parameters K1, K2, and KRED in Eqs. 2 and 3. Two-way ANOVAs were used to compare model parameters over time and group.
Results
Figure 2 shows (A) example dynamic nitroxide-enhanced MRI (DNE-MRI) images, (B) an example DENSE strain map to identify remote and infarcted myocardium, and (C) example CA(t) and CT(t) data and 2CXRM fits for infarct and remote regions one day post-MI. Figure 3 summarizes the model parameter results from the ANGII experiment showing a greater KRED in mice post-ANGII compared to controls. Figure 4 summarizes the model parameter data from MI mice showing reduced K1 and K2 values and a greater KRED in infarcted myocardium at day 1 compared to baseline, day 1 remote, and day 21 infarct. Average R2 of CT(t) fits was 0.98 ± 0.02 across all experiments. Figure 5 compares the 2CXRM KRED results to simple signal intensity decay rates (R3CP) and demonstrates that the 2CXRM KRED parameter provides greater distinction between different degrees of oxidative stress.Conclusion and Discussion
A 2CXRM closely describes DNE-MRI kinetics and shows elevated nitroxide reduction rates in ANGII and MI models compared to controls, with greater reduction rates in MI vs ANGII. Reduced delivery of nitroxide to infarcted tissue was measured one day after MI, consistent with the severe microvascular damage that occurs in the setting of MI. These methods may prove useful in preclinical studies aiming to understand mechanisms of and therapies for oxidative stress in heart disease.Acknowledgements
Funding: NIH R01 EB001763References
1. Hyodo, F., Matsumoto, K. I., Matsumoto, A., Mitchell, J. B., & Krishna, M. C. (2006). Probing the intracellular redox status of tumors with magnetic resonance imaging and redox-sensitive contrast agents. Cancer research, 66(20), 9921-9928.
2. Matsumoto, K. I., Hyodo, F., Matsumoto, A., Koretsky, A. P., Sowers, A. L., Mitchell, J. B., & Krishna, M. C. (2006). High-resolution mapping of tumor redox status by magnetic resonance imaging using nitroxides as redox-sensitive contrast agents. Clinical Cancer Research, 12(8), 2455-2462.
3. Shah, S. A., Waters, C. D., Chen, L. J., Roy, R. A., French, B. H., & Epstein, F. undefined. (2019). Dynamic Nitroxide-Enhanced MRI Detects the Development and Decline of Oxidative Stress in Myocardial Infarction. Proceedings from the 22nd Annual SCMR Scientific Sessions, 200–203.
4. Sourbron SP, Buckley DL. Tracer kinetic modelling in MRI: estimating perfusion and capillary permeability. Physics in Medicine & Biology. 2011 Dec 15;57(2):R1.
5. Münzel T, Camici GG, Maack C, Bonetti NR, Fuster V, Kovacic JC. Impact of oxidative stress on the heart and vasculature: part 2 of a 3-part series. Journal of the American College of Cardiology. 2017;70(2):212-29.
6. Sun, Y. (2008). Myocardial repair/remodelling following infarction: roles of local factors. Cardiovascular research, 81(3), 482-490.
7. Yang, F., Liu, Y. H., Yang, X. P., Xu, J., Kapke, A., & Carretero, O. A. (2002). Myocardial infarction and cardiac remodelling in mice. Experimental physiology, 87(5), 547-555.
8. Landmesser, U., Cai, H., Dikalov, S., McCann, L., Hwang, J., Jo, H., ... & Harrison, D. G. (2002). Role of p47 phox in vascular oxidative stress and hypertension caused by angiotensin II. Hypertension, 40(4), 511-515.
9. Kim, D., Gilson, W. D., Kramer, C. M., & Epstein, F. H. (2004). Myocardial tissue tracking with two-dimensional cine displacement-encoded MR imaging: development and initial evaluation. Radiology, 230(3), 862-871.
10. Cernicanu, A. and L. Axel, Theory-based signal calibration with single-point T1 measurements for first-pass quantitative perfusion MRI studies. Acad Radiol, 2006. 13(6): p. 686-93.
Figures
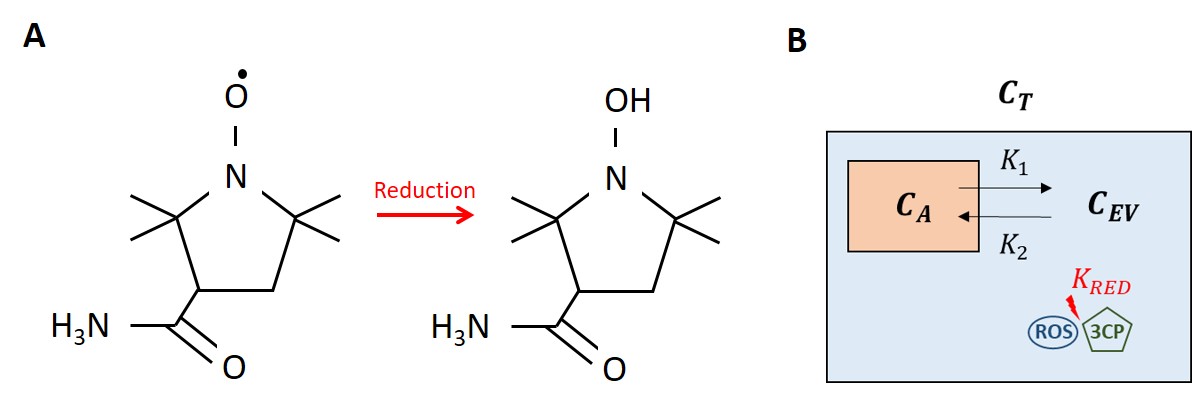
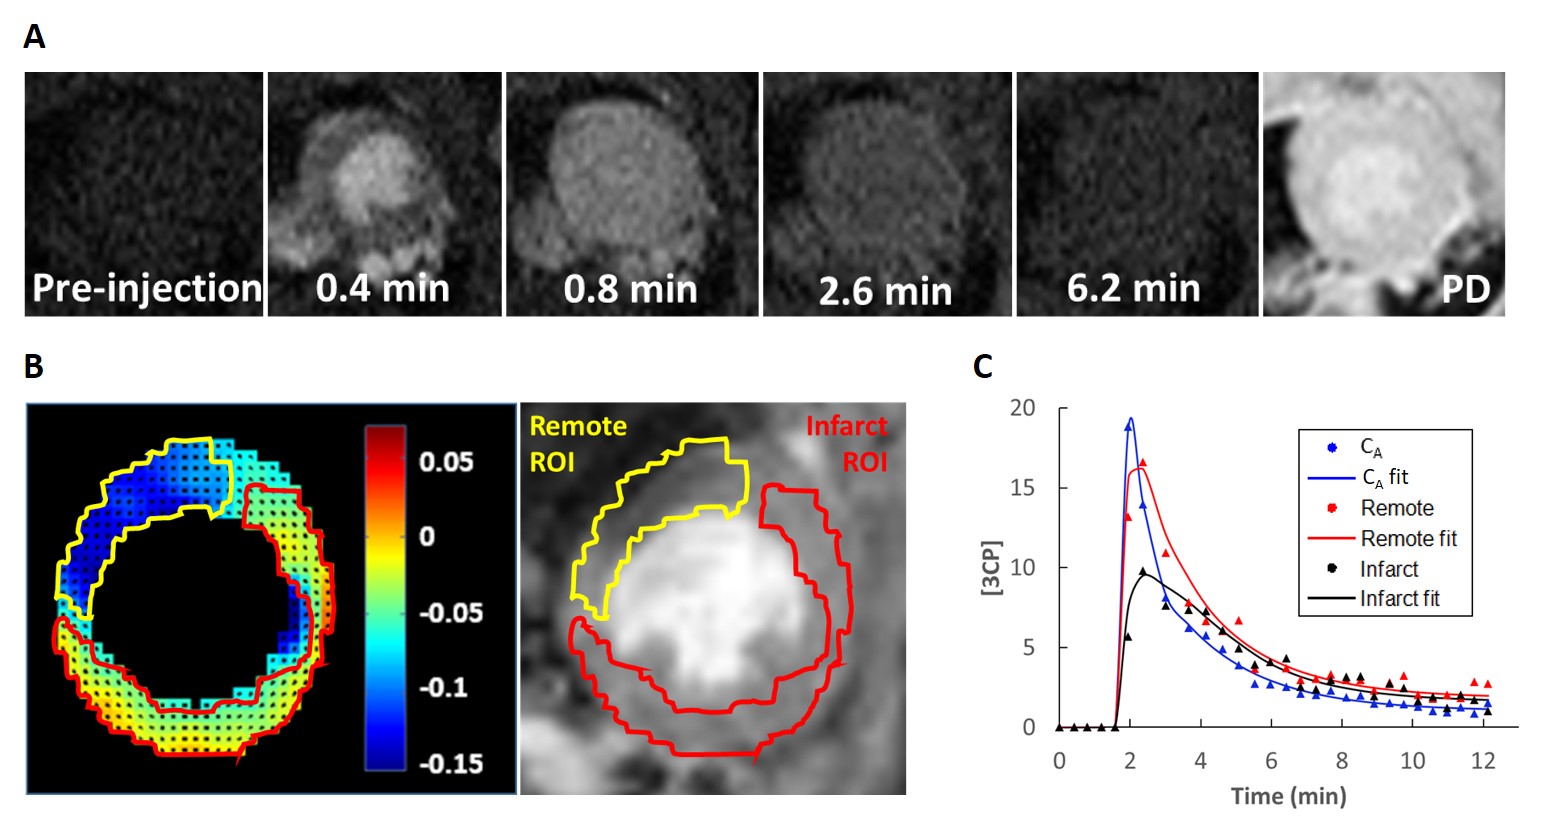
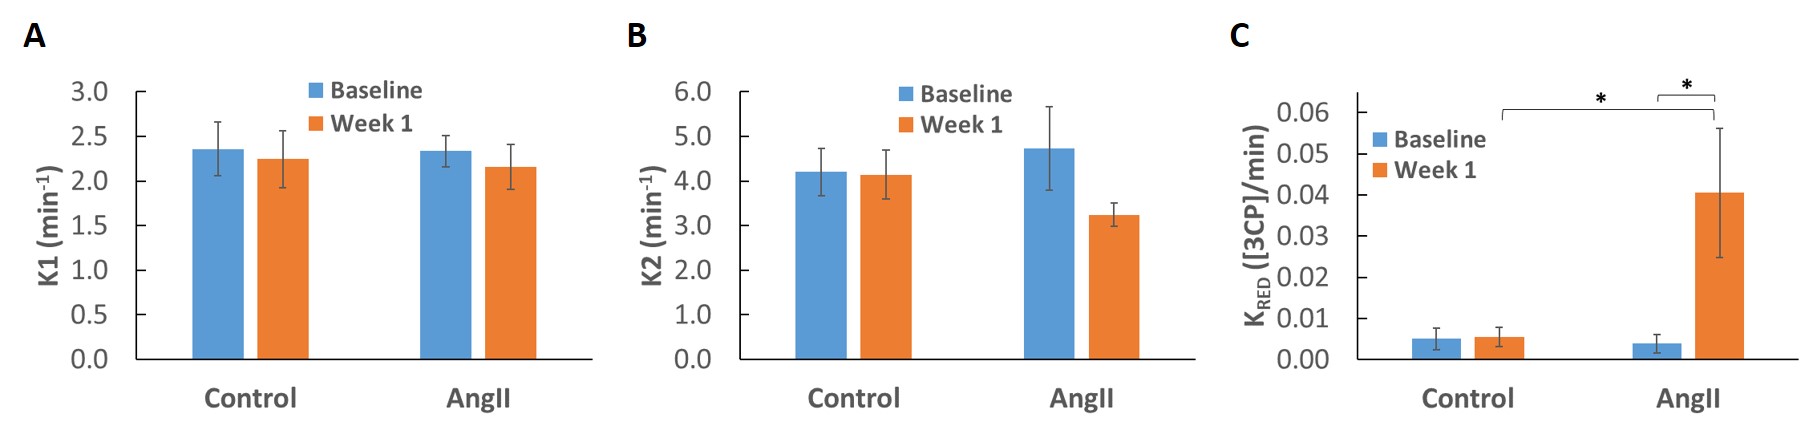
Figure 3. 2CXRM parameter results in mice at baseline and one week post- saline (control) and ANGII infusion. A. K1 for control and ANGII mice at baseline and week 1 are shown. B. K2 for control and ANGII mice at baseline and week 1 are shown. C. KRED for control and ANGII mice at baseline and week 1 show elevated nitroxide reduction after 1 week of ANGII infusion. All values are mean ± SEM.
* p < 0.05
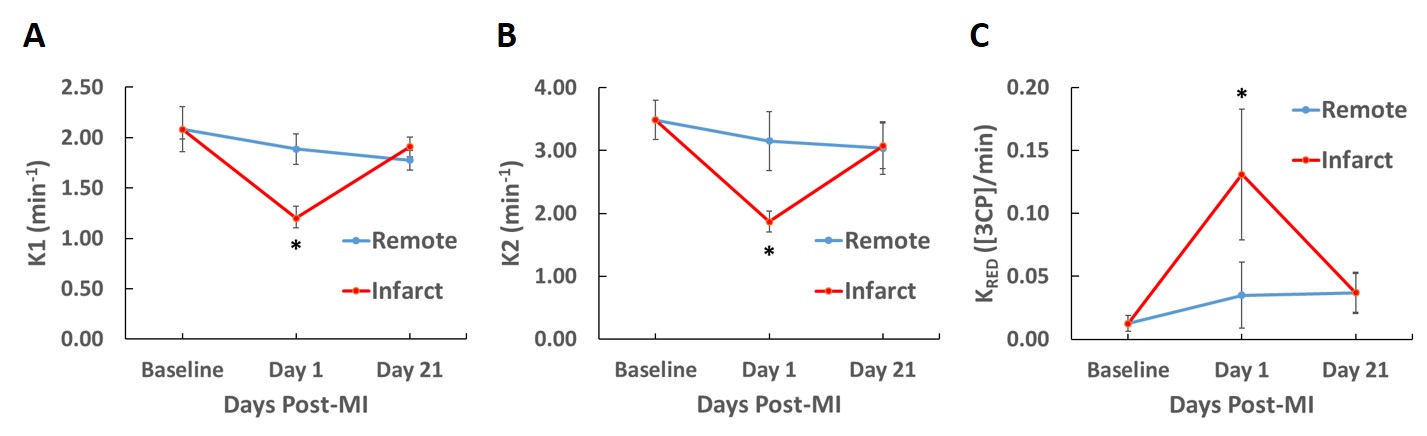
Figure 4. Time course 2CXRM parameter results in mice at baseline, day 1 post-MI, and day 21 post-MI. The 2CXRM shows decreases in K1 (A) and K2 (B) at day 1 post-MI in the infarct ROI. C. An elevated KRED was detected in infarcted myocardium at day 1 post-MI. All values are mean ± SEM.
* p < 0.05 compared to baseline, day 1 remote, and day 21 infarct
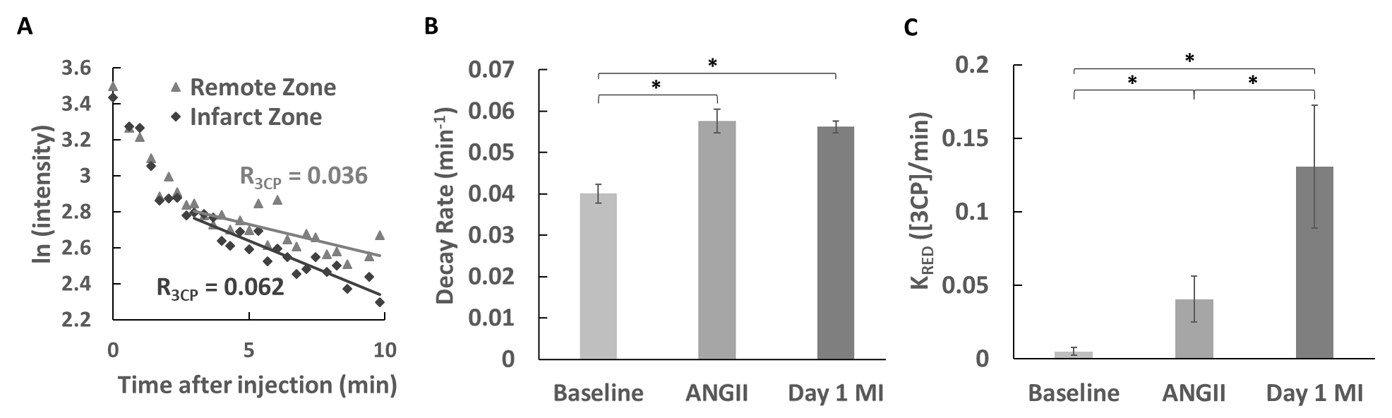
Figure 5. A. Example ln(intensity) vs. time curves of remote and infarct myocardial ROIs for a mouse day 1 post-MI demonstrating the use of the 3CP signal decay rate (R3CP) to evaluate oxidative stress. B. R3CP values of mice at baseline, 7 days post-ANGII infusion, and day 1 post-MI showing similar nitroxide signal decay rates in ANGII infusion and post-MI mice. C. 2CXRM KRED values of mice at baseline, 7 days post-ANGII infusion, and day 1 post-MI showing an approximate three-fold change in nitroxide reduction between ANGII infusion and post-MI mice. All values are mean ± SEM.
* p < 0.05