1194
Human 13C Hybrid-Shot Spiral (HYSS) Imaging of Pathological Cardiac Metabolism Following Myocardial Infarction1Oxford Centre for Clinical Magnetic Resonance Research, Division of Cardiovascular Medicine, Radcliffe Department of Medicine, University of Oxford, Oxford, United Kingdom, 2Department of Physiology, Anatomy & Genetics, University of Oxford, Oxford, United Kingdom, 3Department of Physics, University of Oxford, Oxford, United Kingdom, 4Royal Brompton & Harefield NHS Foundation Trust, Harefield, United Kingdom
Synopsis
This study reports the clinical translation of a hybrid-shot spiral sequence (HYSS) for imaging the diseased heart and spleen. Two subjects with myocardial infarction from coronary artery disease were imaged following administration of hyperpolarized [1-13C]pyruvate. High lactate and bicarbonate signal were seen in the region adjacent to the infarcted zone, with no signal within the infarct. A large splenic lactate signal was observed in a subject with an active systemic inflammatory response post myocardial infarction.
Introduction
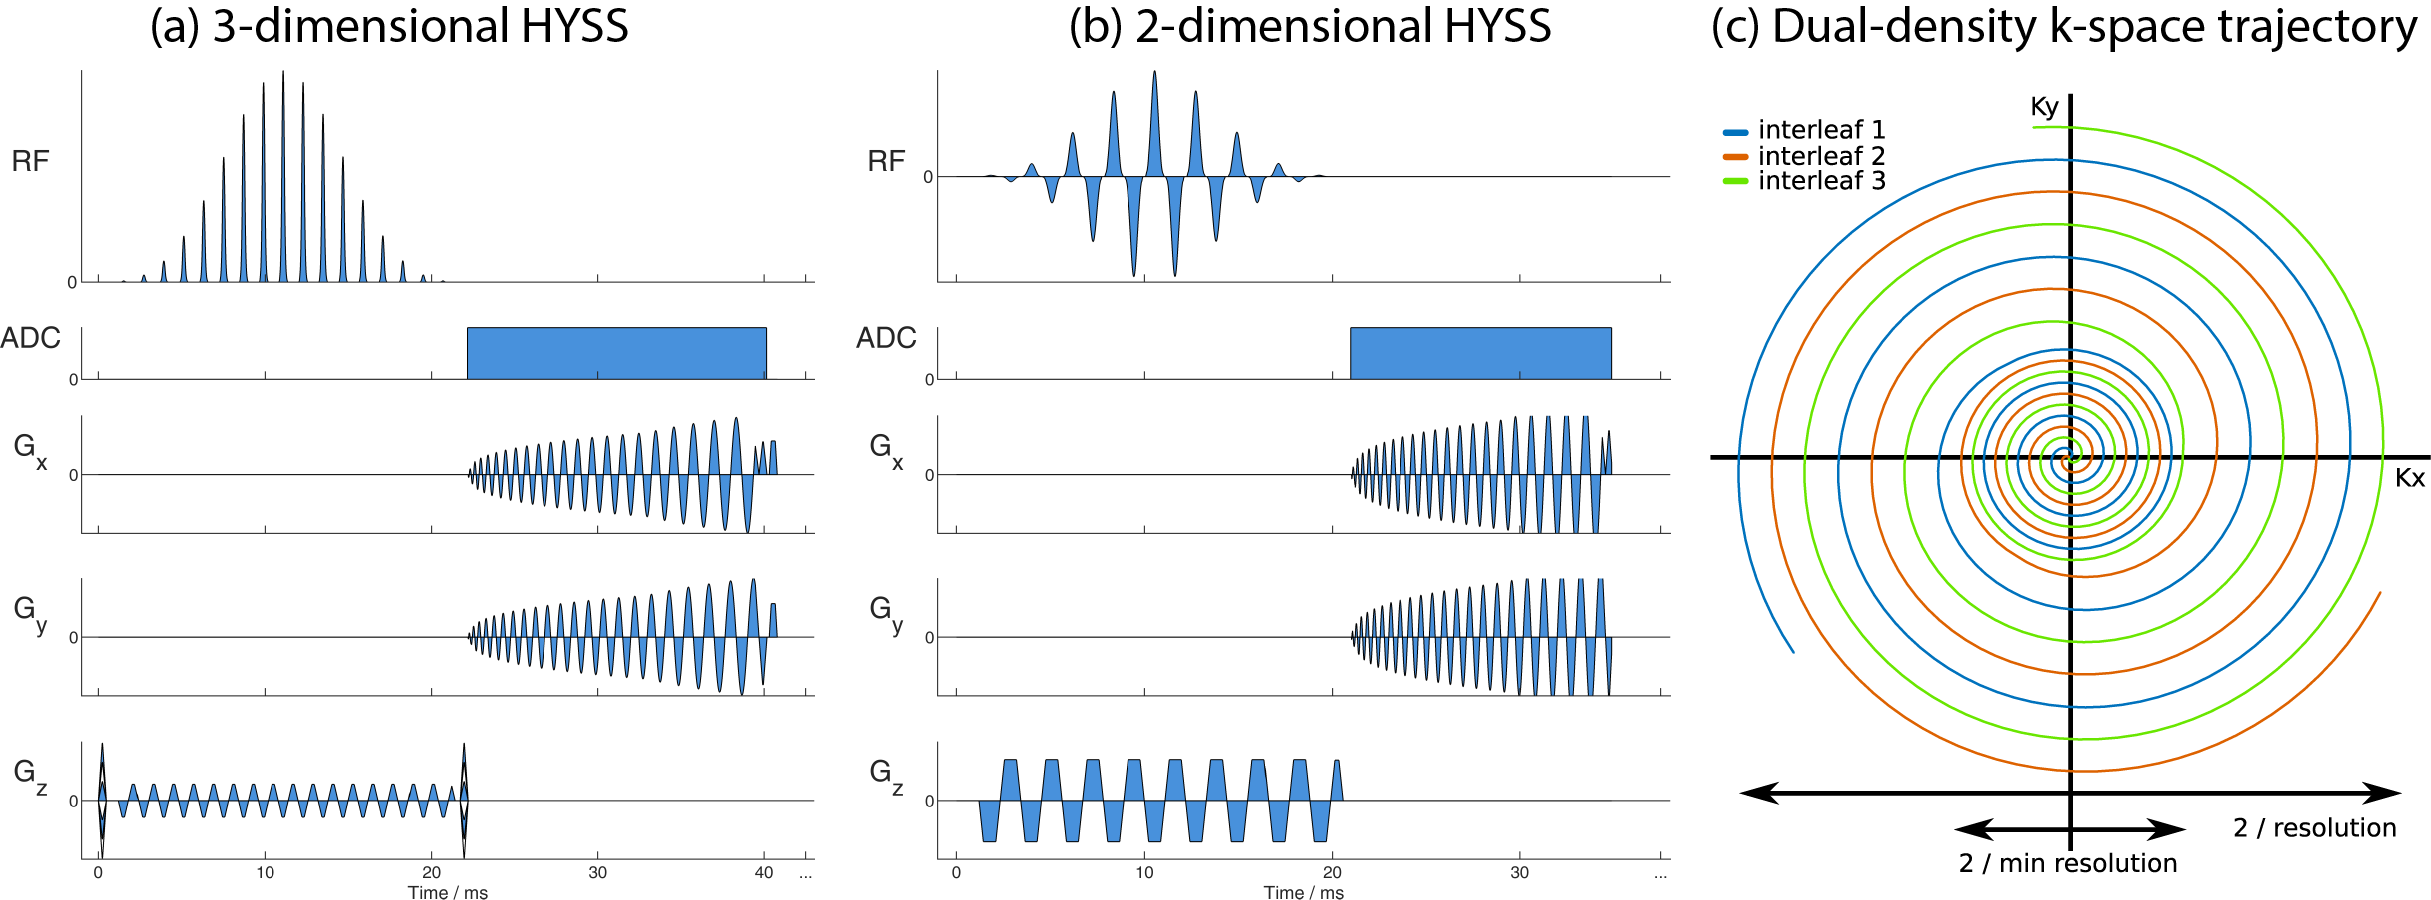
The clinical translation of hyperpolarized 13C cardiac imaging in healthy volunteers [1] has opened the door to imaging the hallmark pathological metabolic changes seen at different stages of human heart disease. A hybrid-shot spiral (HYSS) sequence has been proposed for cardiac 13C imaging [2] whereby a dual-density spiral readout samples the low spatial frequencies at single-shot density, and undersamples outer k-space. By combining N time points of an N-shot HYSS acquisition, spatial resolution can be exchanged for temporal resolution retrospectively at the time of image reconstruction. Clinical translation is here demonstrated in two subjects with coronary artery disease.Methods
The study was approved by the National Research Ethics Committee (17/WM/0200) and conducted in accordance with the declaration of Helsinki and the 5 Caldicott principles. A sterile 250 mM solution of [1-13C]pyruvate was prepared in a SPINlab polarizer (GE Healthcare) and administered intravenously to a dose of 0.1 mmol/kg [3]. Scanning was conducted on a Siemens Tim Trio 3T scanner with a 13C volume transmit 8-channel receive array (Rapid Biomedical).Subject 1 presented late, following a large anterior ST segment elevation myocardial infarction, deemed non-viable by conventional late enhancement MR. A cardiac-gated 3-dimensional 3-shot implementation of HYSS (Figure 1a) was used to encode a 384 × 384 × 120 mm3 volume with nominal 6 mm in-plane resolution (12 mm single-shot inner spiral) with 3 excitations per heartbeat using a flyback spectral-spatial pulse for nominal flip angles of 6° on pyruvate and 30° on lactate and bicarbonate (12 excitations per volume). A breath hold was started at 22 seconds from injection for as long as possible followed by shallow breathing until 18 volumes were acquired.
Subject 2 was awaiting coronary artery bypass grafting to the left anterior descending artery to restore function to a hypokinetic anterior wall, deemed viable during CMR scanning. Past medical history included extensive non-viable septal myocardial infarction. Imaging was performed with a cardiac-gated 2-dimensional 3-shot implementation of HYSS (Figure 1b) encoding 3 short-axis slices (basal, mid, apical) of 20 mm thickness per heartbeat with nominal 10 mm in-plane resolution (20 mm single-shot inner spiral). Excitation with a dualband spectral-spatial pulse was interleaved per stack of slices with nominal flip angles of 12° for pyruvate and 60° for bicarbonate and lactate. Imaging was performed over two breath-holds of 18 R-R intervals each with approximately 10 seconds in between.
Results
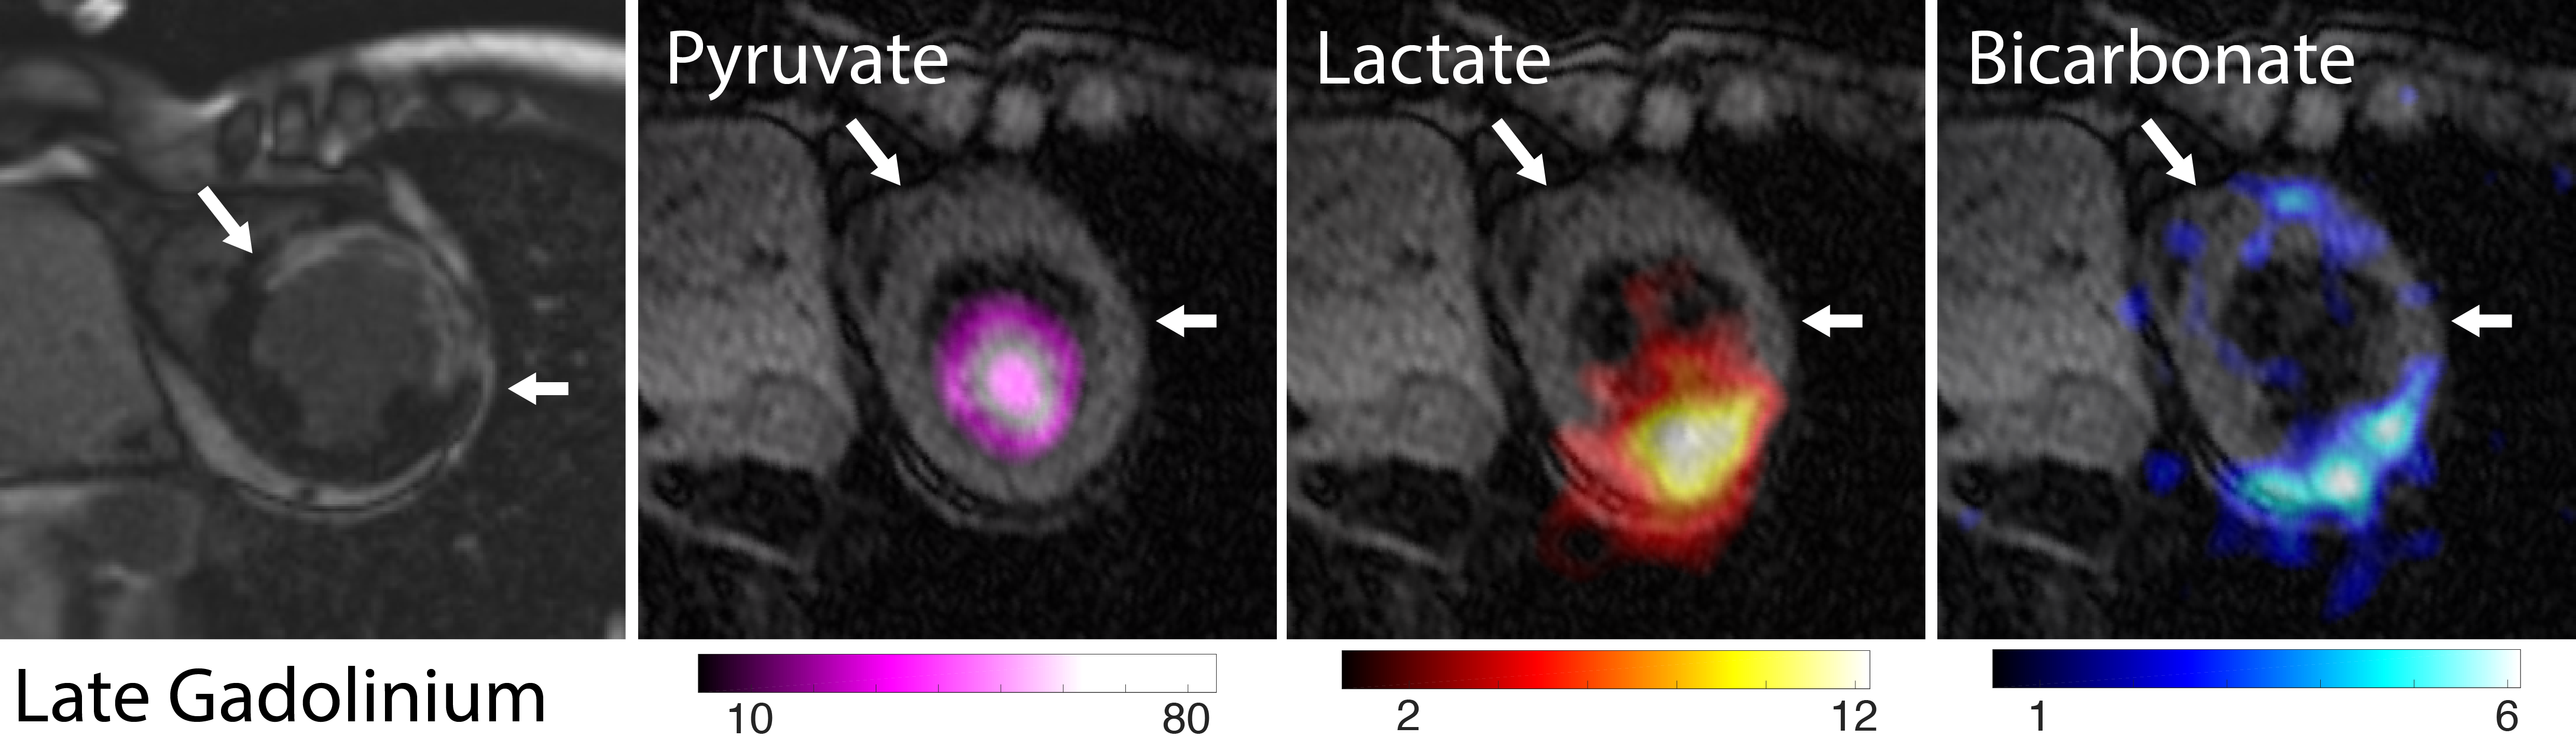
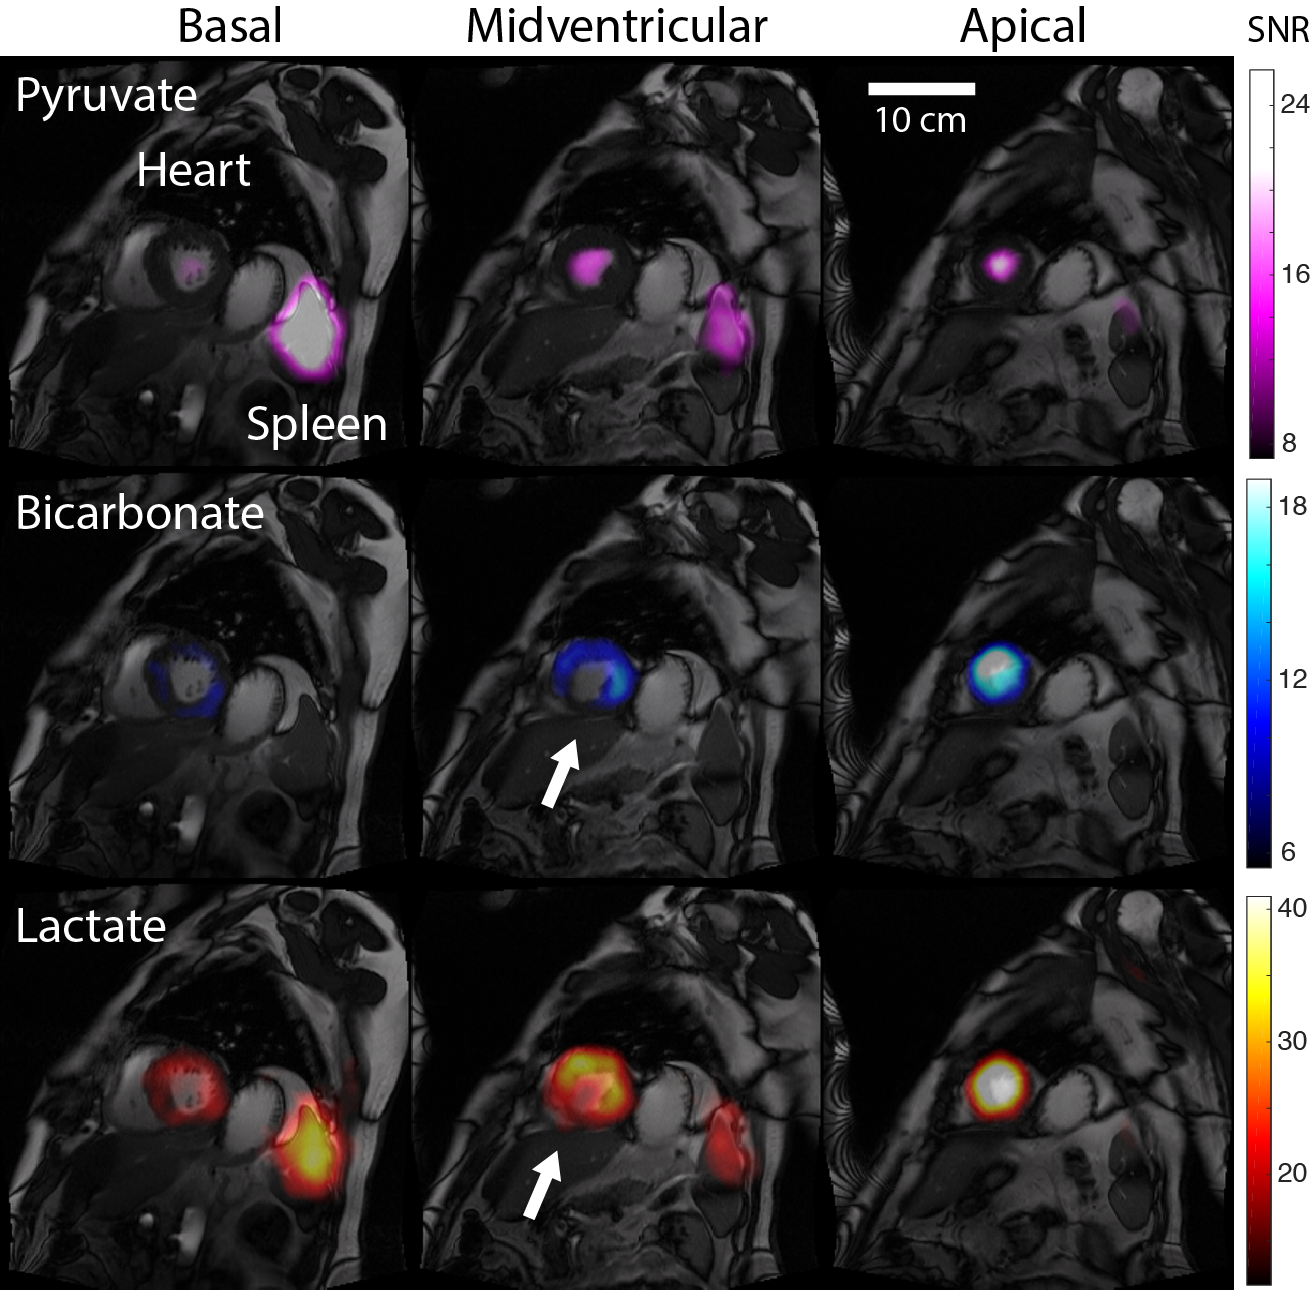
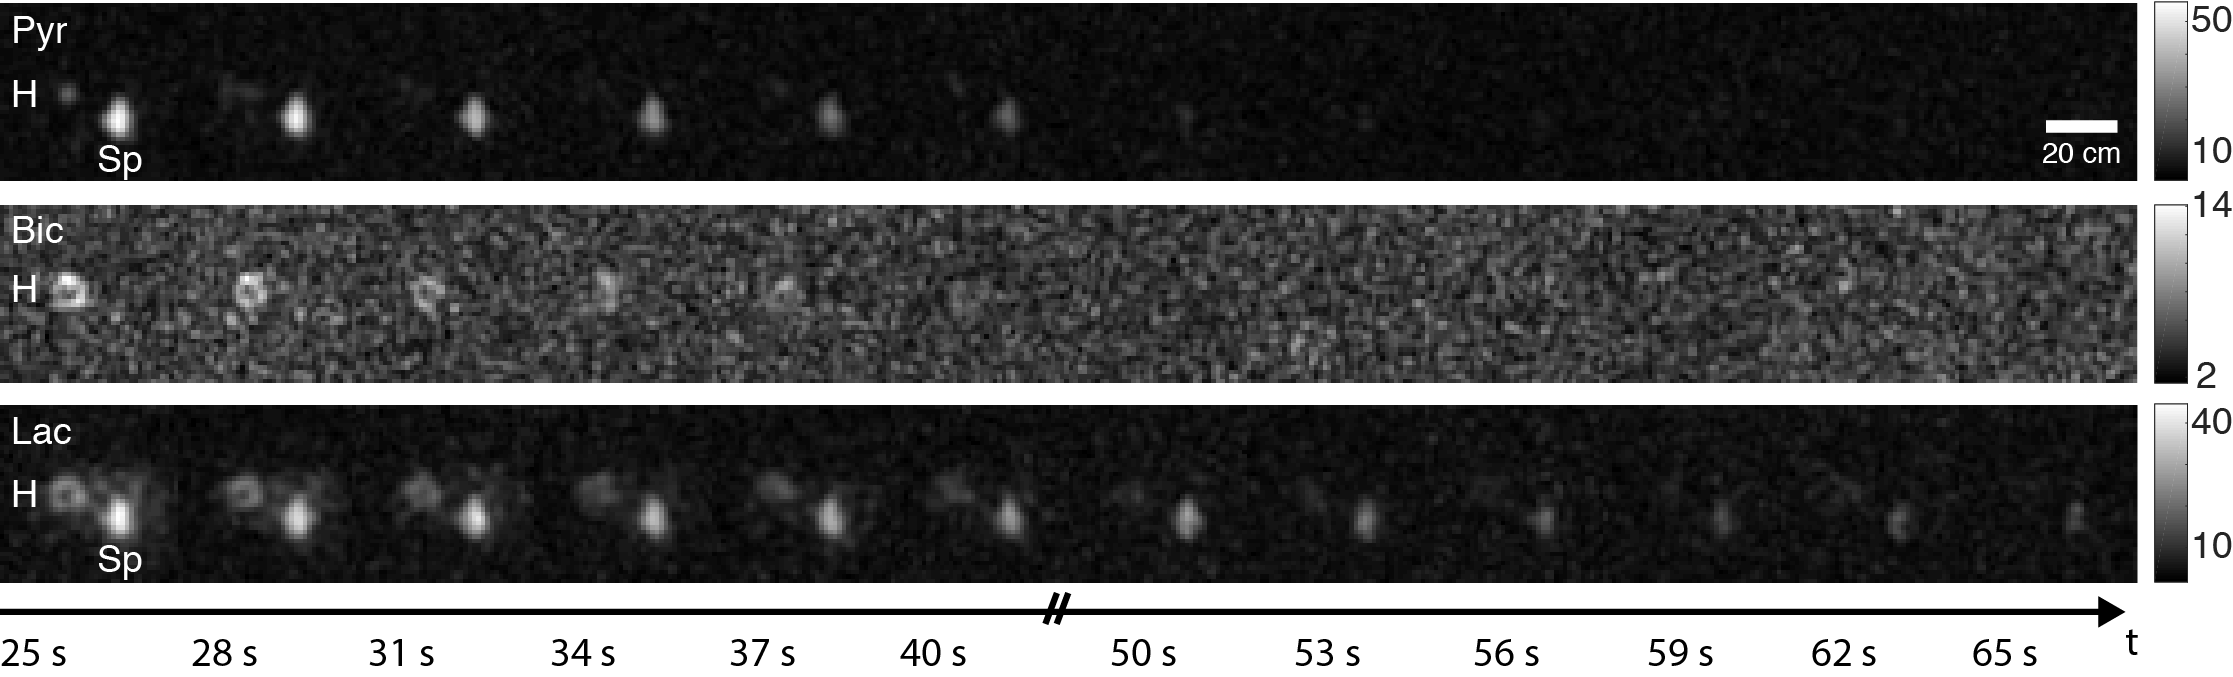
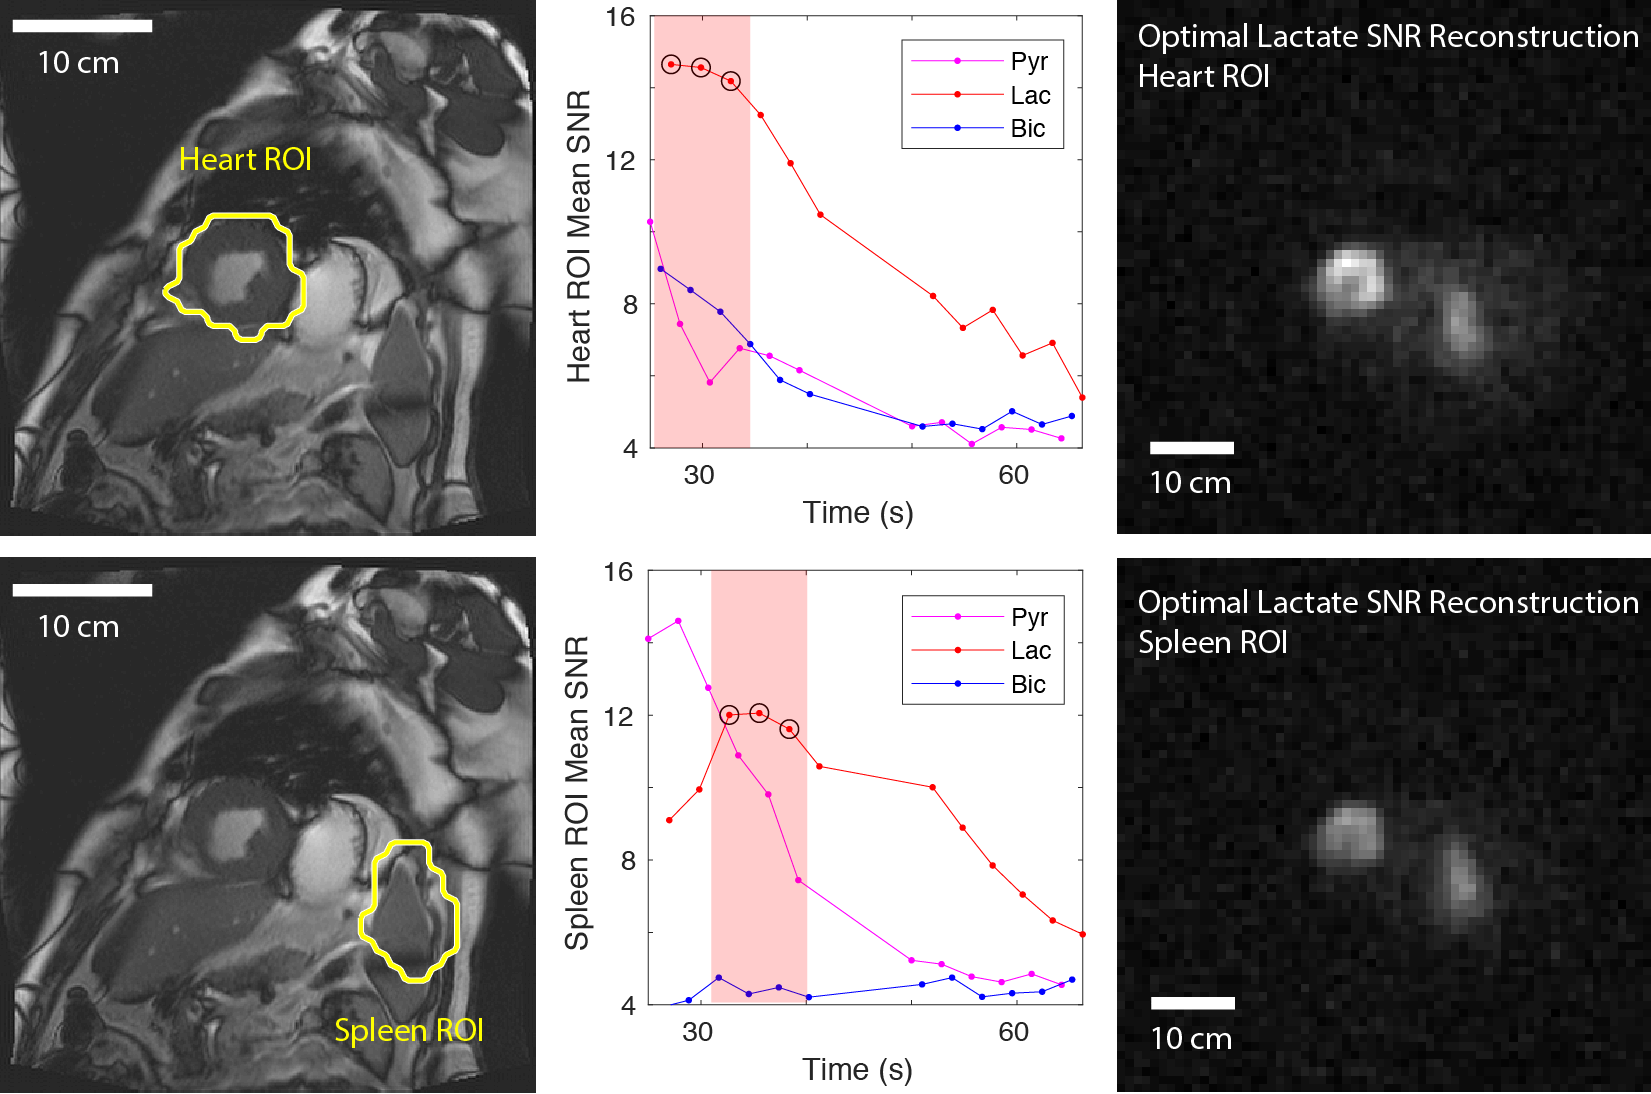
In Subject 1, high lactate and bicarbonate signals were observed in the region adjacent to the infarcted zone (determined by late gadolinium enhancement, Figure 2) within which they were absent. Similarly, lactate and bicarbonate images of Subject 2 exhibited a region of lower signal in the midventricular slice (Figure 3) corresponding to transmural myocardial infarction, but preserved signal intensity in the anterior (sub-endocardially infarcted) myocardium. Interestingly, in this patient there was intense pyruvate and lactate signals in the spleen. A time course of low spatial resolution images (Figure 4) showed lactate signal in the spleen beyond 65 seconds post injection. Regions of interest (ROI) containing the heart and spleen were generated by thresholding the low spatial resolution total carbon image. The mean pyruvate, lactate, and bicarbonate SNR in each ROI were plotted as functions of time to select the three time points with highest SNR for adaptive spatiotemporal reconstruction of high spatial resolution lactate images for each ROI (Figure 5).Discussion
A greater degree of temporal blurring can be appreciated in the images from 3D HYSS (Subject 1) compared to those from 2D HYSS (Patient 2). In the 3D implementation, each volume consists of 12 phase encodes, with 3 phase encodes per heartbeat. Therefore, 4 heartbeats are required to acquire each low spatial resolution volume, and a total of 12 heartbeats are needed for a 3-shot high spatial resolution reconstruction. In contrast, only 3 heartbeats are required to reconstruct a high spatial resolution slice using 2D HYSS, and each low spatial resolution image is single-shot. The results suggest that 2D HYSS may be more robust for time-sensitive applications such as cardiac imaging, whereas 3D HYSS may be well suited where large flip angles are not achievable due to hardware limitations.To the authors’ knowledge, this is the first report of pyruvate and lactate signal in the human spleen. Previous reports have linked the high lactate signal in the region adjacent to acutely injured myocardium to an inflammatory response [4], which has been corroborated with other imaging modalities including nuclear medicine [5]. The spleen acts as a reservoir of monocytes prior to deployment to the injured heart [6]. These results suggest that hyperpolarized 13C imaging may be a powerful way to monitor the systemic inflammatory response following an acute myocardial injury.
Conclusion
Using a 13C HYSS imaging sequence, we demonstrated for the first time in the human heart the various pathological metabolic changes associated with coronary artery disease. Imaging such changes may have diagnostic clinical implications pertaining to cardiac revascularization decision making, given the potential to metabolically define both myocardial ischaemia and viability. We also observed, for the very first time, a large splenic lactate signal in a patient with an active systemic inflammatory response post myocardial infarction.Acknowledgements
The authors would like to acknowledge the following sources of funding: NIHR Oxford Biomedical Research Centre (JYCL), British Heart Foundation in the form of clinical research training, intermediate clinical research, and senior research fellowships (AA: FS/17/18/32449, AJML: RE/08/004/23915, OJR: FS/14/54/30946, DJT: FS/14/17/30634), Novo Nordisk Postdoctoral Fellowship (JJJJM), Engineering and Physical Sciences Research Council (AT), and Medical Research Council (AT: EP/L016052/1, LAJY).
References
[1] Cunningham CH, Lau JY, Chen AP, Geraghty BJ, Perks WJ, Roifman I, Wright GA, Connelly KA. Hyperpolarized 13C metabolic MRI of the human heart: initial experience. Circulation Research. 119(11):1177-82 (2016).
[2] Tyler A, Lau J, Ball V, Timm K, Zhou T, Tyler D, Miller JJ. A 3D Hybrid-Shot Spiral for Hyperpolarized 13C Imaging (3D-HYSS). Proceedings of the International Society for Magnetic Resonance in Medicine. 27: 4287 (2019).
[3] Nelson SJ, Kurhanewicz J, Vigneron DB, Larson PE, Harzstark AL, Ferrone M, Van Criekinge M, Chang JW, Bok R, Park I, Reed G, Carvajal L, Small EJ, Munster P, Weinberg VK, Ardenkjær-Larsen JH, Chen AP, Hurd RE, Odegardstuen L-I, Robb FJ, Tropp J, Murray JA. Metabolic imaging of patients with prostate cancer using hyperpolarized [1-13C] pyruvate. Science Translational Medicine. 5(198):198ra108- (2013).
[4] Lewis AJ, Miller JJ, Lau AZ, Curtis MK, Rider OJ, Choudhury RP, Neubauer S, Cunningham CH, Carr CA, Tyler DJ. Noninvasive immunometabolic cardiac inflammation imaging using hyperpolarized magnetic resonance. Circulation Research. 122(8):1084-93 (2018).
[5] Lee WW, Marinelli B, Van Der Laan AM, Sena BF, Gorbatov R, Leuschner F, Dutta P, Iwamoto Y, Ueno T, Begieneman MP, Niessen HW. PET/MRI of inflammation in myocardial infarction. Journal of the American College of Cardiology. 59(2):153-63 (2012).
[6] Swirski FK, Nahrendorf M, Etzrodt M, Wildgruber M, Cortez-Retamozo V, Panizzi P, Figueiredo JL, Kohler RH, Chudnovskiy A, Waterman P, Aikawa E. Identification of splenic reservoir monocytes and their deployment to inflammatory sites. Science. 325(5940):612-6 (2009).
Figures