1193
Predicting tumor aggressiveness in papillary thyroid cancers using multiparametric quantitative imaging metrics
Ramesh Paudyal1, Jung Hun Oh1, Vaios Hatzoglou2, Andre L. Moreira 3, Ashok shaha4, R. Michael Tuttle5, and Amita Shukla-Dave1,2
1Medical Physics, Memorial Sloan Kettering Cancer Center, New York, NY, United States, 2Radiology, Memorial Sloan Kettering Cancer Center, New York, NY, United States, 3Pathology, NYU Langone Medical Center, New York, NY, United States, 4Surgery, Memorial Sloan Kettering Cancer Center, New York, NY, United States, 5Medicine, Memorial Sloan Kettering Cancer Center, New, NY, United States
1Medical Physics, Memorial Sloan Kettering Cancer Center, New York, NY, United States, 2Radiology, Memorial Sloan Kettering Cancer Center, New York, NY, United States, 3Pathology, NYU Langone Medical Center, New York, NY, United States, 4Surgery, Memorial Sloan Kettering Cancer Center, New York, NY, United States, 5Medicine, Memorial Sloan Kettering Cancer Center, New, NY, United States
Synopsis
Accurate risk stratification and predicting tumor aggressiveness is critically important for the management of papillary thyroid cancer. The results from the present study predict tumor aggressiveness in papillary thyroid cancer using noninvasive multi-parametric MRI (i.e. non-Gaussian intravoxel incoherent motion (NG-IVIM) diffusion weighted (DW) and dynamic contrast-enhanced (DCE)-MRI). The surrogate biomarkers of tumor vascularity (Ktrans) and tumor cellularity (D) were negatively correlated. The kurtosis coefficient (K) reflecting tissue microstructure showed a moderate and significant correlation with the contrast agent leakage space (ve). DWI and DCE-MRI derived metrics can predict tumor aggressiveness in PTC.
Purpose
Accurate risk stratification and predicting tumor aggressiveness is critically important for the management of thyroid cancer1. Diffusion-weighted (DW) and T1 weighted dynamic contrast-enhanced (DCE) MRI have been used for the assessment of thyroid nodules, especially for the differentiation of benign and malignant tumors 2,3. The apparent diffusion coefficient (ADC) has emerged as a surrogate marker to assess tumor aggressiveness in papillary thyroid cancer (PTC) 4. Measurements of non-Gaussian diffusion from the extended-intravoxel incoherent motion model (NG-IVIM) can provide additional information on tumor tissue microstructure in PTC5, 6. NG-IVIM DWI and extended Tofts pharmacokinetic model (ETM) provide the surrogate biomarkers of tumor vascularity and cellularity, respectively, and have shown promise to assess the tumor aggressiveness in PTC 6,7. The aim of the present study is to predict tumor aggressiveness based on histopathology in PTC using multiparametric quantitative metrics derived from the NG-IVIM and ETM models.Materials and Methods
Patients: Our institutional review board approved this prospective study. Twelve patients (median age: 40 years, Male/Female: 5/7) with biopsy-proven PTC underwent pretreatment MRI studies before surgery on a GE 3T scanner with a 24-channel neurovascular phased-array coil. DWI and DCE-MRI followed the anatomical T1/T2-weighted acquisitions. The surgical tumor specimen obtained from patients who underwent surgery after the MRI was reviewed by an experienced pathologist to characterize the degree of tumor aggressiveness of the following histopathologic features: tall cell variant, necrosis, vascular and/or tumor capsular invasion, extrathyroidal extension (ETE), regional metastases, and distant metastases4.DW-MRI data acquisition: Multi-b value DW-MRI acquisitions were performed using a SS-EPI sequence (TR = 4000 ms, TE = 80 ms [minimum], and 3 orthogonal directions) with b values of 0, 20, 50, 80, 200, 300, 500, 800, 1000, 1500 s/mm2, 4-8 slices of 5 mm thickness covering the whole tumor, FOV=20~24 cm, and acquisition matrix =128 × 128.
DCE-MRI data acquisition: DCE data were acquired using a 3D spoiled gradient recalled echo pulse sequence.The dynamic series was acquired before, during, and after administration of the contrast agent (CA) with the FA= 150 using the following MR parameters: matrix size = 256 x128, FOV = 18-22 cm, TR/TE = 5.7/1.7 ms, phases = 50, NEX=1, slices=4-8, slice thickness=5 mm, and flip angle (FA)= 150. A total of 50 dynamic volumes were acquired in ≤5 minutes with a temporal resolution of ≤5.8 seconds per image. The CA was injected by antecubital vein catheters with a bolus of 0.1 mmol/kg and rate of 2 cc/s followed by a saline flush. The pre-contrast T1 (T10) acquisition was performed using the above-mentioned MR parameters at multiple FA of 5°, 15°, and 30°.
ROI Analysis: The tumor regions of interest (ROIs) were contoured by an experienced neuroradiologist using ImageJ on b=0 s/mm2 and later phases of DWI and T1w DCE images, respectively. For voxel-wise analysis, signal intensity vs. b-value data was fitted by the monoexponential model, to calculate ADC and for the NG-IVIM model, which provides estimates of true diffusion coefficient (D), pseudo-diffusion coefficient ( D*), perfusion fraction (f), and kurtosis coefficient (K). An arterial input function was extracted from the carotid artery in an individual al patient. For the DCE data, the tissue CA- time course was fitted with the ETM, which estimates volume transfer constant of a CA (Ktrans [min-1]), volume fractions of the extravascular extracellular space [EES] (ve) and blood plasma space (vp)7. The image processing and parametric map generation were performed with in house software (MRI-QAMPER)8. All comparable metrics with and without features of tumor aggressiveness in PTC patients were compared using the Wilcoxon signed rank test. A Spearman correlation (ρ) was performed to examine the relationship between all comparable parameters obtained with the NG-IVIM DWI and ETM. A p-value of <0.05 was considered statistically significant.
Results
Table 1 exhibits DWI (ADC and NG-IVIM), and DCE-MRI pharmacokinetic model (ETM)- derived quantitative metrics mean values between with and without tumor aggressiveness for PTCs. The mean ADC, D, Ktrans, and ve values were significantly different between the tumors with vs.without aggressiveness feature in PTC patients (P<0.05). D*, f, K, and vp showed a trend towards the difference (P>0.05). Table 2 reports the Spearman correlation (ρ) results between the DWI and DCE derived metrics. There was a significant positive relationship between ve and K (ρ=0.59, P=0.048). D and ve showed a moderate positive correlation towards a significant (ρ=0.60, P=0.10). vp and f showed a moderately significant correlation (r=0.60, P=0.04). Ktrans and D were negatively correlated (ρ=-.67, P=0.02). Figures 1 and 2 are the representative scatter plots for quantitative metrics derived from the NG-IVIM and DCE MRI.Figure 3 shows the representative DWI and DCE-MRI derived parametric maps.Discussion
PTCs with high Ktrans and low D metric values relate to increased cell proliferation and cell density and decreased water diffusivity. Additionally, the increased mean value of K in aggressive tumors might reflect a higher degree of complexity in tissue microstructure. The volume fraction of the blood plasma space, vp, and perfusion fraction, f were surrogate markers of tumor vascularity.Conclusion
These findings suggest that multi-parametric MRI is a useful noninvasive test for the assessment of tumor aggressiveness in PTC.Acknowledgements
Supported by NIH grants R21CA176660‐01A1References
1. Haugen BR, Alexander EK, Bible KC, et al. 2015 American Thyroid Association Management Guidelines for Adult Patients with Thyroid Nodules and Differentiated Thyroid Cancer: The American Thyroid Association Guidelines Task Force on Thyroid Nodules and Differentiated Thyroid Cancer. Thyroid. 2016;26(1):1-133. 2. Razek AA, Sadek AG, Kombar OR, Elmahdy TE, Nada N. Role of apparent diffusion coefficient values in differentiation between malignant and benign solitary thyroid nodules. AJNR Am J Neuroradiol. 2008;29(3):563-568. 3. Sasaki M, Sumi M, Kaneko K, Ishimaru K, Takahashi H, Nakamura T. Multiparametric MR imaging for differentiating between benign and malignant thyroid nodules: initial experience in 23 patients. J Magn Reson Imaging. 2013;38(1):64-71. 4. Lu Y, Moreira AL, Hatzoglou V, et al. Using diffusion-weighted MRI to predict aggressive histological features in papillary thyroid carcinoma: a novel tool for pre-operative risk stratification in thyroid cancer. Thyroid. 2015;25(6):672-680. 5. Lu Y, Jansen JF, Mazaheri Y, Stambuk HE, Koutcher JA, Shukla-Dave A. Extension of the intravoxel incoherent motion model to non-gaussian diffusion in head and neck cancer. J Magn Reson Imaging. 2012;36(5):1088-1096. 6. Nunez DA, Lu Y, Paudyal R, et al. Quantitative Non-Gaussian Intravoxel Incoherent Motion Diffusion-Weighted Imaging Metrics and Surgical Pathology for Stratifying Tumor Aggressiveness in Papillary Thyroid Carcinomas. Tomography. 2019;5(1):26-35. 7. Paudyal R, Lu Y, Hatzoglou V, et al. Dynamic contrast‐enhanced MRI model selection for predicting tumor aggressiveness in papillary thyroid cancers. NMR Biomed. 2019. 8. Paudyal R, Konar AS, Obuchowski NA, et al. Repeatability of Quantitative Diffusion-Weighted Imaging Metrics in Phantoms, Head-and-Neck and Thyroid Cancers: Preliminary Findings. Tomography. 2019;5(1):15-25.Figures
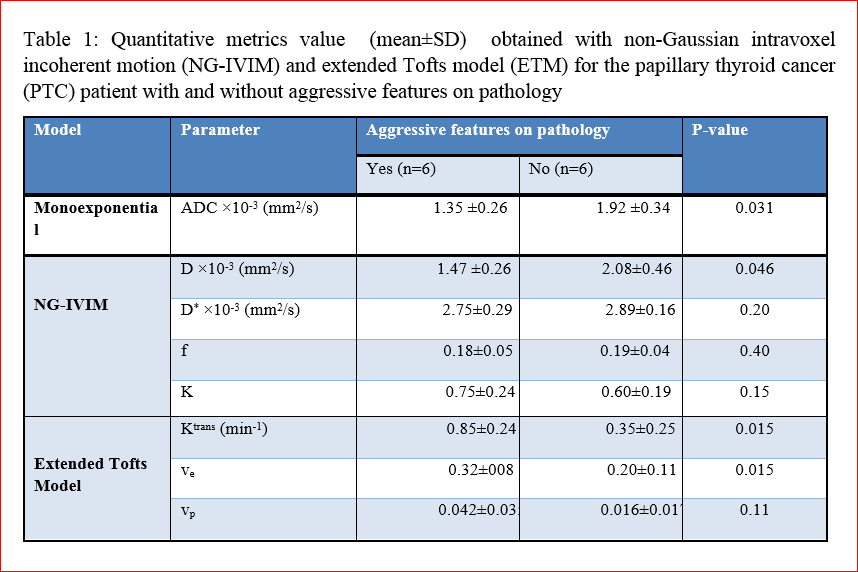
Table1
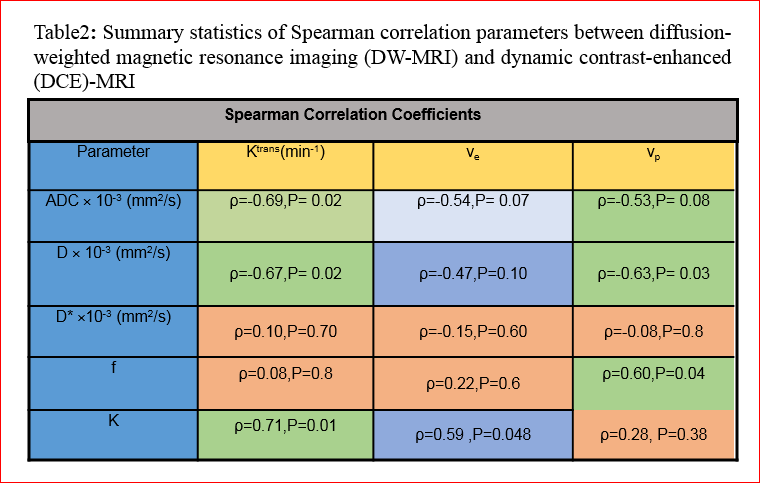
Table 2
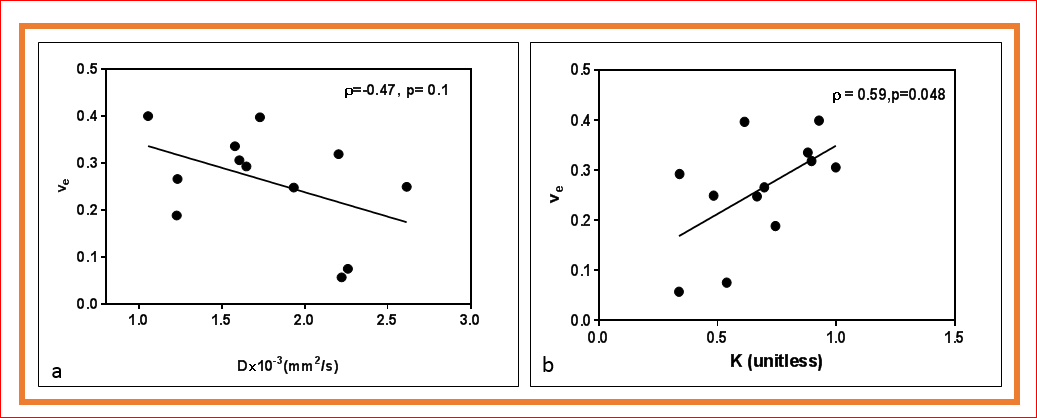
Figure
1.(a) A. Scatter plot of the mean ve
values versus the mean D values. (b). Scatter plot between the mean ve
and K values.
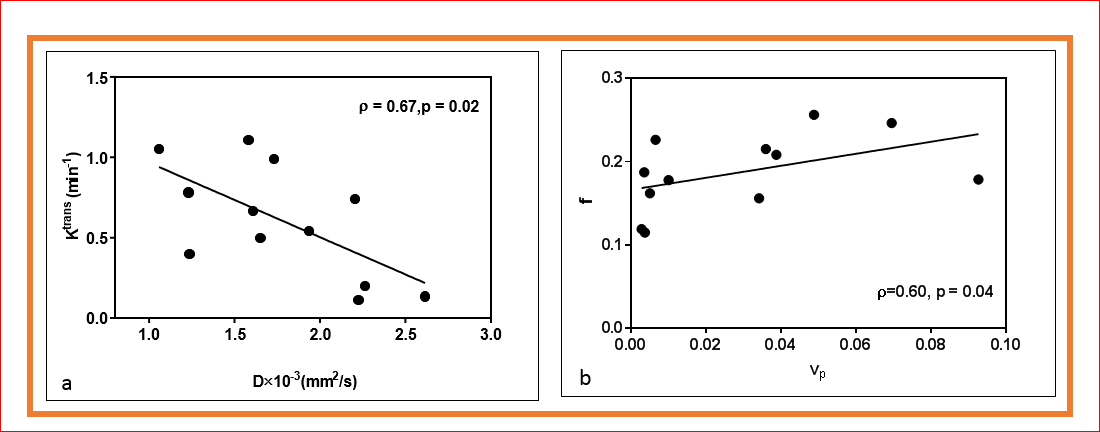
Figure 2.(a).
Scatter plot of the mean Ktrans values versus the mean D values. (b). Scatter
plot between the mean f and vp values.
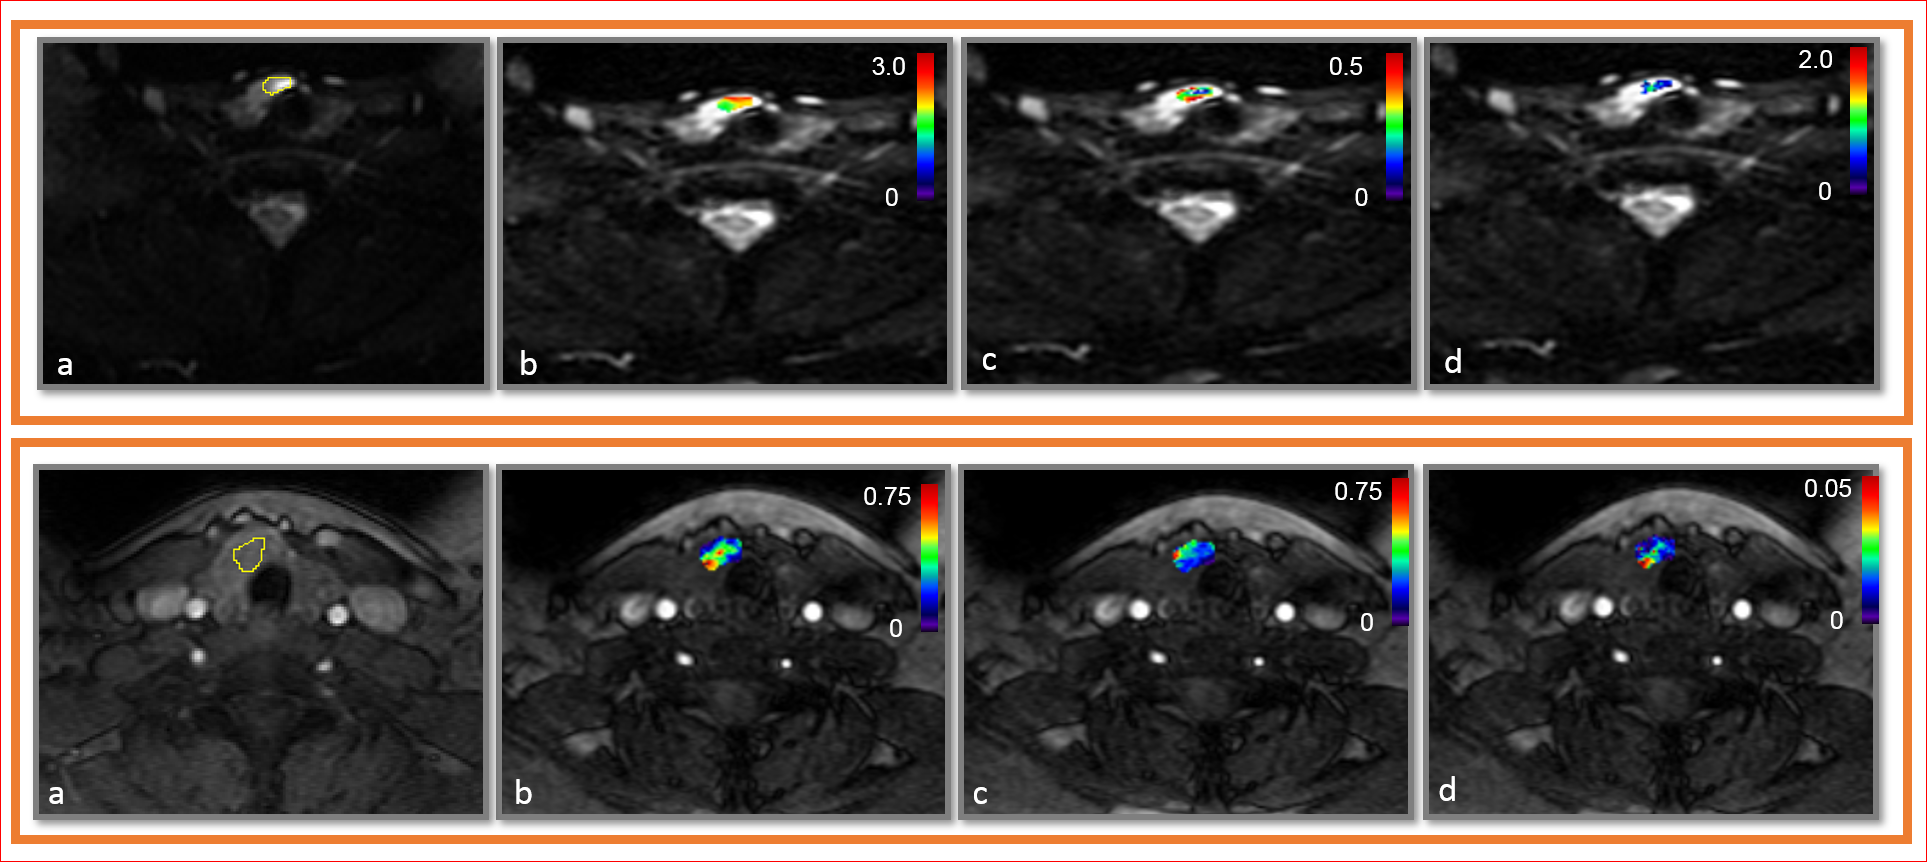
Figure
3. Top: A representative PTC patient with tumor-aggressive features (female; 48
years).(a). Diffusion-weighted image (b = 0 s/mm2) with ROI. (b). D ×10-3
[mm2/s], (c), f , and (d) K maps overlaid on diffusion weighted
image (b = 0 s/mm2).Bottom:(a). Pre-contrast T1 weighted image with ROI. (b) Ktrans (min-1),
(c) ve, and (d) vp maps overlaid on pre-contrast T1 weighted
image.