1189
Bi-exponential T1ρ relaxation calculation of parotid glands in vivo at 3T
Huimin Zhang1, Qiyong Ai1, Queenie Chan2, Ann D. King1, and Weitian Chen1
1Department of Imaging and Interventional Radiology, The Chinese University of Hong Kong, Hong Kong, Hong Kong, 2Philips Healthcare, Hong Kong, Hong Kong
1Department of Imaging and Interventional Radiology, The Chinese University of Hong Kong, Hong Kong, Hong Kong, 2Philips Healthcare, Hong Kong, Hong Kong
Synopsis
T1ρ relaxation, known as the spin‐lattice relaxation time in the rotating frame, is sensitive to molecular interactions including dipolar interactions, chemical exchange, and diffusion. T1ρ is often measured by mono-exponential relaxation models. Bi-exponential T1ρ relaxation have been previously observed in muscle, cartilage, menisci and brain. We report our observation of bi-exponential T1ρ relaxation in parotid glands.
Introduction
$$$T_{1\rho}$$$ relaxation, known as the spin‐lattice relaxation time in the rotating frame, is sensitive to molecular interactions including dipolar interactions, chemical exchange, and diffusion. In the head and neck, $$$T_{1\rho}$$$ relaxation has been used to evaluate the early irradiated change in the parotid gland 1 and differentiate the inflammatory and normal tissue 2. In these studies, $$$T_{1\rho}$$$ is measured by using a mono-exponential relaxation model. However, the compartmentation of tissues may lead to bi- or multi-exponential $$$T_{1\rho}$$$ relaxation. Preliminary studies showed that $$$T_{1\rho}$$$ relaxation in muscle 3, cartilage 4, menisci 5 and brain 6 follows a bi-exponential decay. In this work, we report our observation of bi-exponential $$$T_{1\rho}$$$ relaxation in parotid glands on human subjects.Method
Nine healthy volunteers (age $$$25.5\pm 3.5$$$, $$$3$$$ females and $$$6$$$ males) were scanned on a Philips Achieva 3.0T scanner (Philips Healthcare, Best, the Netherlands) under the approval of the institutional review board. The body RF coil was used as the transmitter and a 16-channel Philips neurovascular phased-array coil which covers the entire parotid glands was used as the receiver. Imaging parameters include: resolution 1.2 mm × 1.2 mm, slice thickness 5 mm with total 9 slices, TE/TR 4.9 ms/2500 ms, 12 TSLs for [0 5 8 12 15 25 35 45 60 70 80 90] ms, spin-lock frequency 400 Hz.The data sets at 12 TSLs were fit to a mono-exponential model, $$$S_{mono}=S_{0}\cdot e^{-TSL/T_{1\rho, mono}}$$$ and a bi-exponential model based on Levenberg-Marquardt algorithm, $$$S_{bi}=S_{01}\cdot e^{-TSL/T_{1\rho, long}}+S_{02}\cdot e^{-TSL/T_{1\rho, short}}$$$, where $$$S_{0}$$$ and $$$S_{01}+S_{02}$$$ are scaling constants; $$$T_{1\rho, mono}$$$ is the $$$T_{1\rho}$$$ value fitted by the mono-exponential model; $$$T_{1\rho, long}$$$ and $$$T_{1\rho, short}$$$ represent the long and short component of the $$$T_{1\rho}$$$ in the bi-exponential model, respectively. The fractions of the pools with long and short $$$T_{1\rho}$$$ are defined as $$$f_{long} = S_{01}/(S_{01}+S_{02})$$$ and $$$f_{long} = S_{02}/(S_{01}+S_{02})$$$, respectively. Six ROIs for each subjects were contoured manually on the left parotid gland. The $$$T_{1\rho, mono}$$$, $$$T_{1\rho, long}$$$ and $$$T_{1\rho, short}$$$ and $$$f_{long}$$$ of six ROIs were calculated.
The residual sum of squares (RSS) of mono-exponential fitting and bi-exponential fitting were calculated to compare the goodness of fit. To quantitatively evaluate the significance of their difference, F test was performed. The F-ratio is defined as $$F=\frac{(RSS_{1}-RSS_{2})/(NV_{2}-NV_{1})}{RSS_{2}/(N-NV_{2}))},$$ where $$$RSS_{1}$$$ and $$$RSS_{2}$$$ correspond to the mono-exponential and bi-exponential models, respectively; N represents the data points acquired (N=12); and $$$NV_{1}$$$ and $$$NV_{2}$$$ are the numbers of variables in each model.
Results
In parotid glands, the long and short $$$T_{1\rho}$$$ were of ~59-70 msec with a fraction of ~0.73-0.91 and ~10-25 msec with a fraction of ~0.09-0.27 respectively, while mono $$$T_{1\rho}$$$ ~50-61 msec. The F ratios of 9 subjects range from 10 to 174 with a P value of 0.01. There is a significantly improvement of fitting by using bi-exponential model compared to mono-exponential model. Figure 1 displays typical raw-images at different TSLs for $$$T_{1\rho}$$$ quantification. Figure 2a illustrates 6 ROIs drawn on the left parotid gland. Figure 2b plots the $$$T_{1\rho}$$$ fitting curves of mono- and bi-exponential models from the 6th ROI. Figure 3 lists the measured parameters from two models and the corresponding F ratios. Figure 4 shows adjusted R-squared maps of mono- and bi-exponential fitting models. Figure 5 shows $$$T_{1\rho, mono}$$$,$$$T_{1\rho, short}$$$, $$$T_{1\rho, long}$$$ maps and the fraction map of long $$$T_{1\rho}$$$ component.Discussion and Conclusion
The fitting results show that bi-exponential fitting curve matches to raw data better than the mono-exponential fitting curve. Note that there are regions in the bi-exponential fitting maps (e.g. long and short $$$T_{1\rho}$$$ maps, fraction map) with extreme values. This may due to blood vessels and gland ducts in the parotid area. When drawing ROIs, we carefully avoid these regions by selecting areas which are homogeneous and with values satisfying certain criteria ( $$$T_{1\rho, short}$$$<$$$T_{1\rho, mono}$$$, $$$T_{1\rho, long}$$$>$$$T_{1\rho, mono}$$$, $$$T_{1\rho, short}$$$>0, $$$T_{1\rho, long}$$$<100 ms). Bi-exponential fitting appears to be more susceptible to the presence of noise compared to mono-exponential fitting. Higher SNR of images is required to achieve reliable fitting results. It is worthy of further investigation how much SNR is needed to achieve reliable bi-exponential fitting in our application.Bi-exponential $$$T_{1\rho}$$$ relaxation observed in parotid glands may be caused by combination of free water and constrained water. The long and short $$$T_{1\rho}$$$ values and their fraction in the tissue may have high sensitivity to the structural changes of parotid gland and have potential clinical use. Further study is needed to explain the reasons causing bi-exponential relaxation at a cellular level and demonstrate its possible clinical applications.
Acknowledgements
This study is supported by a grant from the Research Grants Council of the Hong Kong SAR (Project SEG CUHK02).References
- Zhou, N., Chu, C., Dou, X., Li, M., Liu, S., Guo, T., ... & Yan, J. (2017). Early changes of irradiated parotid glands evaluated by T1rho-weighted imaging: a pilot study. Journal of computer assisted tomography, 41(3), 472-476.
- Chu, C., Zhou, N., Zhang, H., Dou, X., Li, M., Liu, S., ... & Sun, L. (2017). Use of T1ρMR imaging in Sjögren's syndrome with normal appearing parotid glands: Initial findings. Journal of Magnetic Resonance Imaging, 45(4), 1005-1012.
- Yuan, J., Zhao, F., Chan, Q., & Wang, Y. X. J. (2012). Observation of bi-exponential T1ρ relaxation of in-vivo rat muscles at 3T. Acta Radiologica, 53(6), 675-681.
- Sharafi, A., Xia, D., Chang, G., & Regatte, R. R. (2017). Biexponential T1ρ relaxation mapping of human knee cartilage in vivo at 3 T. NMR in Biomedicine, 30(10), e3760.
- Baboli, R., Sharafi, A., Chang, G., & Regatte, R. R. (2019). Biexponential T1ρ relaxation mapping of human knee menisci. Journal of Magnetic Resonance Imaging.
- Menon, R. G., Sharafi, A., Windschuh, J., & Regatte, R. R. (2018). Bi-exponential 3D-T1ρ mapping of whole brain at 3 T. Scientific reports, 8(1), 1176.
Figures
Figure 1: Raw data set acquired at TSL 0, 5, 8, 12, 15, 25, 35, 45, 60, 70, 80, 90 ms for T1ρ fitting.
Figure 2: a) Six ROIs are drawn manually from the left parotid gland in T1ρ,long map. b) Raw data points, bi-exponential and mono-exponential fitting results averaged in ROI 6.
Figure 3: T1ρ values from mono-exponential model, long-, short-T1ρ values and the fraction of long-T1ρ from bi-exponential model were averaged within selected ROIs from 2a). The corresponding F ratios were also listed.
Figure 4: Adjusted R-square maps from mono-exponential fitting (left) and bi-exponential fitting (right).
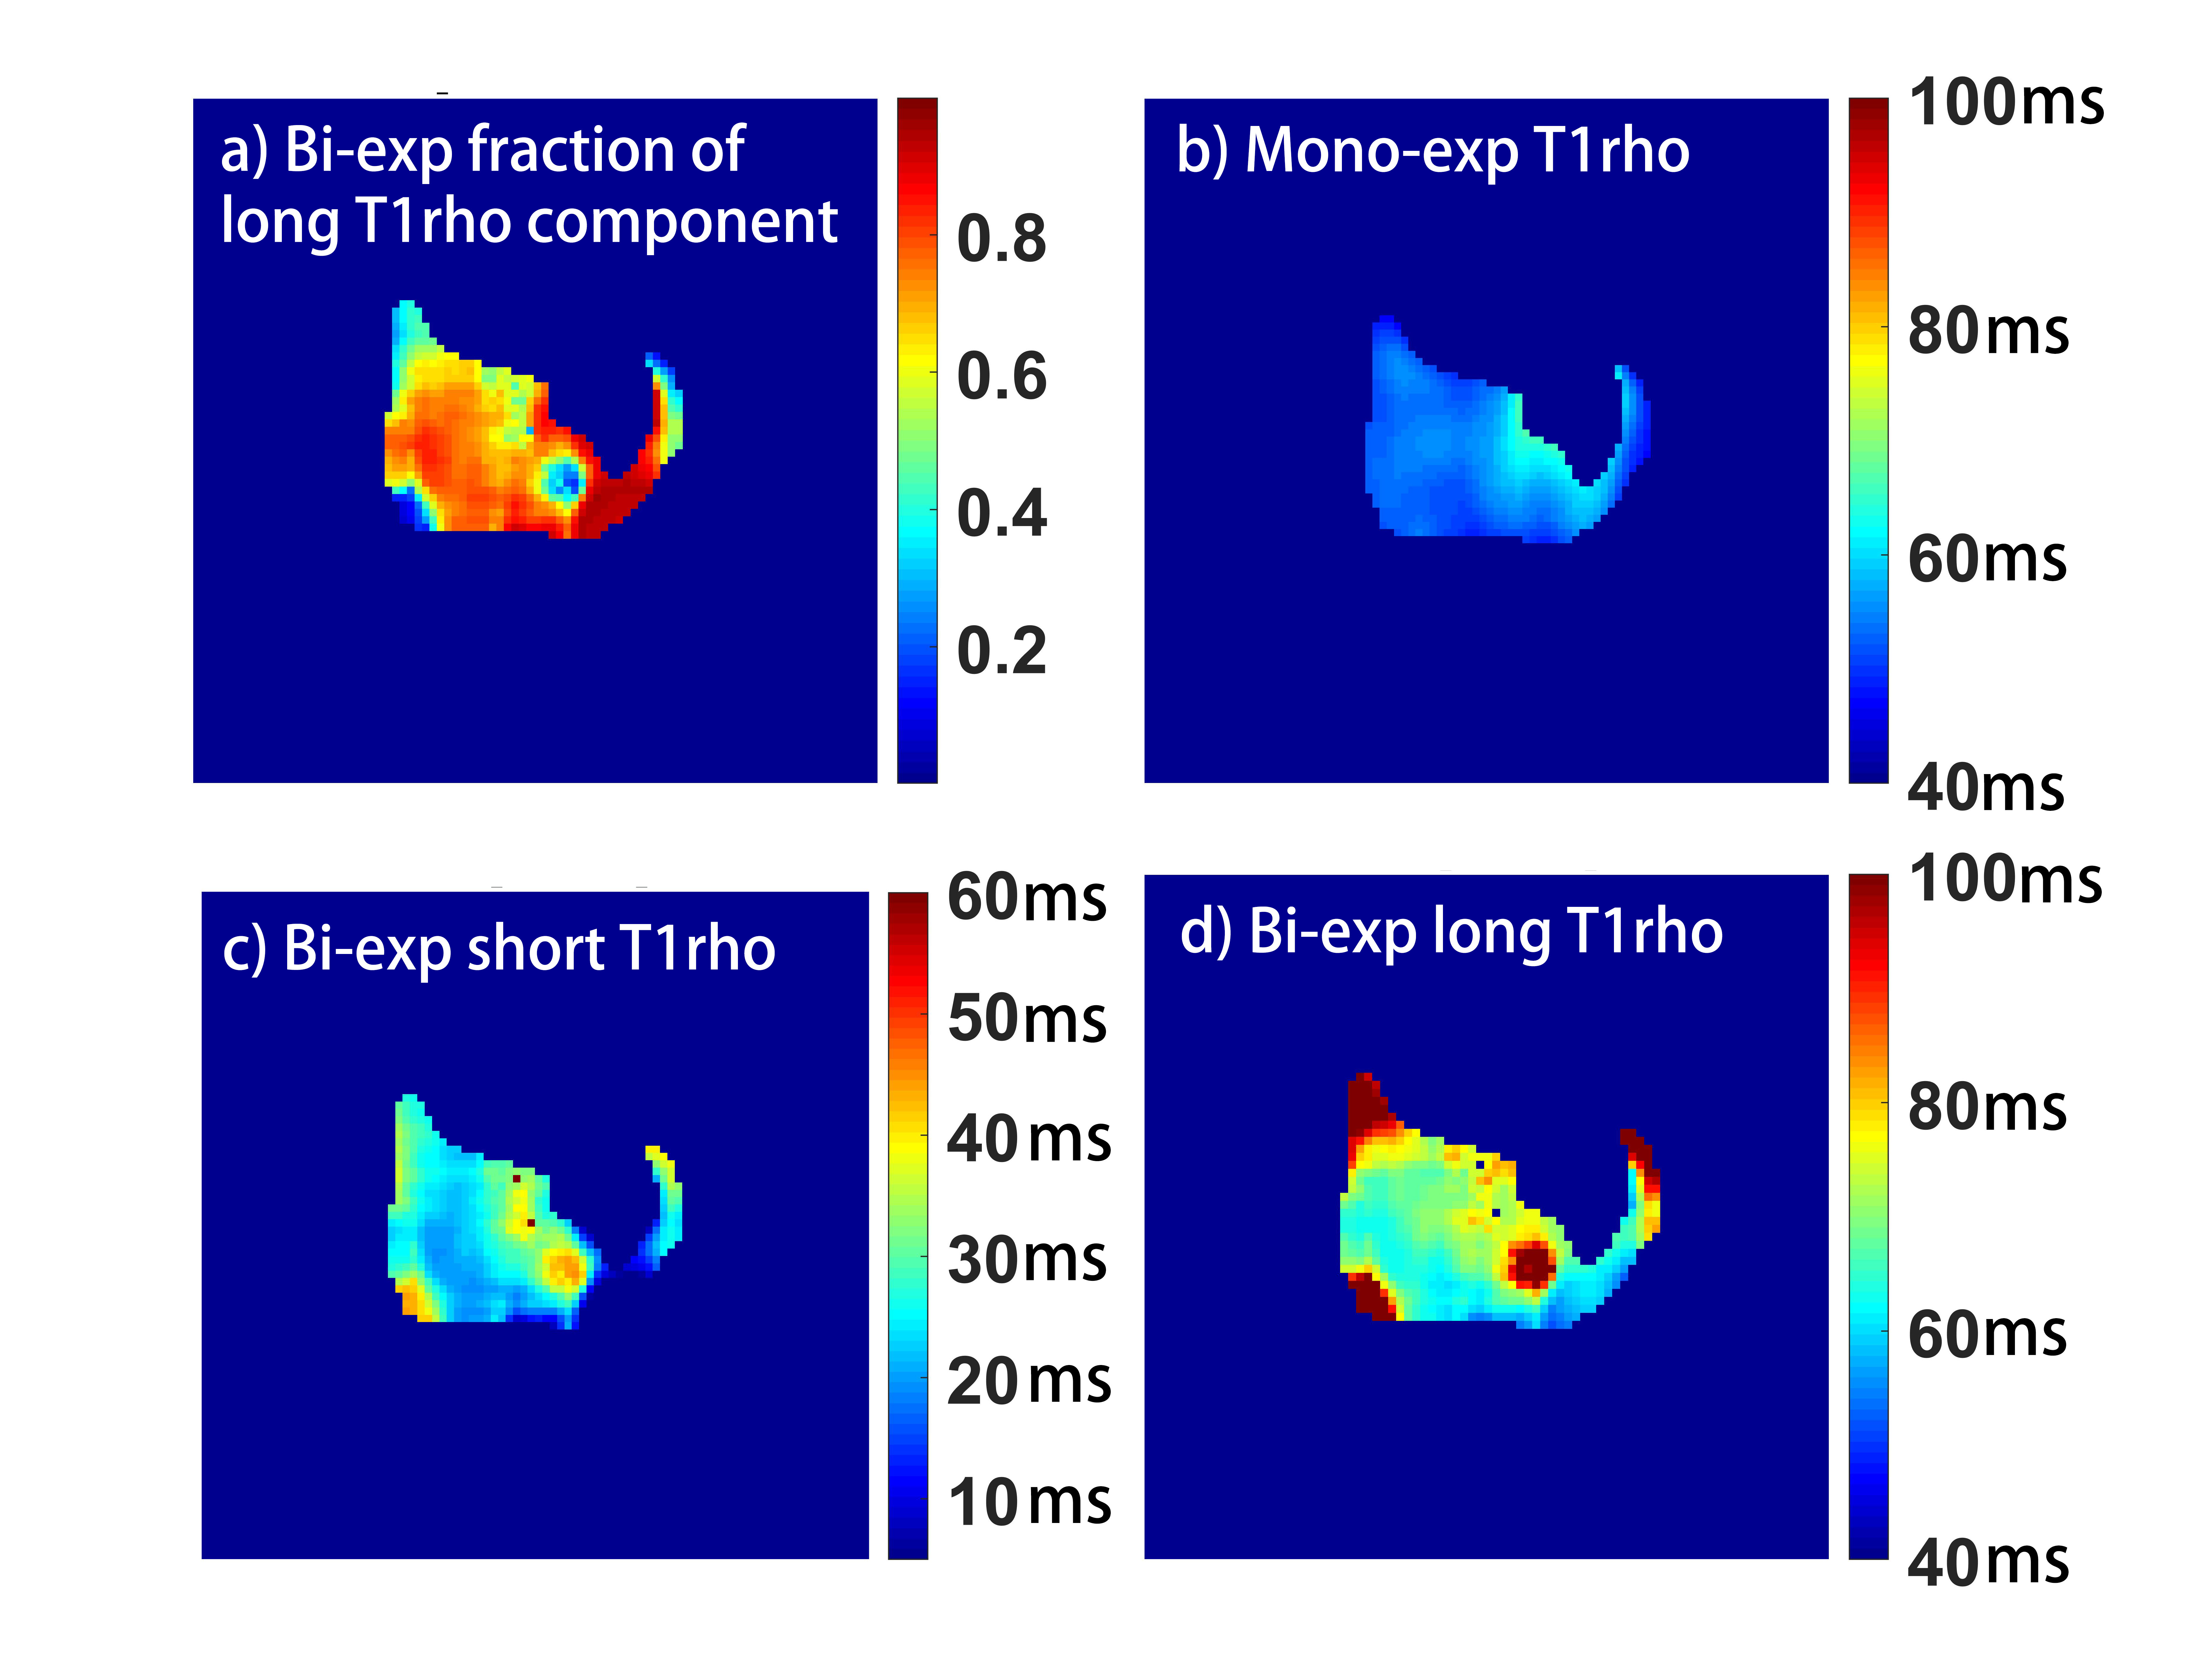
Figure 5: a) The fraction map of long T1ρ component in the bi-exponential fitting model, c) short and d) long T1ρ maps fitted by the bi-exponential fitting model. b) T1ρ map in the mono-exponential model.