1185
Cervical cord resting-state fMRI shows preserved functional connectivity in low disability relapsing-remitting multiple sclerosis1Radiology & Radiological Sciences, Vanderbilt University Medical Center, Nashville, TN, United States, 2Vanderbilt University Institute of Imaging Science, Nashville, TN, United States, 3Department of Biomedical Engineering, Vanderbilt University, Nashville, TN, United States, 4School of Medicine, Meharry Medical College, Nashville, TN, United States, 5Clinical Neurology, Vanderbilt University Medical Center, Nashville, TN, United States
Synopsis
Functional connectivity (FC) in the cervical spinal cord can be assessed with 3T resting-state fMRI. FC strength in the ventral and dorsal networks was measured in a group of relapsing-remitting multiple sclerosis (MS) patients with low disability, high cervical lesion load, and mildly impaired sensorimotor function and was found similar to matched healthy controls. There was no impact of the presence of cord lesions, suggesting FC is preserved even in the presence of structural damage. Future work will explore the longitudinal trajectories of cord FC in support of intact or impaired sensorimotor function in MS.
Introduction
Tissue damage in the spinal cord probed with structural MRI only partially explains clinical impairment in relapsing-remitting multiple sclerosis (RRMS). Ventral and dorsal functional networks in the cervical cord can be reliably detected using resting-state functional MRI1,2, and are affected by the presence of focal lesions in MS3. Block-design fMRI studies have shown increased cord activation and overall altered recruitment patterns in response to tactile stimuli in RRMS4-5, more pronounced in patients with more severe disability6. However, it is unknown whether functional connectivity (FC) in the resting-state may be increased as a potential compensatory mechanism supporting preserved clinical function. We aimed to determine whether FC is affected in MS patients with known cord involvement but minimal disability, and to explore the relationships between FC and measures of sensory and ambulatory function.Methods
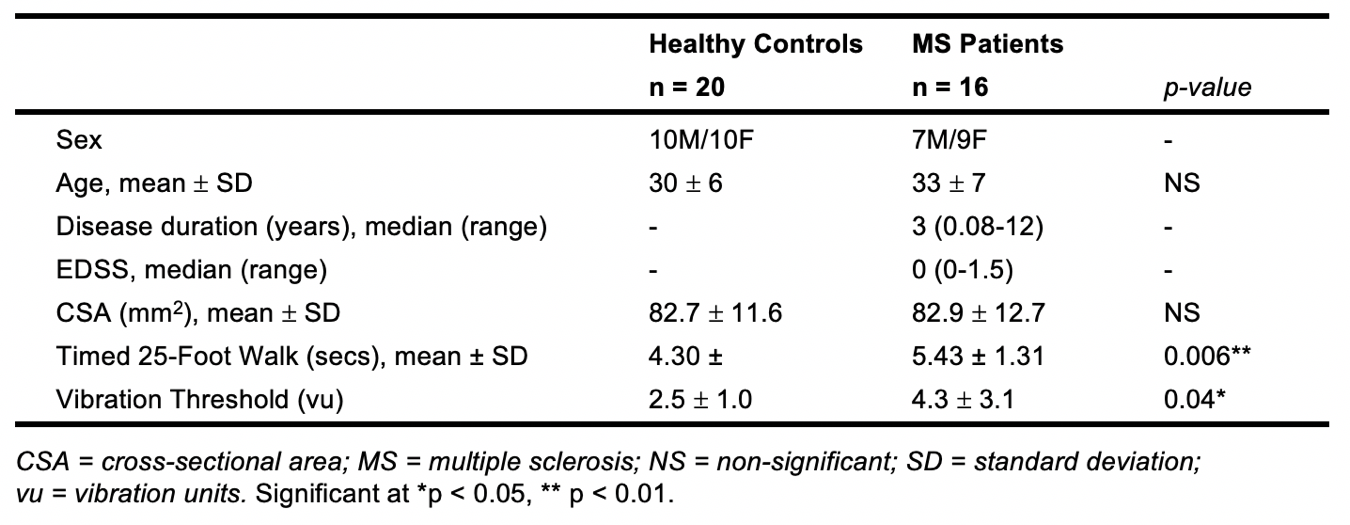
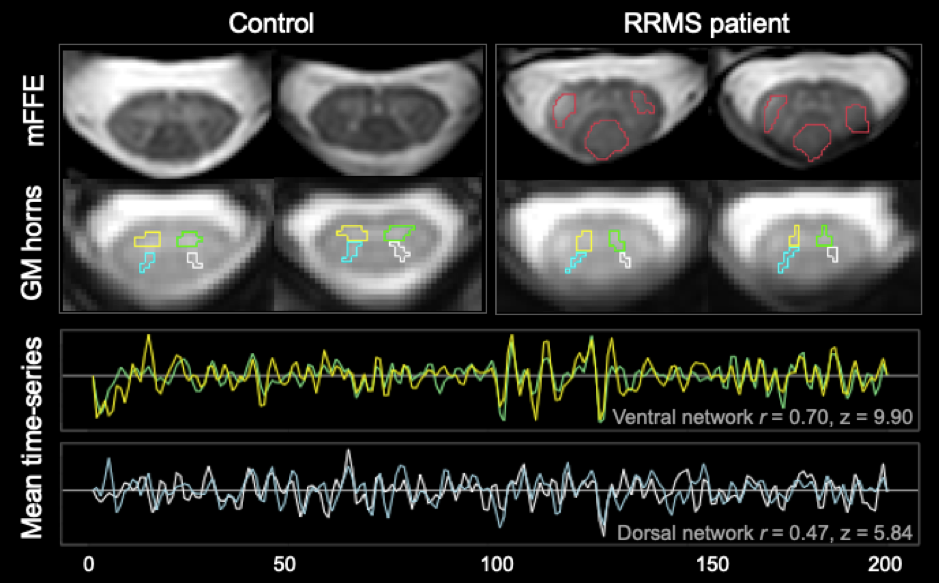
Sixteen RRMS patients with low EDSS and known cord involvement based on clinical MRI were consecutively enrolled. Twenty age-matched healthy controls (HC) were included (Table 1), and informed consent obtained. Sensorimotor function was assessed prior to scanning using the Timed 25-Foot Walk (T25FW) as a measure of ambulatory function, and great-toe vibration sensation testing using a Vibratron II system (detection threshold averaged between left/right).Participants were scanned on a 3T Philips Ingenia Elition using a 32-channel neurovascular coil with physiological monitoring. Acquisition included a T2*-weighted axial anatomical scan (multiecho FFE, TR/TE = 700/8ms, α = 28°, FOV = 160x160 mm2, 14 slices, voxel size: acquired 0.65x0.65x5mm3, reconstructed 0.31x0.31x5mm3) and an ~8min resting-state functional run (3D axial multishot gradient echo, volume acquisition time = 2.46s, TE = 20ms, α = 8°, FOV = 150x150 mm2, 14 slices, voxel size: acquired 1x1x10mm3, reconstructed 0.59x0.59x5mm3, 200 dynamics, EPI factor = 9) centered at C3/C4.
Slicewise cross-sectional areas, corrected for cord angle, were obtained using SCT-PropSeg7. Lesion masks were drawn on the anatomical image by an experienced neuroradiologist. fMRI preprocessing was conducted using SCT v4.0.08, and included the following steps: in-plane motion correction, within-slice confound regression using RETROICOR (including: respiratory cycle, motion parameters, global and CSF signal). Grey matter (GM) regions of interest (ROIs) were obtained by registering the anatomical scan into functional space, segmenting GM using SCT-Deepseg, partitioning the resulting mask into quadrants and discarding the central GM commissure. Data were bandpass-filtered (0.01-0.13Hz) and the average time-series obtained for each GM horn. Slices at the C3 and C4 levels were considered for analysis, as inherent differences in connectivity strength between vertebral levels have not yet been investigated. Pearson correlation coefficients and corresponding Fisher z-scores (correcting for 1st-order autocorrelation) were computed for each slice between the two ventral, and the two dorsal GM horns. Linear mixed-effects models were used to assess the impact of lesion within a slice on z-scores (treating participant as a random effect to account for inter-dependence of z-scores within-subject). In the MS group, mean ventral and dorsal z-scores were calculated for each subject, and clinico-radiological associations were assessed with Spearman rank-order correlations.
Results
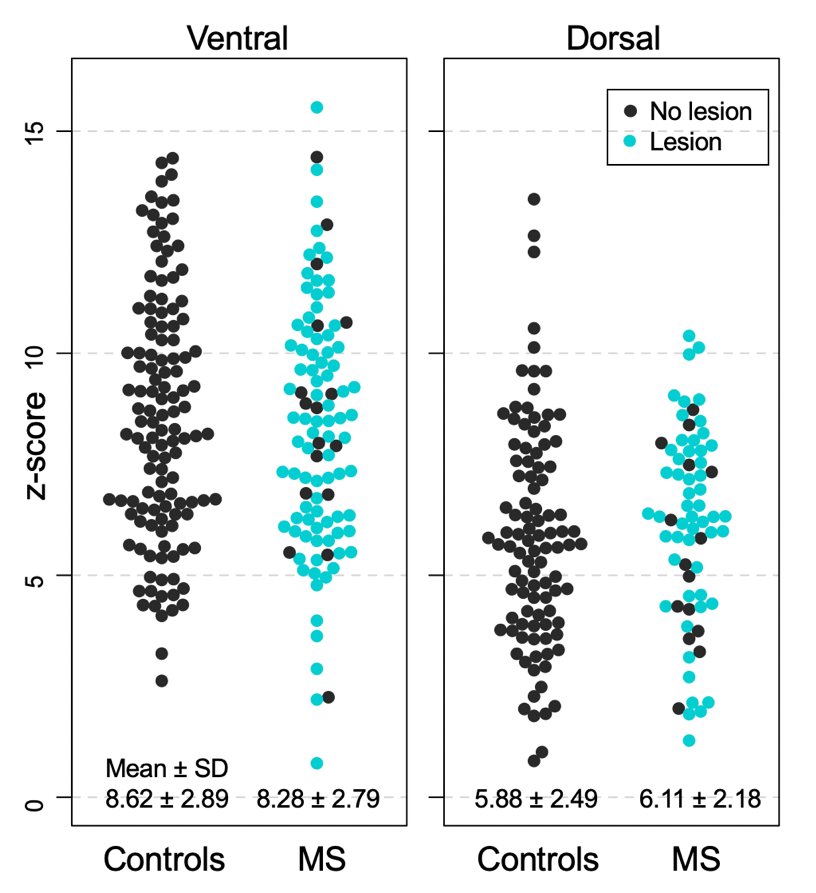
Sensorimotor measures differed between patients and controls. There was no significant atrophy in the MS group at the C3/C4 level (all p>0.05; Table 1).To ensure adequate ROI selection, slices were retained only when GM ROIs were >= 4 voxels (1.72 mm3; Figure 1). Of the remaining slices, linear mixed-effects models (with subject and slice as random effects) showed no main effect of vertebral level on either ventral or dorsal FC in HC (both p>0.05), therefore slices within C3 and C4 were considered concurrently. Across both levels and valid slices, in the HC group, a paired t-test showed that ventral network z-scores were higher than dorsal ones (p<0.001), and that ventral and dorsal z-scores were linearly correlated within-slice when accounting for inter-individual differences (p<0.001).
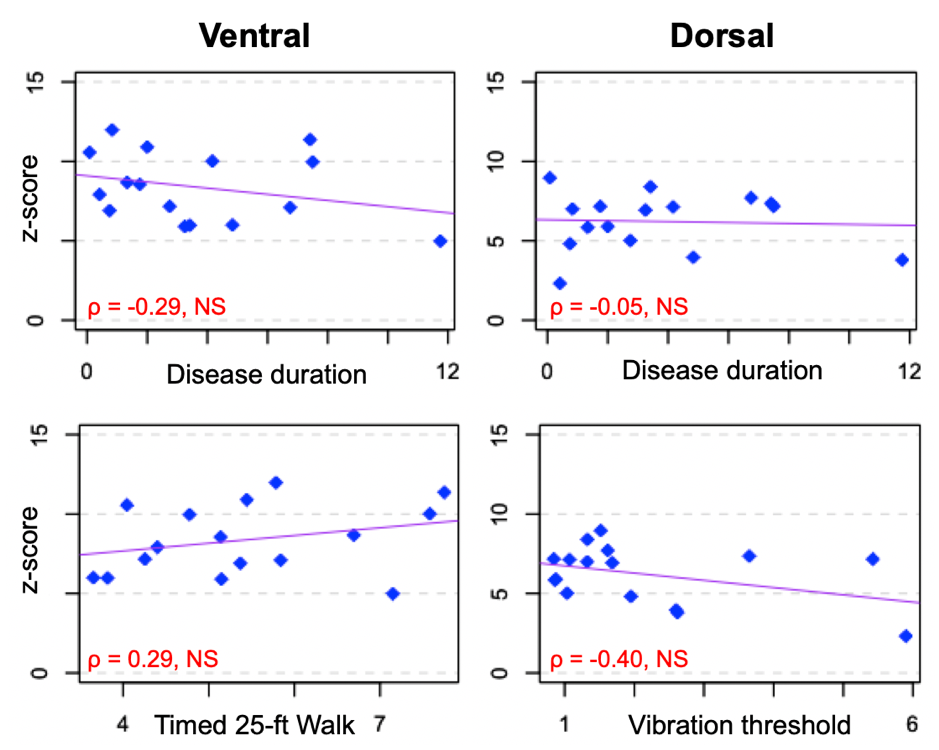
HC and MS groups did not differ in either ventral or dorsal FC (both p>0.05; Figure 2). In the MS group, there was no impact of the presence of lesion within a slice on either ventral or dorsal connectivity (p>0.05; Figure 2). Neither ventral (ρ=-0.29) nor dorsal z-scores (ρ=-0.05) were related to disease duration. There were no correlations between ventral FC and T25FW (ρ=0.29) nor between dorsal FC and vibration threshold (ρ=-0.40; all p>0.05; Figure 3).
Discussion and Conclusion
Increased cervical cord FC as a potential compensatory mechanism is not detectable early in the disease course in RRMS patients with minimal deficits in sensorimotor function. Observations of higher z-scores in the ventral compared to dorsal network, and the absence of group differences are consistent with previous work in a moderately impaired RRMS group3. This lack of difference may be due to repair mechanisms, which are more effective early in the disease and in younger patients. In addition, FC may be disrupted differentially by focal pathology depending on lesion location. Present findings suggest that the ability to maintain normal FC may partially explain relative preservation of sensorimotor function in this group. Further work will aim to relate the degree of tissue damage to FC using quantitative MRI methods. Inclusion of a larger sample and longitudinal data will inform on the reproducibility of the method, and whether FC measures can help predict or reflect evolution in clinical status over time.Acknowledgements
The authors thank all study participants and the VUIIS MRI technologists. Dr. O’Grady is supported by a VUMC Faculty Research Scholars Award. This work was supported by funding from the Conrad Hilton Foundation, National MS Society, and NIH/NINDS 1R01NS109114-01.
References
1. Barry, R. L., Smith, S. A., Dula, A. N., & Gore, J. C. (2014). Resting state functional connectivity in the human spinal cord. Elife, 3, e02812.
2. Eippert, F., Kong, Y., Winkler, A. M., Andersson, J. L., Finsterbusch, J., Büchel, C., ... & Tracey, I. (2017). Investigating resting-state functional connectivity in the cervical spinal cord at 3 T. Neuroimage, 147, 589-601.
3. Conrad, B. N., Barry, R. L., Rogers, B. P., Maki, S., Mishra, A., Thukral, S., ... & Smith, S. A. (2018). Multiple sclerosis lesions affect intrinsic functional connectivity of the spinal cord. Brain, 141(6), 1650-1664.
4. Agosta, F., Valsasina, P., Caputo, D., Stroman, P. W., & Filippi, M. (2008). Tactile-associated recruitment of the cervical cord is altered in patients with multiple sclerosis. Neuroimage, 39(4), 1542-1548.
5. Agosta, F., Valsasina, P., Rocca, M. A., Caputo, D., Sala, S., Judica, E., ... & Filippi, M. (2008). Evidence for enhanced functional activity of cervical cord in relapsing multiple sclerosis. Magnetic Resonance in Medicine, 59(5), 1035-1042.
6. Valsasina, P., Agosta, F., Absinta, M., Sala, S., Caputo, D., & Filippi, M. (2010). Cervical cord functional MRI changes in relapse-onset MS patients. Journal of Neurology, Neurosurgery & Psychiatry, 81(4), 405-408.
7. De Leener, B., Kadoury, S., & Cohen-Adad, J. (2014). Robust, accurate and fast automatic segmentation of the spinal cord. Neuroimage, 98, 528-536.
8. De Leener, B., Lévy, S., Dupont, S. M., Fonov, V. S., Stikov, N., Collins, D. L., ... & Cohen-Adad, J. (2017). SCT: Spinal Cord Toolbox, an open-source software for processing spinal cord MRI data. Neuroimage, 145, 24-43.
Figures