1184
New potential MRI markers of glial scarring and tissue damage in multiple sclerosis spinal cord pathology using diffusion MRI1Centre for Medical Image Computing, Department of Computer Science, University College London, London, United Kingdom, 2NMR Research Unit, Queen Square MS Centre, Queen Square Institute of Neurology, Faculty of Brain Sciences, University College London, London, United Kingdom, 3Philips UK, Guildford, Surrey, United Kingdom, 4Nuffield Department of Clinical Neurosciences, University of Oxford, Oxford, United Kingdom, 5Department of Brain and Behavioural Sciences, University of Pavia, Pavia, Italy, 6Brain MRI 3T Center, IRCCS Mondino Foundation, Pavia, Italy
Synopsis
Multiple sclerosis (MS) is characterized by demyelination, extra-cellular matrix disruption, inflammation and astrocytic scarring of WM lesions. This study investigates the use of a recently introduced MRI technique called SANDI (Soma And Neurite Density Imaging) to provide histologically meaningful estimates of cell body (namely soma) density in MS spinal cord pathology. Our results on ex-vivo human spinal cord specimens show significant positive correlation between SANDI metrics (fneurite and fsoma) and histological markers of myelination (plp) and astrocytes reactivity (gfap), respectively. The study suggests SANDI metrics as complementary imaging markers of demyelination (fneurite), astrocytic scarring (fsoma) and extra-cellular matrix disruption (fextra).
Introduction
A cardinal feature of multiple sclerosis (MS) pathophysiology is the presence of demyelinated lesions in the central nervous system. Extra-cellular matrix disruption, reactive gliosis and the development of an astrocytic scar within the lesion are all distinctive aspects of the tissue microstructure alteration due to MS1,2.Conventional magnetic resonance imaging (MRI) lacks specificity to these pathological processes. More advanced diffusion MRI techniques, like NODDI3,4 and DBSI5-7 have been shown to provide meaningful estimates of neurite orientation dispersion, demyelination and inflammation in MS pathology4. However, there is still an unmet need for MRI techniques able to reveal other important MS pathological features such as glial scarring and extra-cellular matrix disruption.
The aim of this study is to investigate whether the recently introduced SANDI (Soma And Neurite Density Imaging)8 method can provide histologically meaningful estimates of cell body (namely soma) density in MS spinal cord pathology, potentially improving MRI’s specificity to glial scarring and tissue damage.
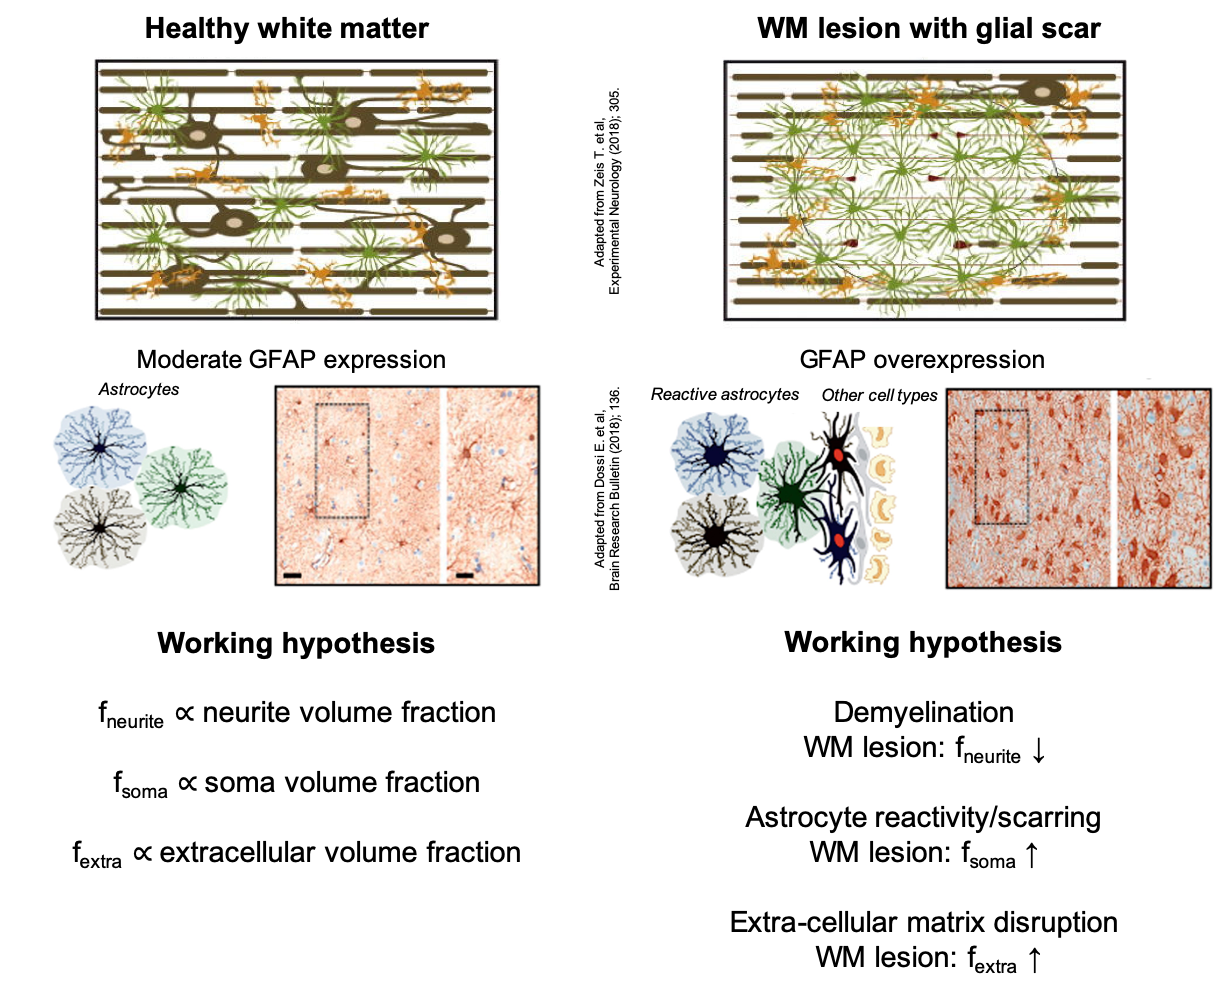
Our driving hypothesis is that glial scarring leads to increased concentration of reactive glia and macrophages within the lesion, resulting in an effective increase of soma density that SANDI could quantify (Fig.1). To validate our hypothesis, we analysed the MS spinal cord dataset previously reported in4 using SANDI and drawn correlation with relevant histological markers.
Methods
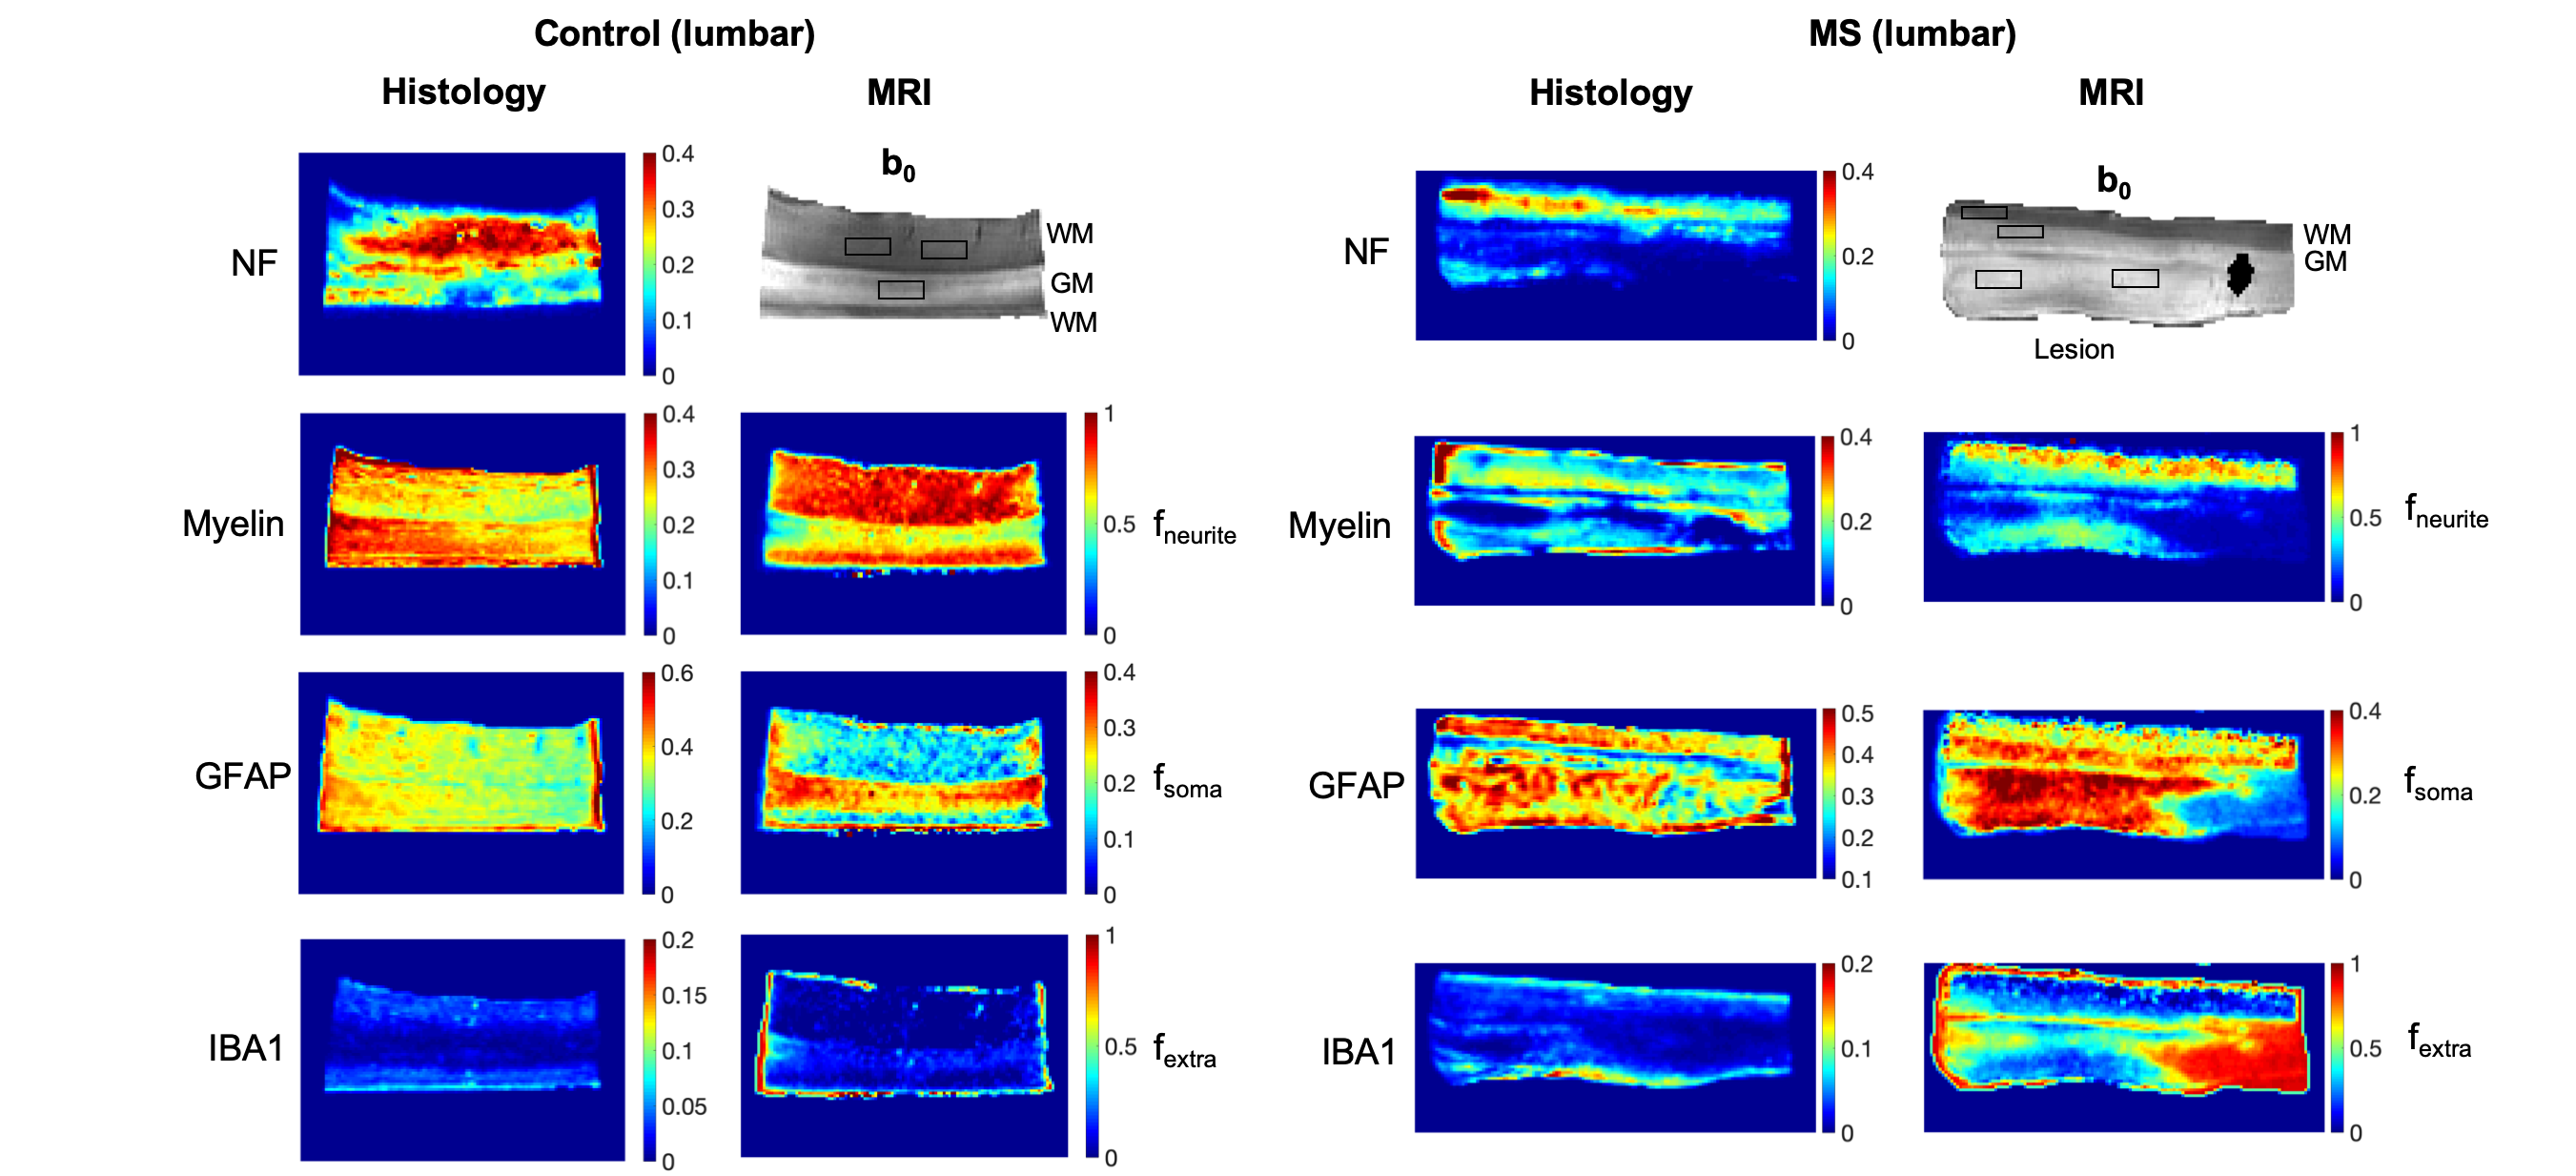
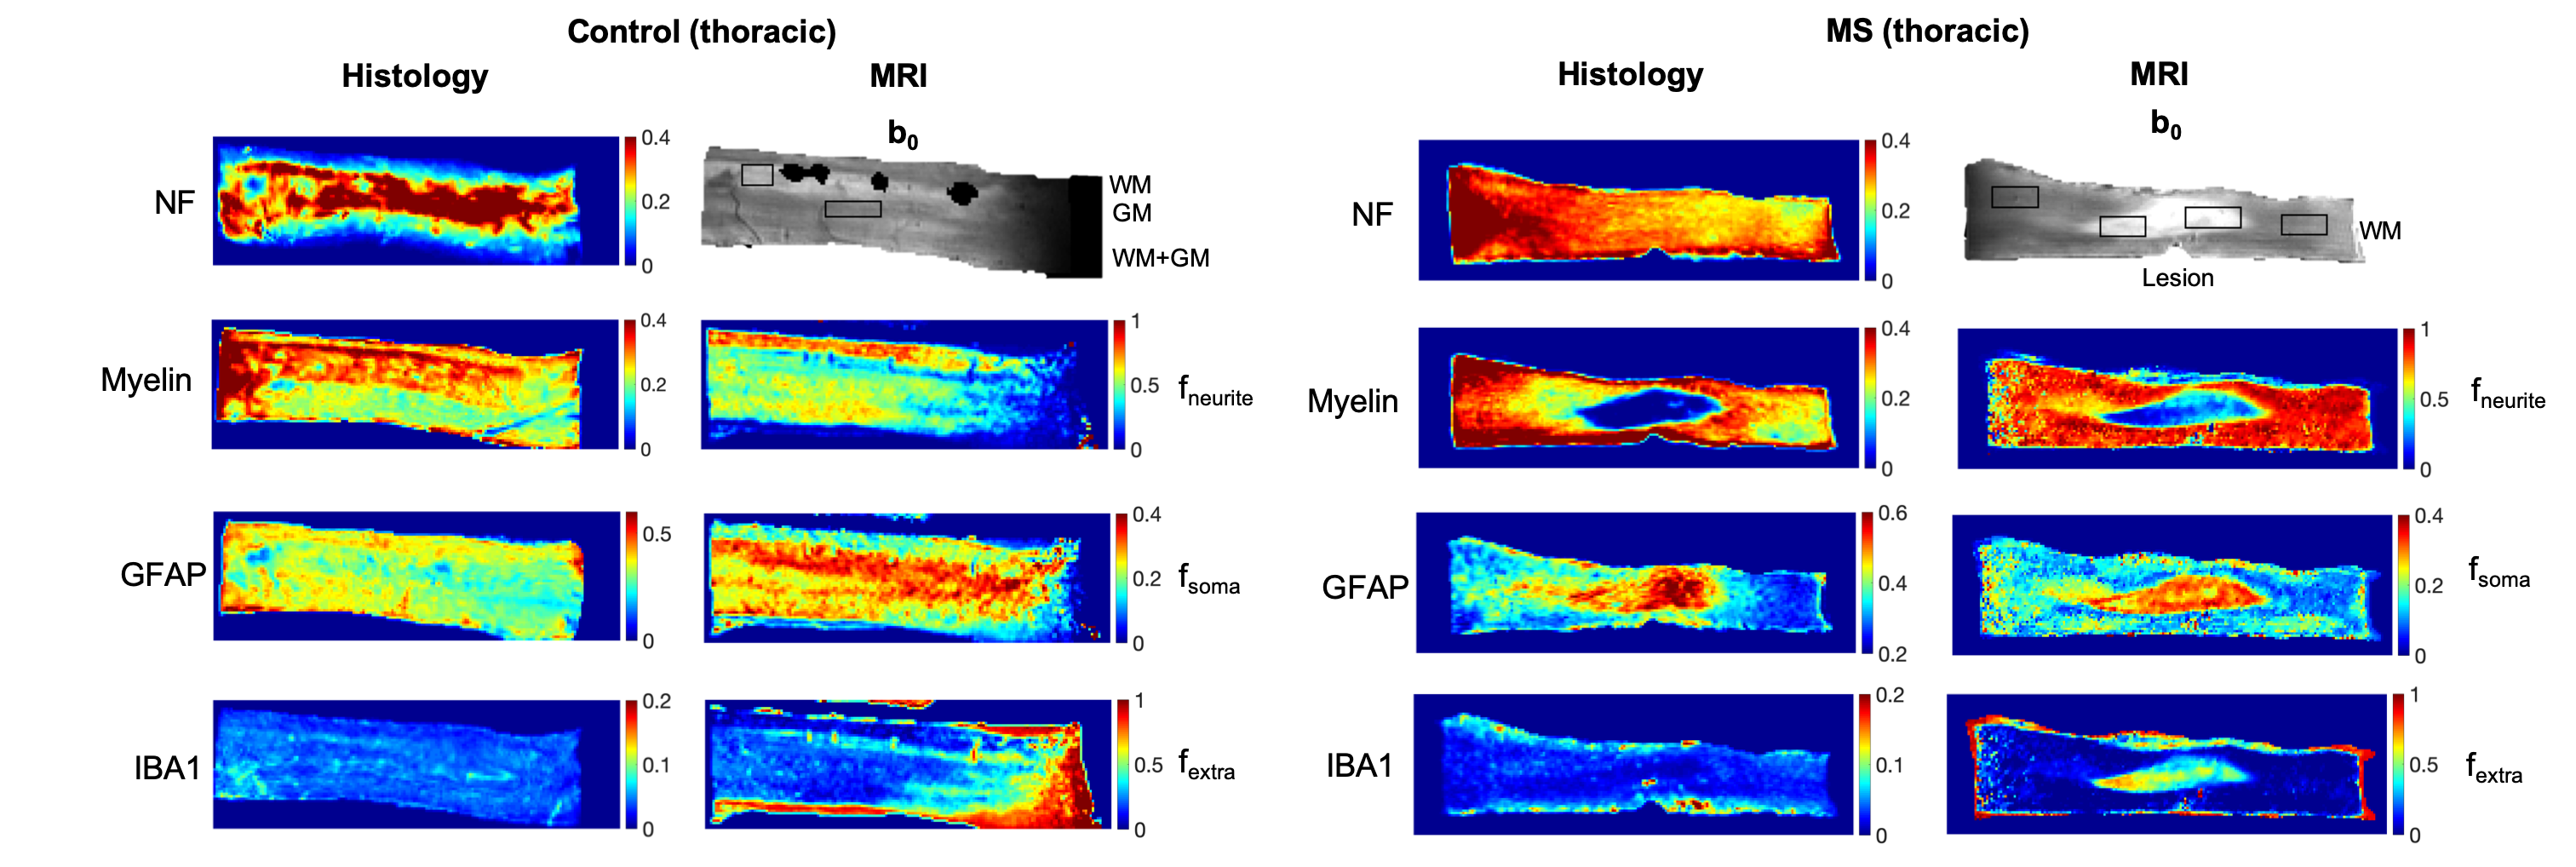
MRI acquisition. We retrospectively processed data from4. Briefly, formalin‐fixed (10% formalin) post mortem tissue from the upper thoracic (66‐year‐old male) and upper lumbar (67‐year‐old female) spinal cord of two non-neurological disease controls and two MS tissue donors (thoracic: 75‐year‐old male; lumbar: 67‐year‐old female) were scanned at 9.4T (Agilent scanner, 33 mm surface coil, 1 T/m gradient insert, constant temperature of 35°C). Twenty 0.800 mm‐thick diffusion‐weighted slices were acquired sagittally, using a multi‐slice spin-echo sequence; resolution: 0.16×0.20 mm2; field‐of‐view: 21×51.2 mm2; TE/TR=39.5/2200 ms; δ/Δ=12/18 ms; 25 b=0 images; six b=[0.52,2.08,4.68,8.32,13,18.72] ms/μm2 with [6,15,24,33,42,51] isotropically distributed gradient directions.MRI analysis. The SANDI model was fitted to the direction-averaged diffusion data voxel-by-voxel in Matlab (MathWorks), using the machine learning approach described in8. Model fitting provided maps of apparent MRI signal fraction of neurite fneurite; soma fsoma and extra-cellular fextra compartments; intra-neurite and extra-cellular apparent diffusivities Din and De; apparent soma radius Rs. Here we focused on fneurite and fsoma for quantitative comparison with relevant histological markers. Additionally, fextra is reported to assess its potential as imaging marker of extra-cellular matrix.
Histology. For each case, two serial histological sections 200 μm apart, mapped to two predefined MRI slices, were stained for: plp (myelin); iba1+ (microglia); gfap (astrocytes), and neurofilaments. High‐resolution images (400x) of the stained sections were acquired and processed in Matlab as described in4 to obtain quantitative maps in MRI space of: neurofilament (NF), myelin (Myelin), astrocyte (GFAP) and microglia (IBA) staining fractions.
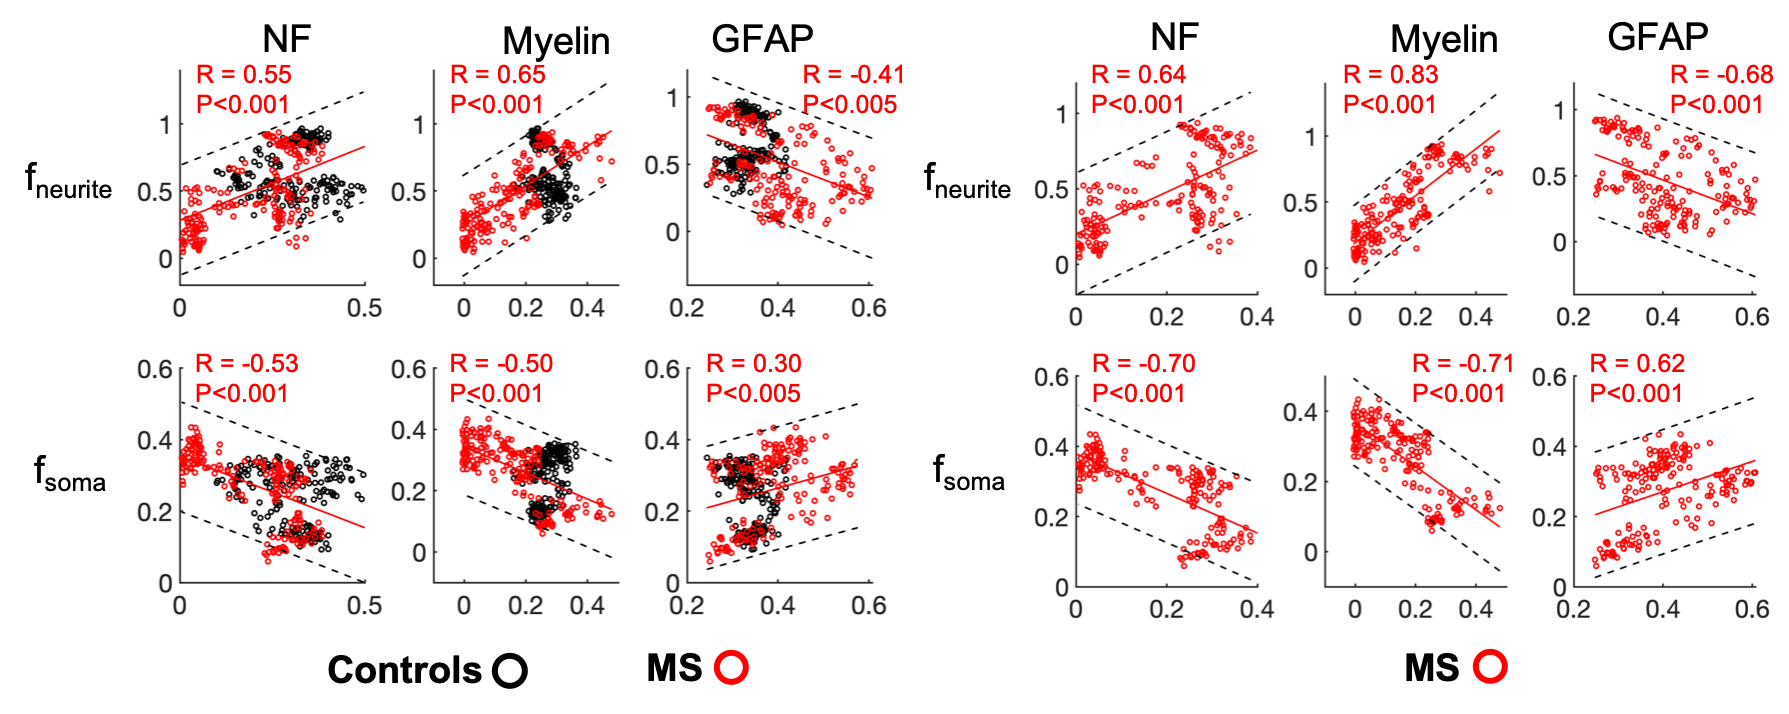
Statistical Analysis. We hypothesized that SANDI metrics fneurite and fsoma are associated with neurite and soma density. We tested this hypothesis by evaluating the Pearson’s correlation coefficient R and p-value P of fneurite and fsoma values with histological indices between voxels in 13 regions-of-interest (ROIs) (Fig.2 and 3).
Results
Fig.2 and 3 show the maps of histological indices and SANDI metrics for control and MS cases. In controls, we estimated higher fsoma and fneurite values in gray (GM) and white matter (WM), respectively, as expected8. In MS cases, we estimated higher fsoma and lower fneurite values within the WM lesion. This matches histological GFAP and Myelin maps, showing higher GFAP and lower Myelin intensity within the WM lesion. Indeed, we note a remarkable similarity of contrast between fneurite and fsoma maps with Myelin and GFAP maps, respectively. Moreover, we found increased fextra values within the lesion, compatible with the hypothesis of extra-cellular matrix disruption. IBA maps show very low staining intensity suggesting no ongoing inflammation. However, due to such low intensity, IBA values may be strongly biased by background noise, therefore we excluded them from the analysis.Fig.4 shows the scatter plot and linear correlation between NF, Myelin and GFAP with fneurite and fsoma, for joint controls and MS cases, and MS cases only. We found significant correlations between fneurite and FN (R=0.55, R=0.64 for MS only) and Myelin (R=0.65, R=0.83 for MS only), and between fsoma and GFAP (R=0.30, R=0.62 for MS only).
Discussion and Conclusion
In this work, we propose and evaluate SANDI metrics as potential new imaging markers of astrocytic scarring and tissue damage in MS spinal cord pathology. Our results on ex-vivo human spinal cord specimens show significant positive correlation of fneurite and fsoma with histological markers of myelination (plp) and reactive astrocytes (gfap), respectively. Although further investigations are required to overcome several limitations of this study (e.g. limited number of samples, not-optimal MRI acquisition, only ex-vivo data etc.), our results already support the potential utility of SANDI metrics to non-invasively characterize MS pathophysiology with unprecedented specificity through diffusion MRI.SANDI metrics could represent complementary imaging markers of demyelination (fneurite), astrocytic scarring (fsoma) and extra-cellular matrix disruption (fextra), potentially useful to help understand the pathogenetic mechanisms leading to MS abnormalities, that are still largely unclear.
Acknowledgements
The authors thank J. Carter, R. L. Yates, M. Tachrount and J. Newcombe for technical help in data acquisitions and the Oxford Brain Bank and UCL NeuroResource Tissue Bank for providing specimens. This project has received funding under the European Union’s Horizon 2020 research and innovation programme under grant agreement No. 634541 and 666992, and from: Engineering and Physical Sciences Research Council (EPSRC EP/R006032/1, M020533/1, G007748, I027084, M020533, N018702); INSPIRED study, funded by Spinal Research (UK), Wings for Life (Austria), Craig H. Neilsen Foundation (USA); UK Multiple Sclerosis Society (grants 892/08 and 77/2017); Department of Health's National Institute for Health Research (NIHR) Biomedical Research Centres (BRC R&D 03/10/RAG0449); UCL SLMS Grand Challenges 2012 PhD scheme. GCD receives funding from the NIHR BRC (Oxford), MRC (UK), and Merck‐Serono.References
1. Holley JE, Gveric D, Newcombe J, Cuzner ML, & Gutowski NJ (2003) Astrocyte characterization in the multiple sclerosis glial scar. Neuropathol Appl Neurobiol 29(5):434-444.
2. Calabrese M, et al. (2015) Exploring the origins of grey matter damage in multiple sclerosis. Nat Rev Neurosci 16(3):147-158.
3. Zhang H, Schneider T, Wheeler-Kingshott CA, & Alexander DC (2012) NODDI: practical in vivo neurite orientation dispersion and density imaging of the human brain. Neuroimage 61(4):1000-1016.
4. Grussu F, et al. (2017) Neurite dispersion: a new marker of multiple sclerosis spinal cord pathology? Ann Clin Transl Neurol 4(9):663-679.
5. Wang Y, et al. (2015) Differentiation and quantification of inflammation, demyelination and axon injury or loss in multiple sclerosis. Brain138(Pt 5):1223-1238.
6. Shirani A, et al. (2018) Histopathological correlation of diffusion basis spectrum imaging metrics of a biopsy-proven inflammatory demyelinating brain lesion: A brief report. Mult Scler:1352458518786072.
7. Wang Y, et al. (2011) Quantification of increased cellularity during inflammatory demyelination. Brain 134(Pt 12):3590-3601.
8. Palombo M, et al. (2019) SANDI: a compartment-based model for non-invasive apparent soma and neurite imaging by diffusion MRI. arXiv preprint.
Figures