1183
Dynamic Susceptibility Contrast imaging at 7T for spinal cord perfusion mapping in Cervical Spondylotic Myelopathy patients1Aix-Marseille Univ, CNRS, CRMBM, Marseille, France, 2APHM, Hopital Universitaire Timone, CEMEREM, Marseille, France, 3Aix-Marseille Univ, IFSTTAR, LBA, Marseille, France, 4iLab-Spine International Research Laboratory, Marseille-Montreal, QC, France, 5Neurosurgery Department, APHM, Hopital Nord, Marseille, France
Synopsis
The
performance of Dynamic Susceptibility Contrast imaging at 7T for spinal cord
perfusion mapping within clinical constraints was investigated. A cardiac-gated
spin-echo EPI sequence with 0.7x0.7mm2 in-plane resolution was used
in one healthy volunteer and two Cervical Spondylotic Myelopathy patients. Relative
blood volume and flow maps successfully revealed the higher perfusion of gray
matter versus white matter for the volunteer and one patient. Results were limited
for the patient with greater functional impairment and disadvantageous
acquisition conditions. Although human spinal cord perfusion has never been
mapped as precisely, several issues remain to address (image distortions, Specific-Absorption-Rate
limitations, Arterial Input Function).
Introduction
Spinal cord (SC) compressions occurring in Cervical Spondylotic Myelopathy (CSM) patients may result in local reduction of tissue perfusion, progressive ischemia and potentially irreversible tissue damage. Reliable assessment of SC perfusion would be highly valuable to neurosurgeons in the process of decision and design of decompression surgery. However, it has not been achieved within clinical constraints yet. The main challenges to tackle are low perfusion levels (similar as in brain)1–3, a small cross-sectional area (13x8mm2) and large fluctuating B0 inhomogeneities and SC motion with breathing and cerebrospinal fluid pulses. Previous work investigated the Intra-Voxel Incoherent Motion (IVIM) technique for mapping SC perfusion in-vivo1. However, acquisition time required for reliable individual mapping was too long to fit in clinical routine and to deal with patient motion, more likely to occur than with healthy volunteers. Today, the most widely used technique in clinics for brain perfusion exams remains Dynamic Susceptibility Contrast (DSC) imaging with gadolinium bolus injection, due to its short scan time and high sensitivity. To deal with the high resolution needed in the human SC, 7T MRI is now an attractive clinical avenue, given the increased susceptibility effects of gadolinium4–6 and higher signal-to-noise ratio compared to 3T. In this work, we investigated the performance of DSC at 7T for assessing SC perfusion of CSM patients within clinical constraints.Materials & Methods
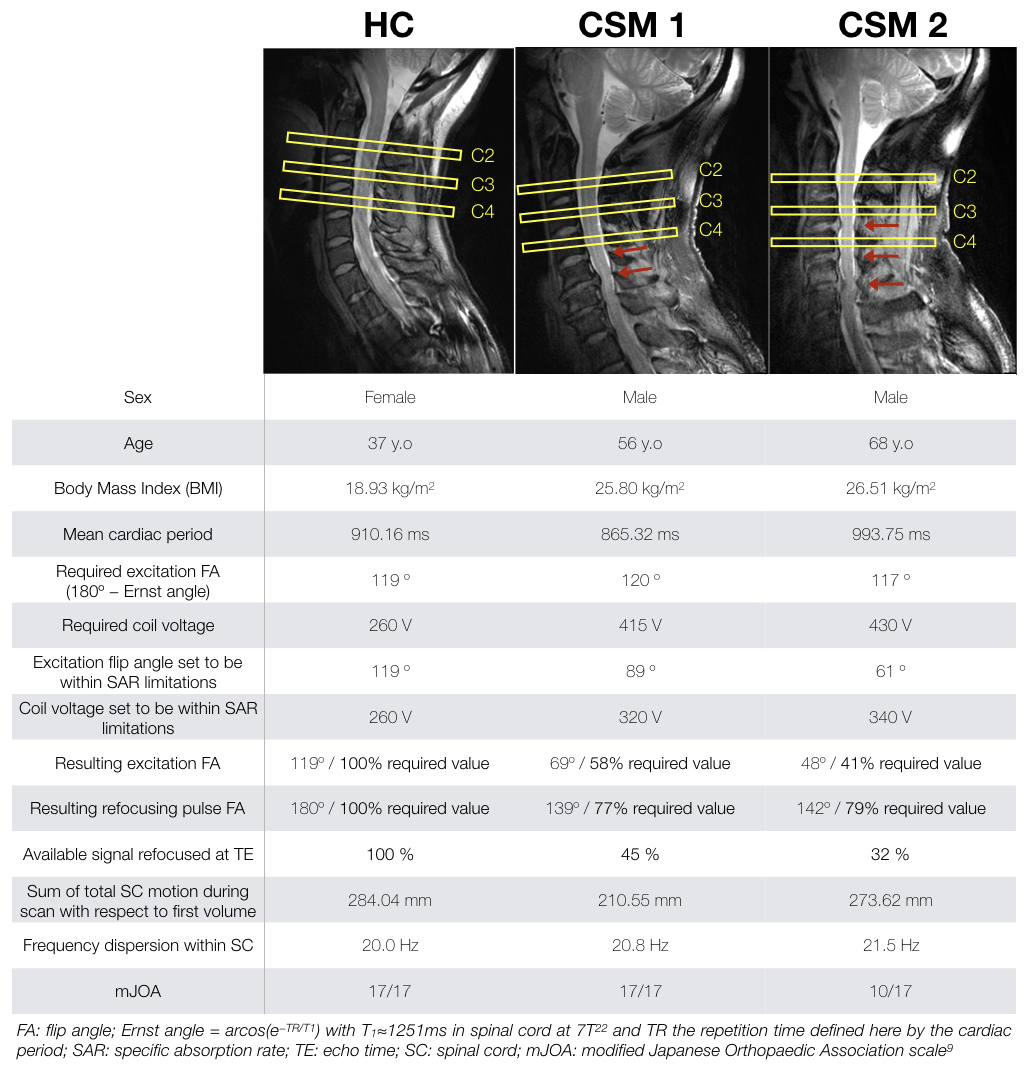
Data acquisition. Acquisitions were performed on a 7T whole-body system (Siemens Healthcare) using an 8-channel transceiver cervical spine coil array (Rapid Biomedical). Two-dimensional spin-echo EPI was preferred over 2D gradient-echo EPI for its robustness to B0 inhomogeneity. The product sequence was modified to: (1) compress acquisition at the beginning of TR (quiescent period of cervical SC and cerebrospinal fluid7,8), (2) record pulse oximeter and respiratory belt signals with acquisition timestamps for post-processing corrections.The protocol included anatomical imaging (sagittal turbo spin-echo for vertebral levels localization, transversal multi-echo gradient-echo for gray matter (GM) depiction), as well as B1+ and B0 mapping sequences. The DSC acquisition consisted of 3 transversal slices (0.7x0.7mm2 in-plane, 5-mm thick, matrix=136x136, TE=42ms, GRAPPA 2, partial-k=6/8) positioned at mid-C2, C3 and C4 levels (Fig.1) in order to image in an area where the coil transmit field remained homogeneous and efficient for most subjects. Temporal resolution was defined by cardiac beat. Fifty repetitions were acquired for baseline signal estimation and 170 during and after injection of Dotarem (Guerbet, 0.2mL/kg, 5mL/s, 30mL saline flush).
So far, the protocol was performed on one healthy control (HC) and two CSM patients (CSM1, CSM2). Their functional status was assessed with the modified Japanese Orthopaedic Association (mJOA) scale9.
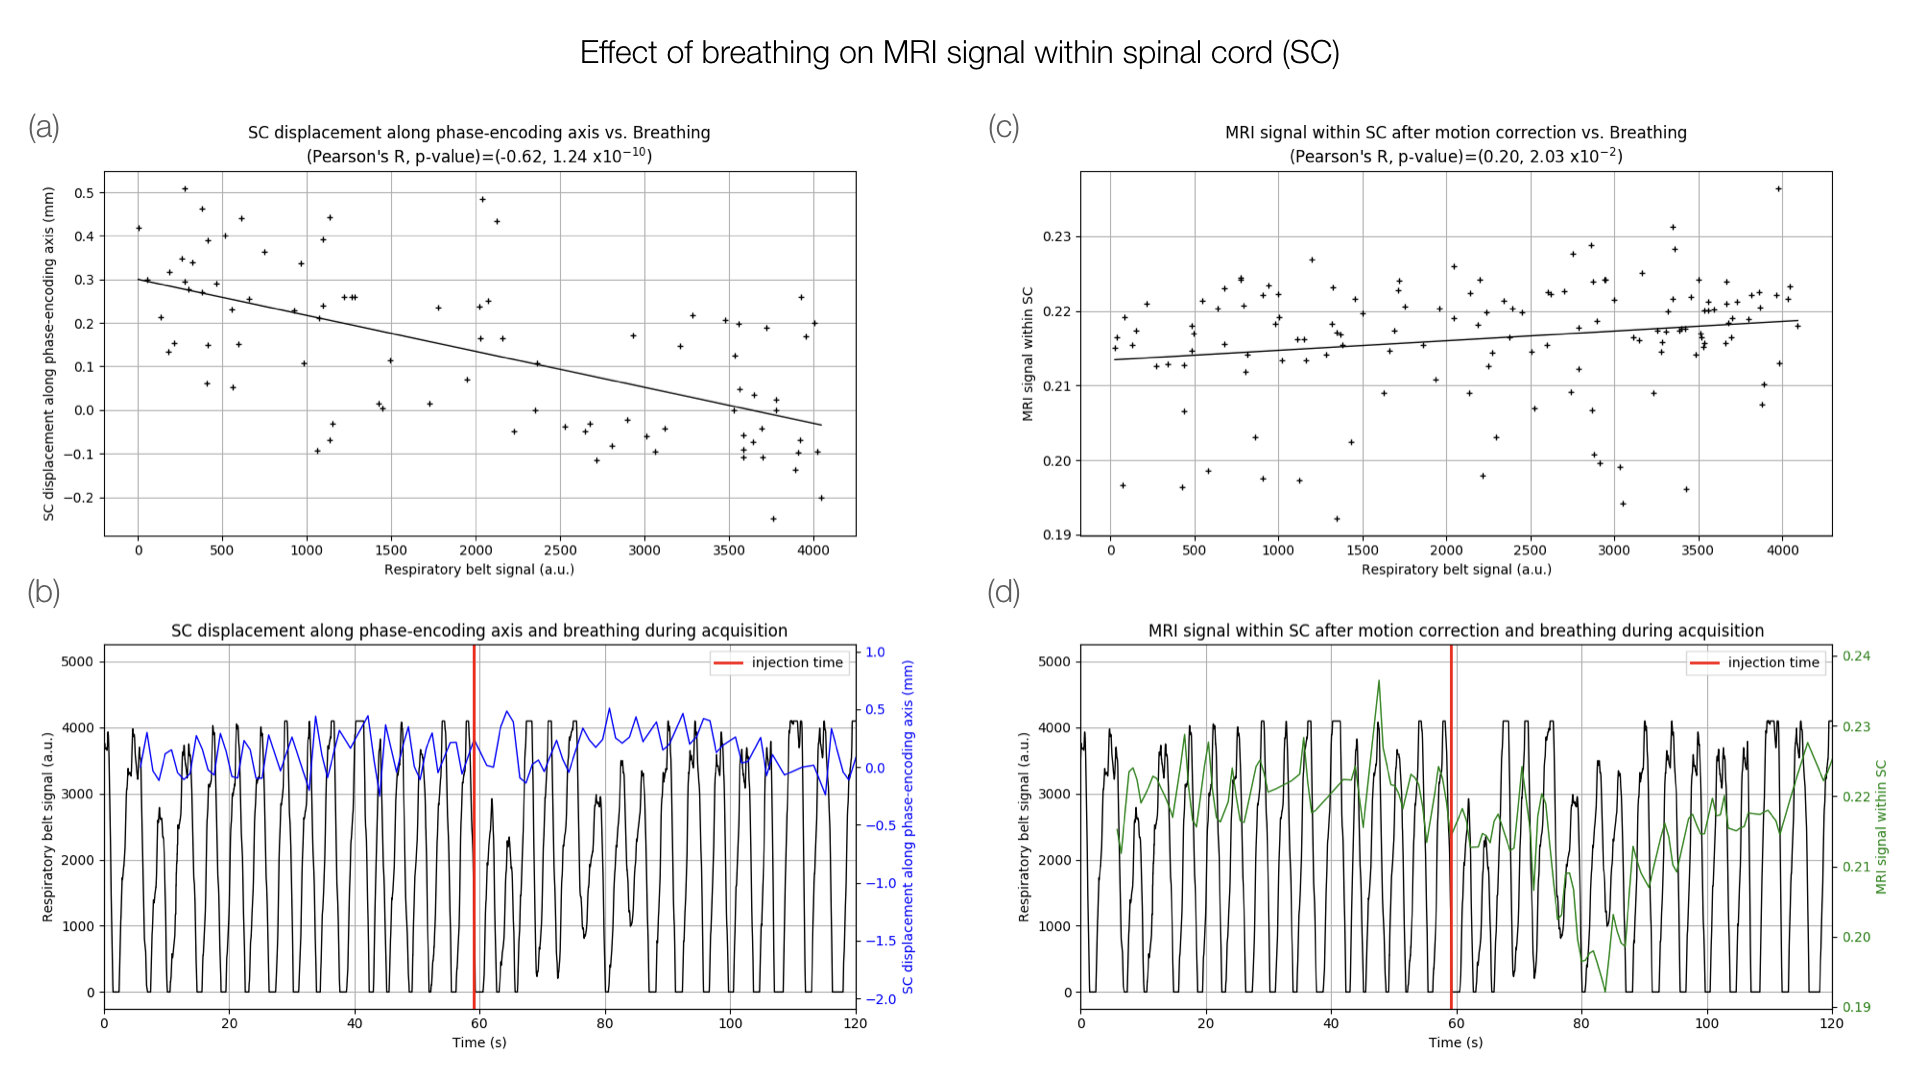
Data processing. Data were denoised with nonlocal transform-domain filter10, Gibbs artifacts were removed using sub-pixel shifting method11, rigid motion across time was corrected using ANTs12 and distortion correction was applied using Topup13 with an additional phase-encoding reversed acquisition. Signal was corrected for effective TR and B1+. Given the effect of breathing on signal (Fig.2), a band-stop filter (Butterworth), with minimum and maximum breathing frequencies as cut-off, and a final smoothing (Savitzky-Golay filter) were applied voxel-wise along time. Concentration curve was then fitted with a gamma-variate function. Area under the curve was calculated to obtain relative Blood Volume (rBV) maps.
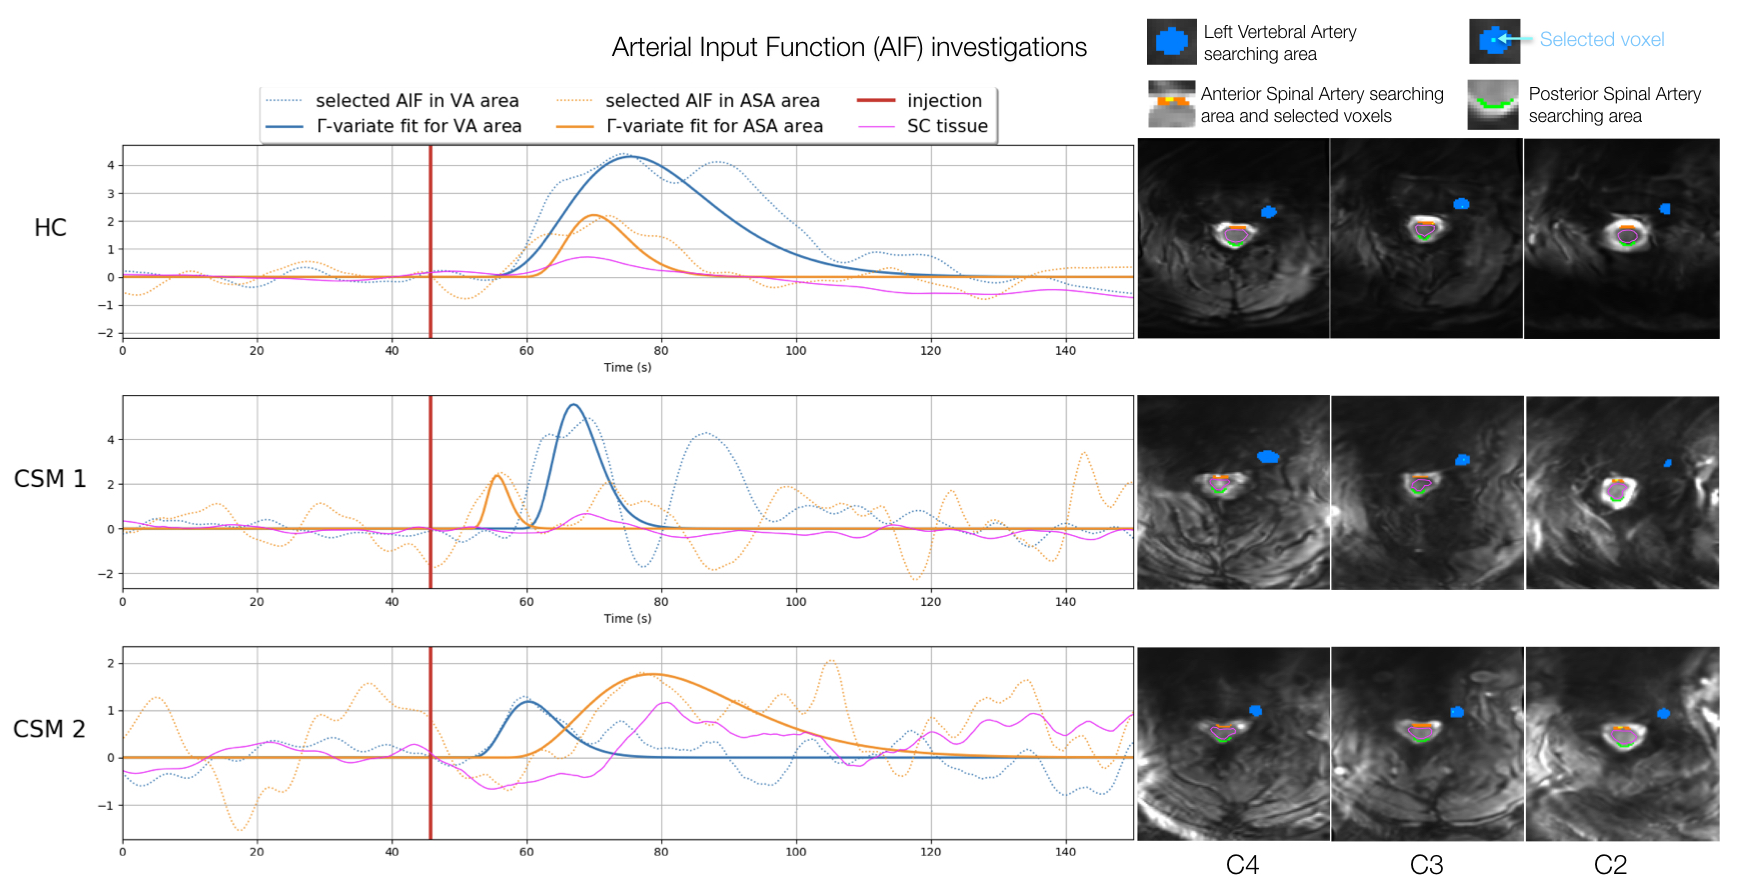
With perspectives of absolute quantification, potential Arterial Input Functions (AIF) were studied in 3 regions: Anterior and Posterior Spinal Arteries (ASA, PSA) and left vertebral artery. The selected AIF14 in ASA region was used for deconvolution by block-circulant Singular Value Decomposition15, but since AIF was not consistent for all subjects, blood flow maps were normalized by the mean value in GM (all slices) for each subject to obtain relative Blood Flow (rBF) maps.
Results & Discussion
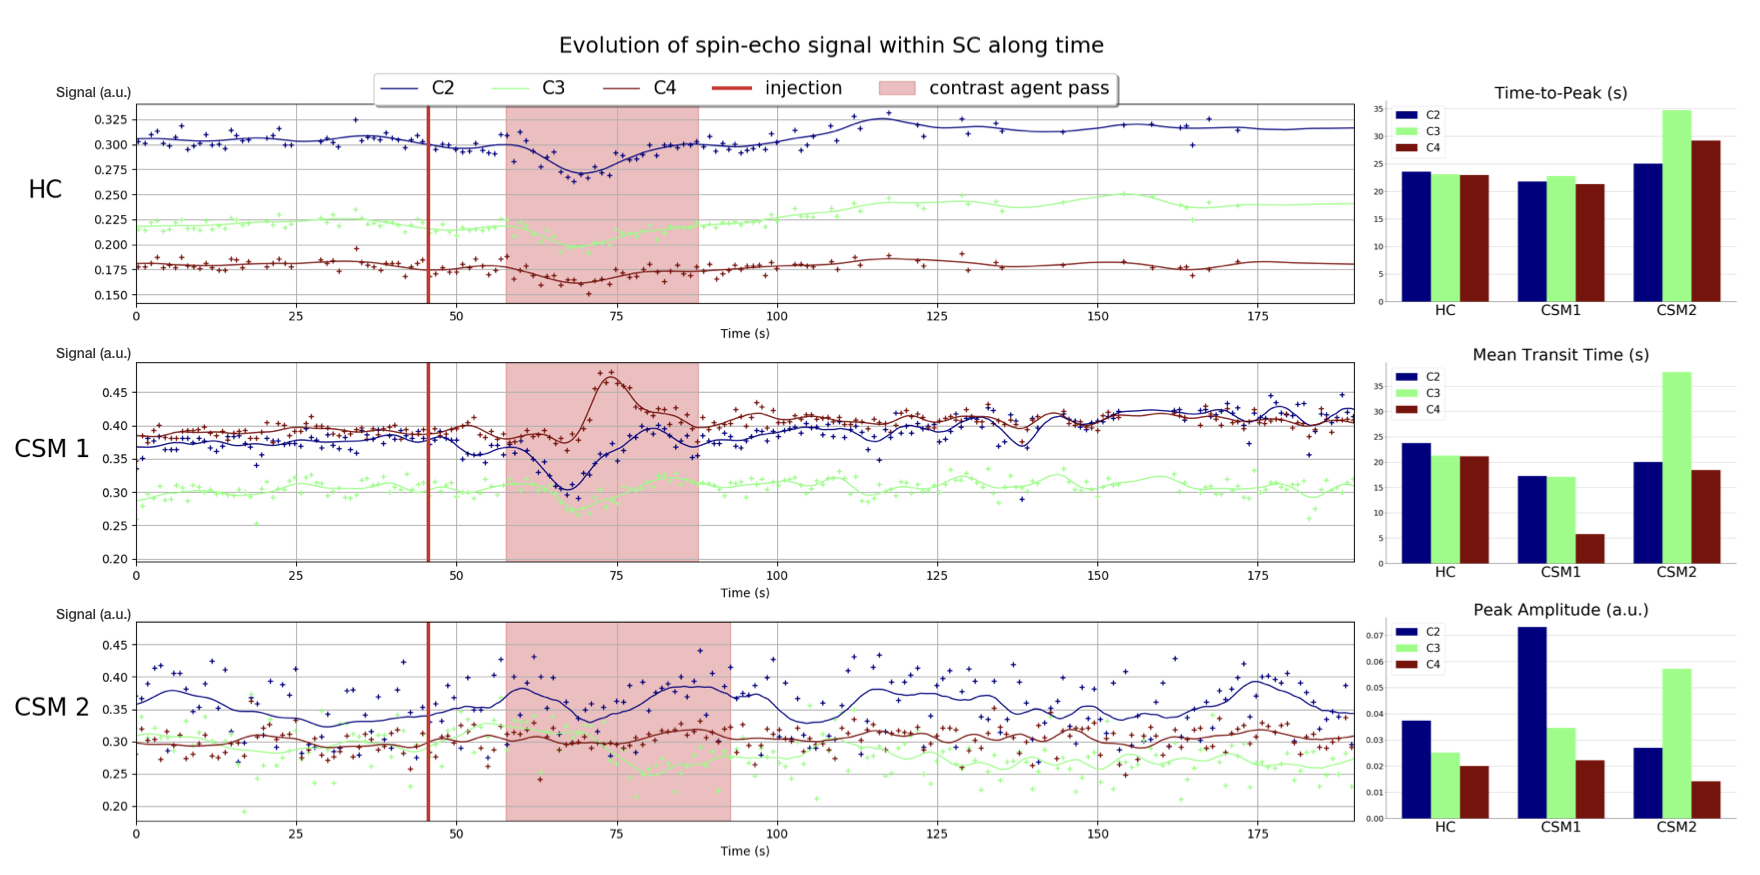
Breathing was correlated with the image displacement along the phase-encoding direction as measured by the motion correction algorithm (Fig.2a-b), in agreement with the breathing-induced frequency shift reported in SC16–18. However, a relation between breathing and mean signal in SC still existed after motion correction, suggesting an effect on frequency dispersion as well (Fig.2c-d).Gadolinium first pass could be observed on the 3 slices for HC and CSM1 (Fig.3). It was less visible in CSM2, probably due to an accumulation of disadvantageous conditions (32% of available signal used due to Specific-Absorption-Rate limitations, large motion during acquisition, larger B0 inhomogeneity). Despite the B1+ normalization, peak amplitude decreased with lower level.
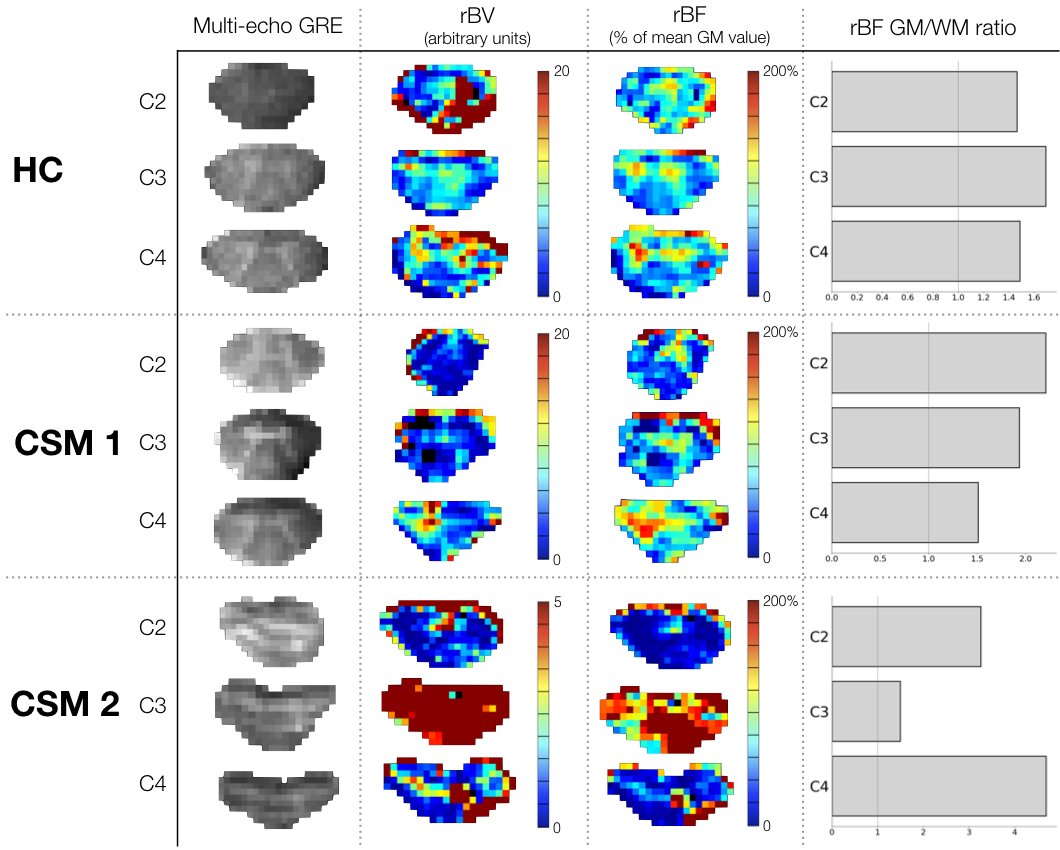
rBV and rBF maps revealed higher values within GM compared to white matter (WM) for all slices (Fig.4), in agreement with normal perfusion distribution in human brain19,20 and mice SC3,21. However, comparison between HC and CSM patients could not be carried out further because extracted AIF was not consistent (too wide or late compared to tissue curve, Fig.5) to allow absolute quantification, and percentage of available signal used was unequal across subjects (Fig.1).
Conclusion & Perspectives
This is, to our knowledge, the first DSC study at 7T. Perfusion maps discriminating between SC WM and GM perfusion on single-slice and single-subject basis were successfully obtained, included in patients with large Body Mass Index. However, this study remains investigative. Several issues related to ultrahigh field (B1+, image distortions, Specific-Absorption-Rate limitations) and to SC (AIF extraction) still need to be addressed to compare perfusion maps across subjects. More subjects will be included shortly.Acknowledgements
The authors would like to particularly thank Stanislas Rapacchi and Tangi Roussel for useful discussions, as well as Lauriane Pini, Claire Costes, Patrick Viout, Véronique Derderian and Christophe Vilmen for study logistics.
This project has received funding from the European Union’s Horizon 2020 research and innovation program under the Marie Skłodowska-Curie grant agreement No713750. It has been carried out with the financial support of the Regional Council of Provence-Alpes-Côte d’Azur and of the A*MIDEX (n° ANR-11-IDEX-0001-02, 7T-AMI-ANR-11-EQPX-0001, A*MIDEX-EI-13-07-130115-08.38-7T-AMISTART), funded by the Investissements d'Avenir project funded by the French Government, managed by the French National Research Agency (ANR). Finally, it was conducted within a laboratory member of FLI network (grant ANR-11-INBS-0006).
References
1. Lévy, S. et al. Intra-Voxel Incoherent Motion at 7T to quantify human spinal cord microperfusion: pitfalls and promises. in Proceedings of the 27th annual meeting of the International Society for Magnetic Resonance in Medicine 0301.
2. Helenius, J. et al. Cerebral hemodynamics in a healthy population measured by dynamic susceptibility contrast MR imaging. Acta Radiologica 44, 538–546 (2003).
3. Duhamel, G., Callot, V., Cozzone, P. J. & Kober, F. Spinal cord blood flow measurement by arterial spin labeling. Magnetic Resonance in Medicine 59, 846–854 (2008).
4. Shen, Y. et al. T1 Relaxivities of Gadolinium-Based Magnetic Resonance Contrast Agents in Human Whole Blood at 1.5, 3, and 7 T. Investigative Radiology 50, 330–338 (2015).
5. Noebauer-Huhmann, I. M. et al. Gadolinium-Based Magnetic Resonance Contrast Agents at 7 Tesla: In Vitro T1 Relaxivities in Human Blood Plasma. Investigative Radiology 45, 554–558 (2010).
6. Noebauer-Huhmann, I. M. et al. MR Contrast Media at 7Tesla - Preliminary Study on Relaxivities. in Proceedings of the 16th annual meeting of the International Society for Magnetic Resonance in Medicine 1457 (2008).
7. Figley, C. R. & Stroman, P. W. Investigation of human cervical and upper thoracic spinal cord motion: Implications for imaging spinal cord structure and function. Magnetic Resonance in Medicine 58, 185–189 (2007).
8. Figley, C. R., Yau, D. & Stroman, P. W. Attenuation of Lower-Thoracic, Lumbar, and Sacral Spinal Cord Motion: Implications for Imaging Human Spinal Cord Structure and Function. American Journal of Neuroradiology 29, 1450–1454 (2008).
9. Kalsi-Ryan, S. et al. Ancillary Outcome Measures for Assessment of Individuals With Cervical Spondylotic Myelopathy: Spine 38, S111–S122 (2013).
10. Maggioni, M., Katkovnik, V., Egiazarian, K. & Foi, A. Nonlocal Transform-Domain Filter for Volumetric Data Denoising and Reconstruction. IEEE Trans. on Image Process. 22, 119–133 (2013).
11. Kellner, E., Dhital, B., Kiselev, V. G. & Reisert, M. Gibbs-ringing artifact removal based on local subvoxel-shifts. Magnetic Resonance in Medicine 76, 1574–1581 (2016).
12. Avants, B. B. et al. A reproducible evaluation of ANTs similarity metric performance in brain image registration. NeuroImage 54, 2033–2044 (2011).
13. Andersson, J. L. R., Skare, S. & Ashburner, J. How to correct susceptibility distortions in spin-echo echo-planar images: application to diffusion tensor imaging. NeuroImage 20, 870–888 (2003).
14. Peruzzo, D., Bertoldo, A., Zanderigo, F. & Cobelli, C. Automatic selection of arterial input function on dynamic contrast-enhanced MR images. Computer Methods and Programs in Biomedicine 104, e148–e157 (2011).
15. Wu, O. et al. Tracer arrival timing-insensitive technique for estimating flow in MR perfusion-weighted imaging using singular value decomposition with a block-circulant deconvolution matrix: Technique for Estimating CBF in PWI. Magnetic Resonance in Medicine 50, 164–174 (2003).
16. Brooks, J. C. W. et al. Physiological noise modelling for spinal functional magnetic resonance imaging studies. NeuroImage 39, 680–692 (2008).
17. Verma, T. & Cohen-Adad, J. Effect of respiration on the B0 field in the human spinal cord at 3T: Effect of Respiration on B0 Field in Human Spinal Cord. Magnetic Resonance in Medicine 72, 1629–1636 (2014).
18. Vannesjo, S. J., Miller, K. L., Clare, S. & Tracey, I. Spatiotemporal characterization of breathing-induced B0 field fluctuations in the cervical spinal cord at 7T. NeuroImage 167, 191–202 (2018).
19. Schmainda, K. M. et al. Moving Toward a Consensus DSC-MRI Protocol: Validation of a Low–Flip Angle Single-Dose Option as a Reference Standard for Brain Tumors. American Journal of Neuroradiology 40, 626–633 (2019).
20. Alsop, D. C. et al. Recommended implementation of arterial spin-labeled perfusion MRI for clinical applications: A consensus of the ISMRM perfusion study group and the European consortium for ASL in dementia: Recommended Implementation of ASL for Clinical Applications. Magnetic Resonance in Medicine 73, 102–116 (2015).
21. Duhamel, G. et al. Mouse lumbar and cervical spinal cord blood flow measurements by arterial spin labeling: Sensitivity optimization and first application. Magnetic Resonance in Medicine 62, 430–439 (2009).
22. Massire, A. et al. High-resolution multi-parametric quantitative magnetic resonance imaging of the human cervical spinal cord at 7T. NeuroImage 143, 58–69 (2016).
Figures