1182
Spinal cord and brain DTI alterations in cervical spondylotic myelopathy (CSM)1NMR Research Unit, Queen Square MS Centre, Department of Neuroinflammation, University College London, London, United Kingdom, 2Institute of Medical Science, University of Toronto, Toronto, ON, Canada, 3Spinal Cord Injury Center Balgrist, University of Zurich, Zurich, Switzerland, 4NeuroPoly Lab, Institute of Biomedical Engineering, Polytechnique Montreal, Montreal, QC, Canada, 5Functional Neuroimaging Unit, CRIUGM, Université de Montréal, Montreal, QC, Canada, 6Krembil Research Institute, University Health Network, Toronto, ON, Canada, 7Department of Neurophysics, Wellcome Trust Centre for Neuroimaging, University College London, London, United Kingdom, 8Max Planck Institute for Human Cognitive and Brain Sciences, Leipzig, Germany, 9Department of Brain and Behavioural Sciences, University of Pavia, Pavia, Italy, 10Brain MRI 3T Center, IRCCS Mondino Foundation, Pavia, Italy
Synopsis
We explored diffusion tensor imaging (DTI) metrics along the corticospinal tract (CST) from the cervical cord to the motor cortex, measured using separate brain and cervical cord DTI protocols in healthy subjects and cervical spondylotic myelopathy (CSM) patients at two sites. Instead of looking at either brain or cord separately, here, we combine brain and cord measurements and examine how the CST is affected in CSM, in addition to exploring correlations with clinical measures. Statistically significant changes were observed between CSM and HC when comparing cord and brain CST data, demonstrating the sensitivity of CST metrics to cord pathology.
Introduction
The corticospinal tract (CST) is a white matter (WM) motor pathway starting at the cerebral cortex and terminating on lower motor neurons and interneurons in the spinal cord1. The lateral CST crosses the midline in the medulla oblongata, and controls the limbs and digits, whereas the ventral division stays on the same side of the body and controls the trunk muscles. Quantitative MRI metrics in the CST are expected to be affected by cord pathology, including multiple sclerosis, amyotrophic lateral sclerosis, cervical spondylotic myelopathy (CSM), and spinal cord injury2. Diffusion Tensor Imaging (DTI) provides indices thought to be sensitive to tissue microstructural abnormalities, including fractional anisotropy (FA), mean diffusivity (MD), and axial and radial diffusivities (AD and RD), which can be related to specific aspects of tissue damage/repair, e.g. demyelination and axonal loss. Previous DTI studies have investigated changes in either the brain or cord CST separately. Here we characterise brain and cord measurements obtained from separate cord and brain DTI protocols, but during the same scanning visit, in healthy controls (HC) and CSM patients, acquired as part of a multi-centre study involving two different sites.Methods
MRI Acquisition:At two sites the following subjects were scanned using a 3T Siemens Skyra Fit (Siemens Healthineers, Erlangen, Germany), with a 16-channel head and neck coil:
Site 01: 8 HC [3F, age 37.3±15.9 years (mean ± standard deviation (SD))], 9 CSM (5F, 64.8±12.3);
Site 02: 8 HC (1F, 43.5±12.9), 17 CSM (6F, 53.6±8.9).
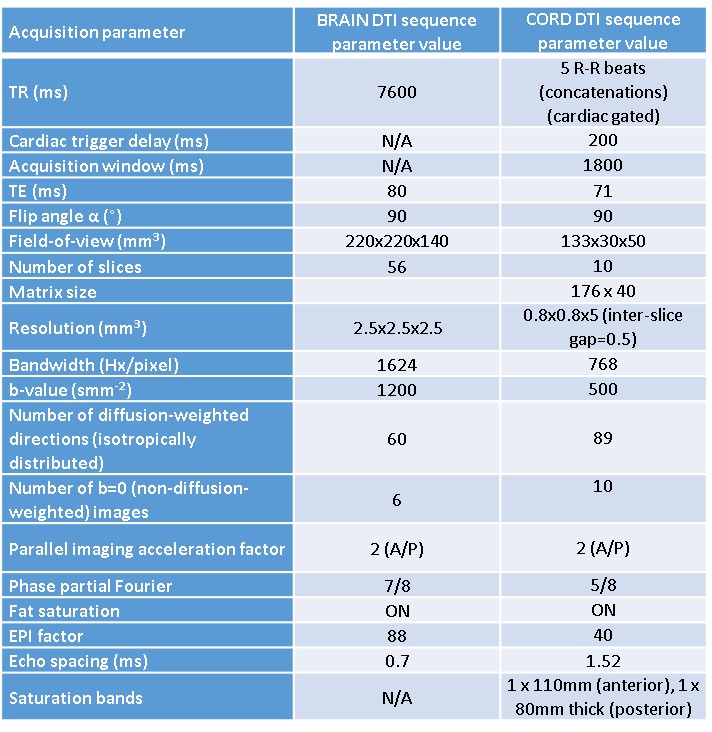
The same whole brain and cervical cord (covering levels C2-C5) DTI protocols were performed at both sites; acquisition parameters are given in Table 1.
Image Analysis:
Brain DTI data (processed using DIPY3) were co-registered to MNI space using NiftyReg4,5 and downsampled to give 5mm segments in the foot/head direction, from the bottom of the pons upwards. The JHU-ICBM WM tract atlas6 was used to identify the CST in the brain. Similarly, cord DTI data (processed using the spinal cord toolbox (SCT)7 (version 4.0.1)) were transformed to the PAM50 template space8, and the CST obtained using SCT was used to mask DTI parameter maps, similarly downsampled to give 5mm sections along the foot/head direction. In the cord, the left ventral and right lateral CST, and similarly right (R) ventral and left (L) lateral CST were combined.
Clinical testing:
In CSM patients mJOA9, DASH10 and GRASSP11 tests were performed.
Statistical analysis:
Between-group whole brain/cord CST differences were tested via one-way ANCOVA, and whole brain/cord and partial correlations were explored, with age and gender included as covariates, using IBM SPSS for Windows, v22.0.
In order to investigate slicewise differences between patients and controls in the cord, mixed effects models, which accounted for all the available information, i.e. using the information from all the slices obtained, were used (using stata (https://www.stata.com)).
Results
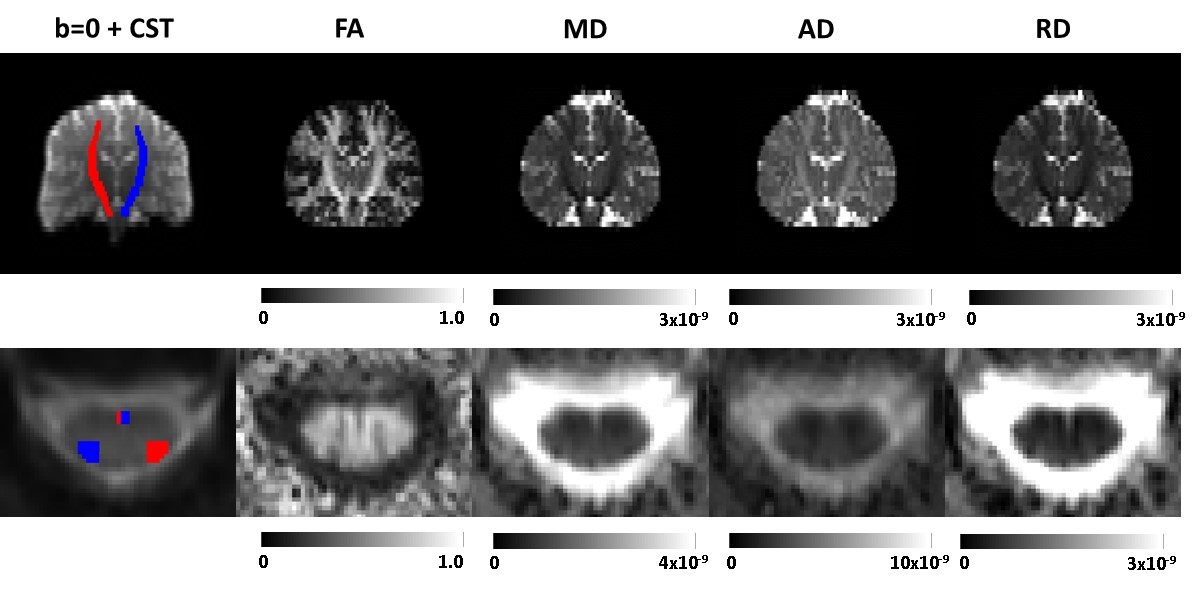
Example single slice brain and cord images with L/R CST overlaid for a HC are shown in Figure 2.Data from both sites were pooled since no significant differences in whole brain/cord CST parameters were found in HC between sites.
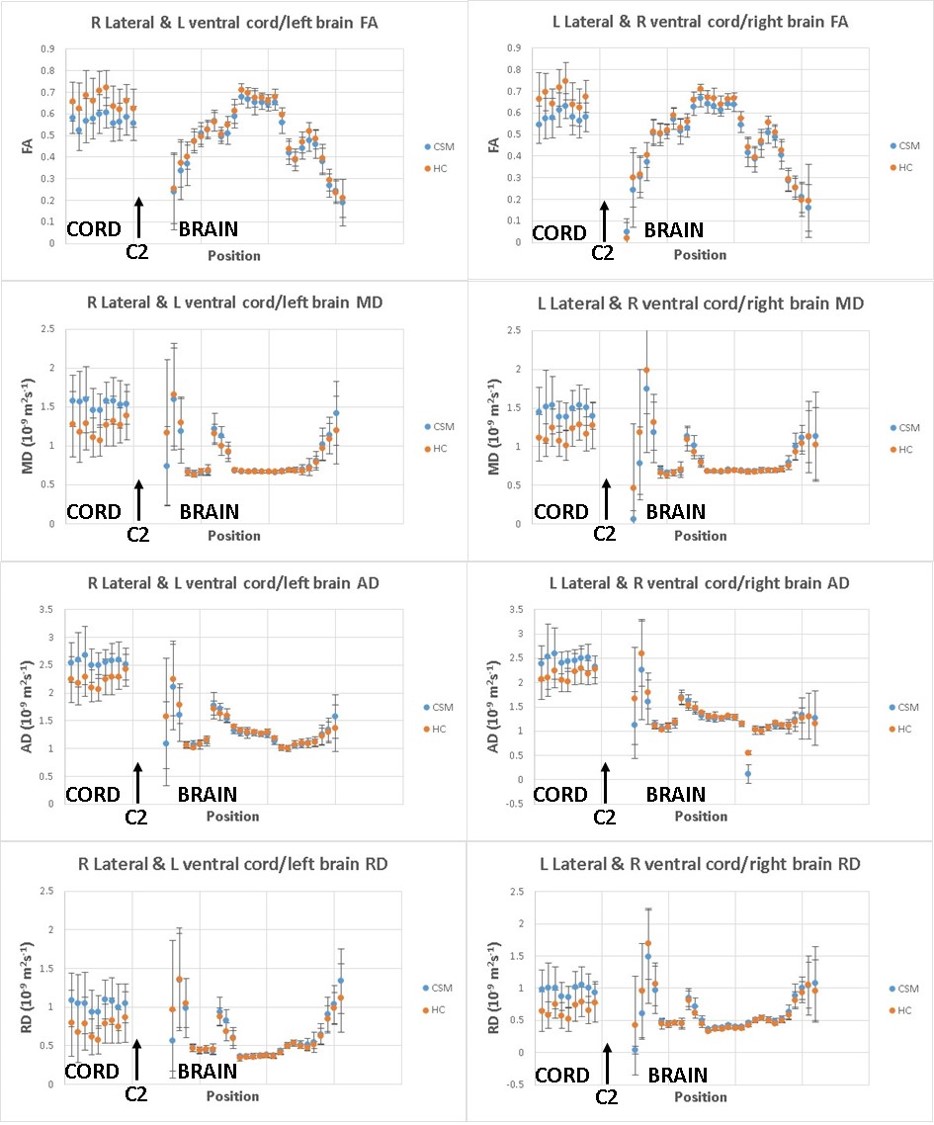
Mean DTI parameter values measured along the CST in the foot/head direction for both cord and brain in patients and HC are plotted in Figure 3 for both sites combined.
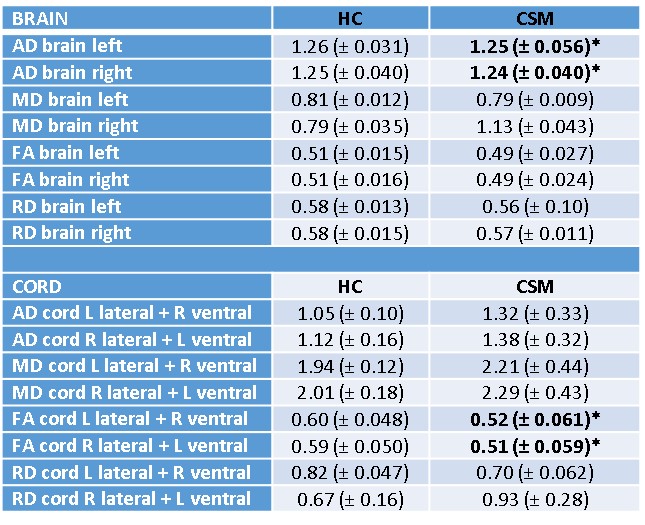
Whole cord and brain CST mean parameter values are given in Table 4.
In the whole cord L CST, FA was reduced from 0.60 in HC to 0.52 in CSM (p=0.025), and in the R cord CST FA was reduced from 0.59 in HC to 0.51 in CSM, and small but significant reductions in whole brain L (1.26 to 1.25 (p=0.044)) and R CST (1.25 to 1.24 (p=0.049) were observed.
Using mixed effects models in the cord, accounting for all information including all slices, FA was shown to be significantly reduced in patients (p=0.018).
No correlations with clinical measures were observed in the whole cord or brain L/R CST.
Discussion and Conclusions
We established a pipeline to extract the CST profile from the cervical spinal cord to the brain in standard space.Qualitatively, the profiles of all DTI parameters along both CSTs followed very similar patterns. However, some differences may be appreciated indicating areas where subjective variability may be higher, e.g. near the cortex/cord. Additionally the ages and genders of HC were not matched with CSM patients in both sites, although this was taken into consideration in the statistical analysis.
The higher DTI parameters observed in the cord compared to the brain could be due to the much lower b-value (500smm-2) used in the cord protocol12, in addition to the lower SNR of the protocol and potential residual physiological noise, although the protocol was cardiac-gated. Cord parameters were also more variable, possibly due to the lower protocol SNR.
Alterations of DTI parameters at different levels along the CST in CSM patients can be seen in figure 3.
Statistically significant changes were observed between CSM and HC when comparing cord and brain CST data, demonstrating the sensitivity of CST metrics to cord pathology.
Future studies will include applying similar methods to multi-parametric data acquired with identical protocols in the brain and cord, continuously across both structures, with potential applications in different cord pathologies, such as MS.
Acknowledgements
Acknowledgments to the UCL-UCLH Biomedical Research Centre for ongoing funding; the European Union’s Horizon 2020 research and innovation programme under grant agreement No. 634541, Spinal Research (UK), Wings for Life (Austria), Craig H. Neilsen Foundation (USA) (jointly funding the INSPIRED study), Wings for Life (#169111), the UK Multiple Sclerosis Society (grants 892/08 and 77/2017). Additionally, this project has received funding from the European Union's Horizon 2020 research and innovation programme under the grant agreement No 681094, and is supported by the Swiss State Secretariat for Education, Research and Innovation (SERI) under contract number 15.0137. We would also like to thank all the participants of the study.References
[1] Kolb, B. & Whishaw, I. Q. (2009). Fundamentals of human neuropsychology: Sixth edition. New York, NY: Worth Publishers;
[2] Gandini Wheeler-Kingshott, CAM et al Neuroimage 84:1082-93 (2014);
[3] Garyfallidis E et al. Frontiers in Neuroinformatics, vol.8, no.8
[4] Modat Met al. Comput Methods Programs Biomed. 2010; 98: 278-84.
[5] Ourselin S et al. Image and Vision Computing. 2001; 19: 25-31.
[6] Mori S et al. MRI Atlas of Human White Matter. Elsevier, Amsterdam, The Netherlands (2005)
[7] De Leener B et al NeuroImage 45(Pt A):24-43 (2017) ;
[8] De Leener B et al. NeuroImage 165 :170-79 (2018) ;
[9] Tetreault L et al Eur Spine J. 2017;26(1):78-84
[10] Beaton DE et al. J Bone Joint Surg Am. 2005;87(5):1038-46.
[11] Velstra IM et al. Neurorehabil Neural Repair. 2014: 28(7):632-42;
[12] Hui ES et al. Neuroimage 49(3): 2366-74 (2010)
Figures