1181
Structural MRI investigation caudal to degenerative cervical myelopathy: a clinical MRI application1Spinal Cord Injury Center, University Hospital Balgrist, University of Zurich, Zurich, Switzerland, 2Department of Neurophysics, Max Planck Institute for Human Cognitive and Brain Sciences, Leipzig, Germany, 3Wellcome Trust Centre for Neuroimaging, UCL Institute of Neurology, London, United Kingdom
Synopsis
Degenerative cervical myelopathy (DCM) is the most common form of non-traumatic spinal cord injury (SCI) and induces neurodegeneration in the cervical cord at and above the primary stenosis level. However, whether similar neurodegeneration occurs at the lumbar level remains unclear. We therefore applied high resolution T2*-weighted MRI in the lumbar cord in both DCM patients and healthy controls to investigate potential injury-induced structural changes. Significant atrophy was found in mild DCM patients and its magnitude was associated with sensory impairment.
Background
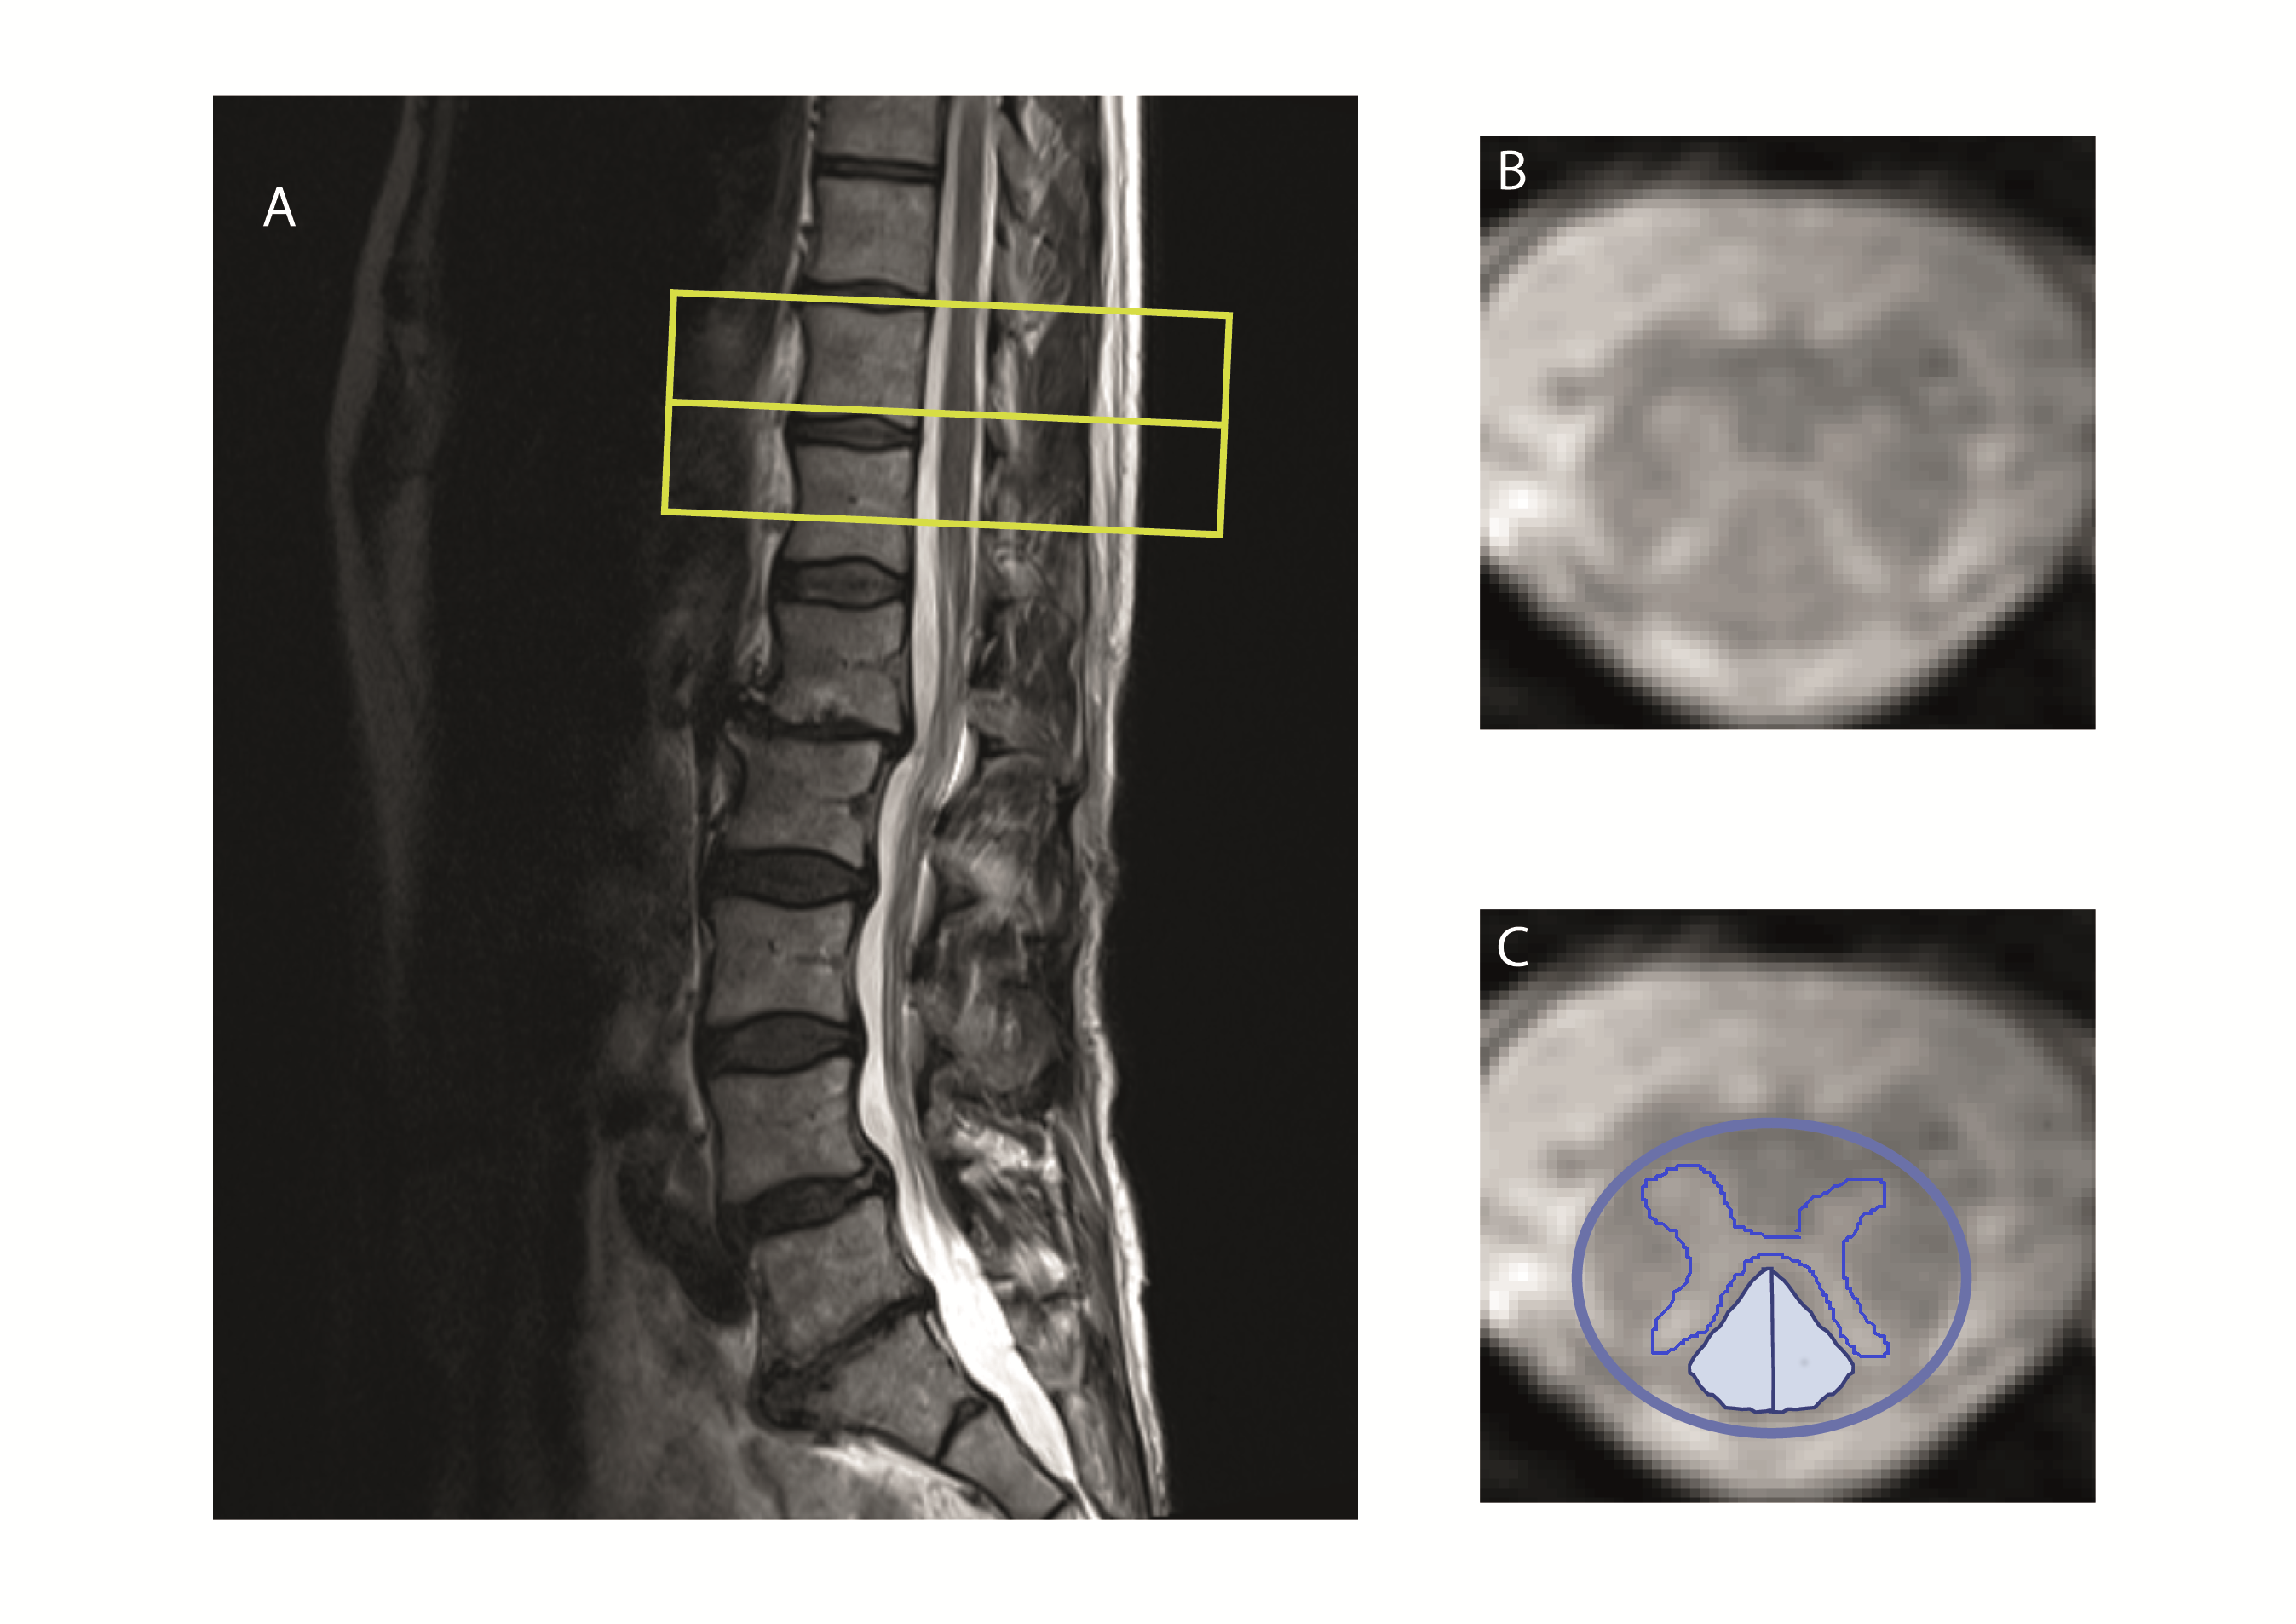
Degenerative cervical myelopathy (DCM), the most common form of non-traumatic spinal cord injury, leads to neurodegenerative changes1 above the stenosis in the cervical cord2 3 4 where sensory and motor tracts undergo anterograde and retrograde degeneration, respectively5. However, most of the previous studies have shown changes at or above the lesion level2 3 4 6 whereas neurodegeneration caudal to the lesion level (lumbar cord) has been investigated only in traumatic cervical myelopathy7. Therefore, this study aimed to investigate the DCM induced neurodegeneration in the lumbar cord (figure 1) and its clinical implications by means of structural MRI.Materials and methods
Twenty-five DCM patients (AIS C-E, mean age (±std) =54.9±10.8 years, 8 female) and 24 healthy controls (mean age (±std) =41.6±15.4 years, 4 female) were recruited. To assess macro-structural changes at lumbar level a T2*-weighted MRI was performed using 3D multi-echo GRE sequence perpendicular to the cord with a resolution of 0.5×0.5 mm2, FOV=192×162 mm2, slice-thickness=2.5 mm TR/TE=44/19 ms, and BW=260 Hz/pixel. Out of the 25 patients, 6 were excluded due to poor MRI quality. A subset of 17 patients additionally underwent the same MRI protocol at the cervical level (C2/3). All patients underwent clinical assessments including the International Standards for Neurological Classification of Spinal Cord Injury (ISNCSCI) protocol for motor score, light-touch, prinprick score and neurological completeness8, as well as the modified Japanese Orthopedic Association scale (mJOA) and the Nurick score9. Twenty-two patients presented with mild myelopathy (mJOA>14) and three patients with moderate myelopathy (mJOA = 12-14). We used Jim 7.0 software (IM 7.0, Xinapse systems) to measure cross-sectional spinal cord area (SCA), applying a semiautomatic 3D active-surface model. Total, ventral and dorsal grey matter areas (GMA, vGMA and dGMA, respectively) as well as total and dorsal white matter areas (WMA and dWMA, respectively) were calculated (figure 1). A subgroup of patients (n=11) underwent electrophysiological examination of sensory pathways by means of somatosensory evoked potential (SEP) from the tibial nerves, and time from the stimulation to the first positive peek of the primary cortical complex was recorded as P40 latency. Group comparisons were performed using statistical t test. Regression analysis was conducted adjusting for age and sex. The level of significance was set to p< 0.05.Results
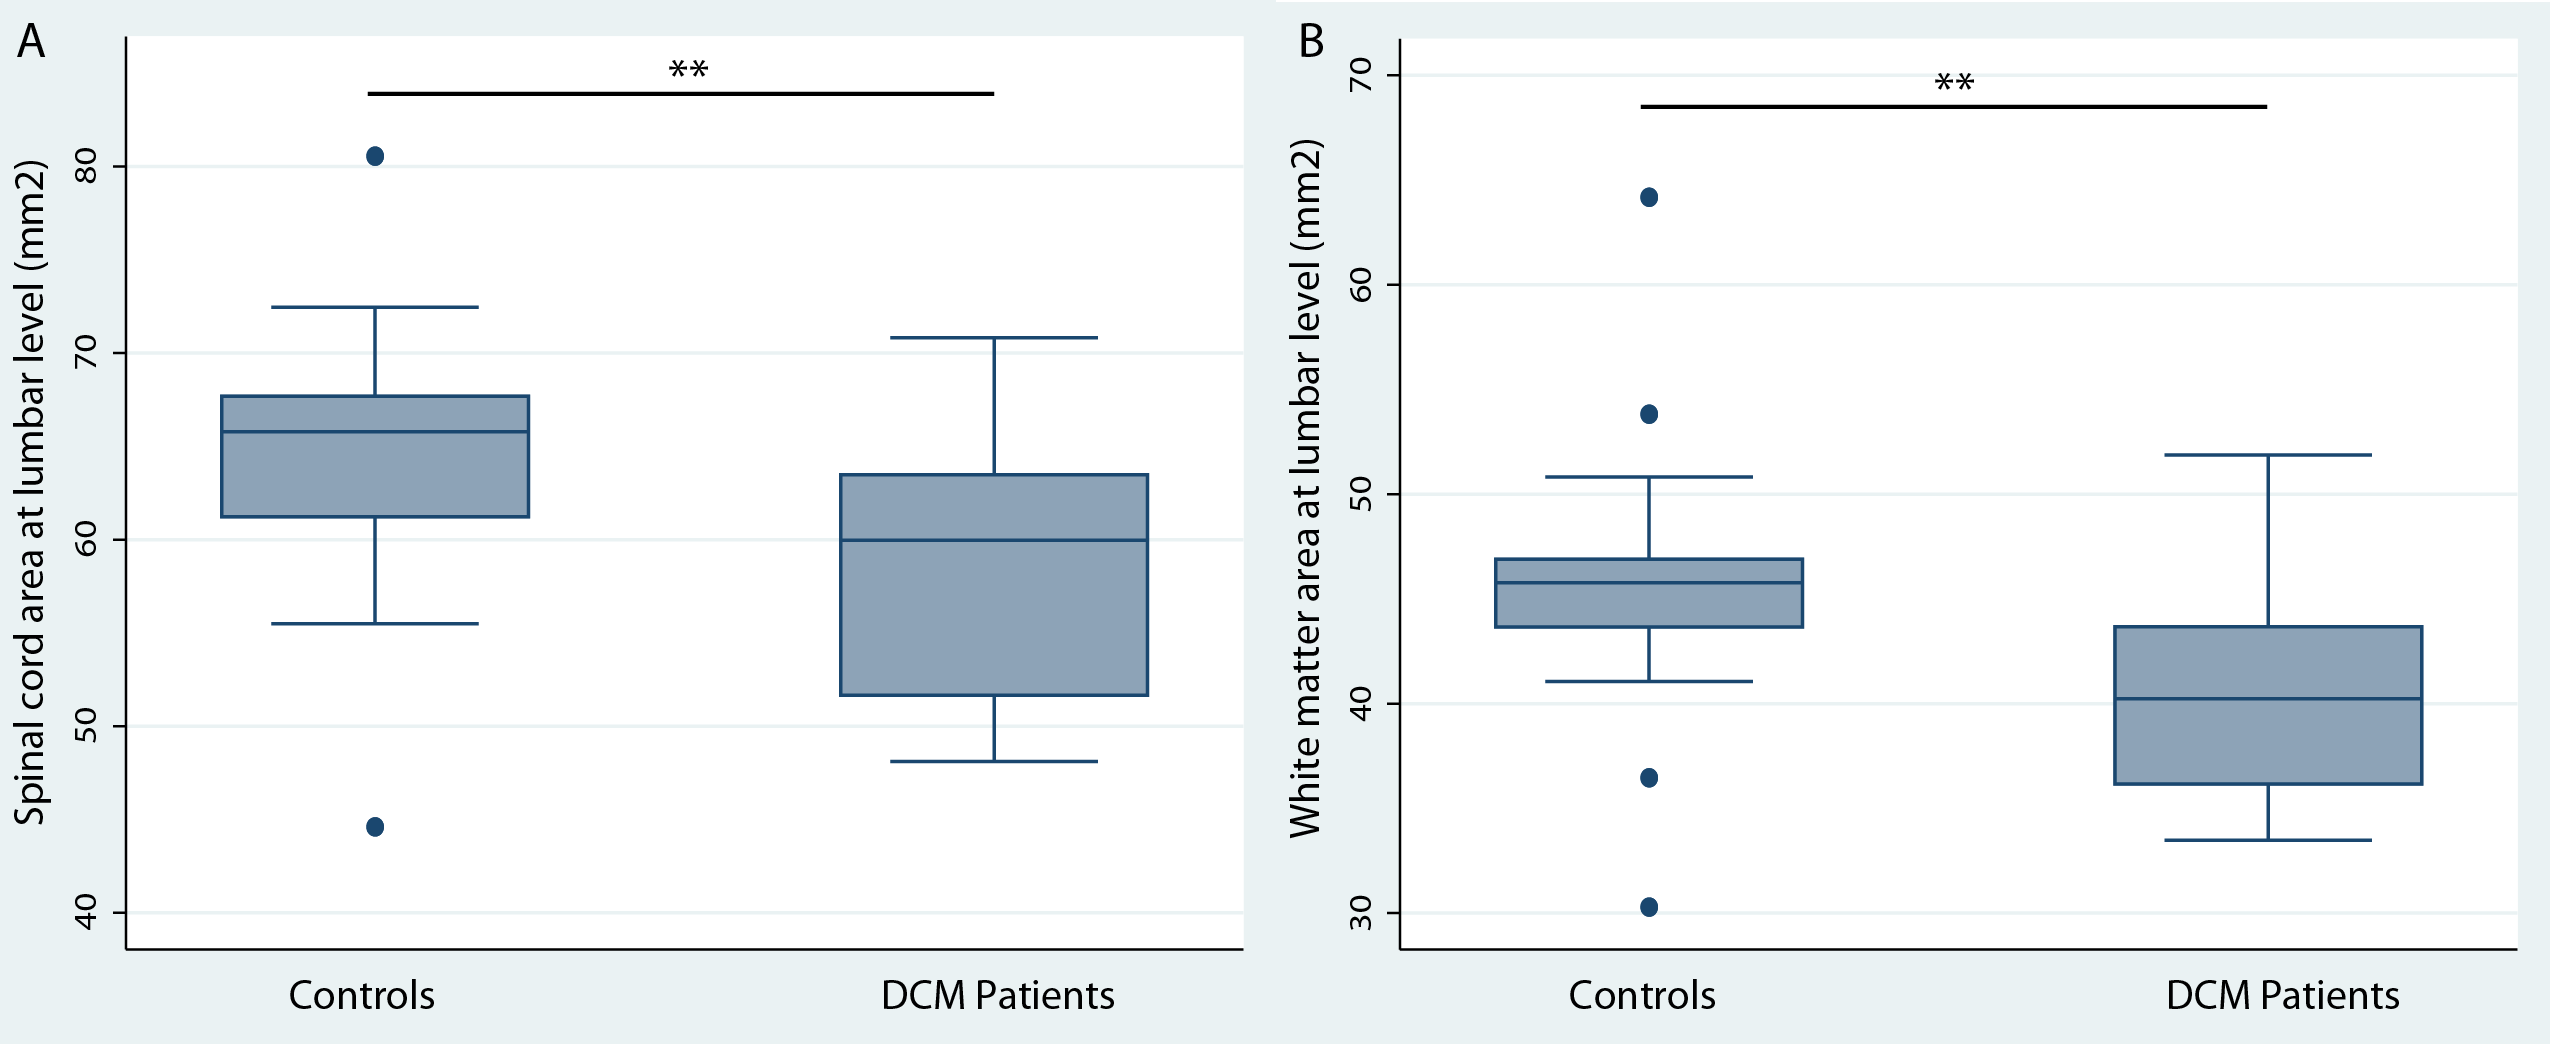
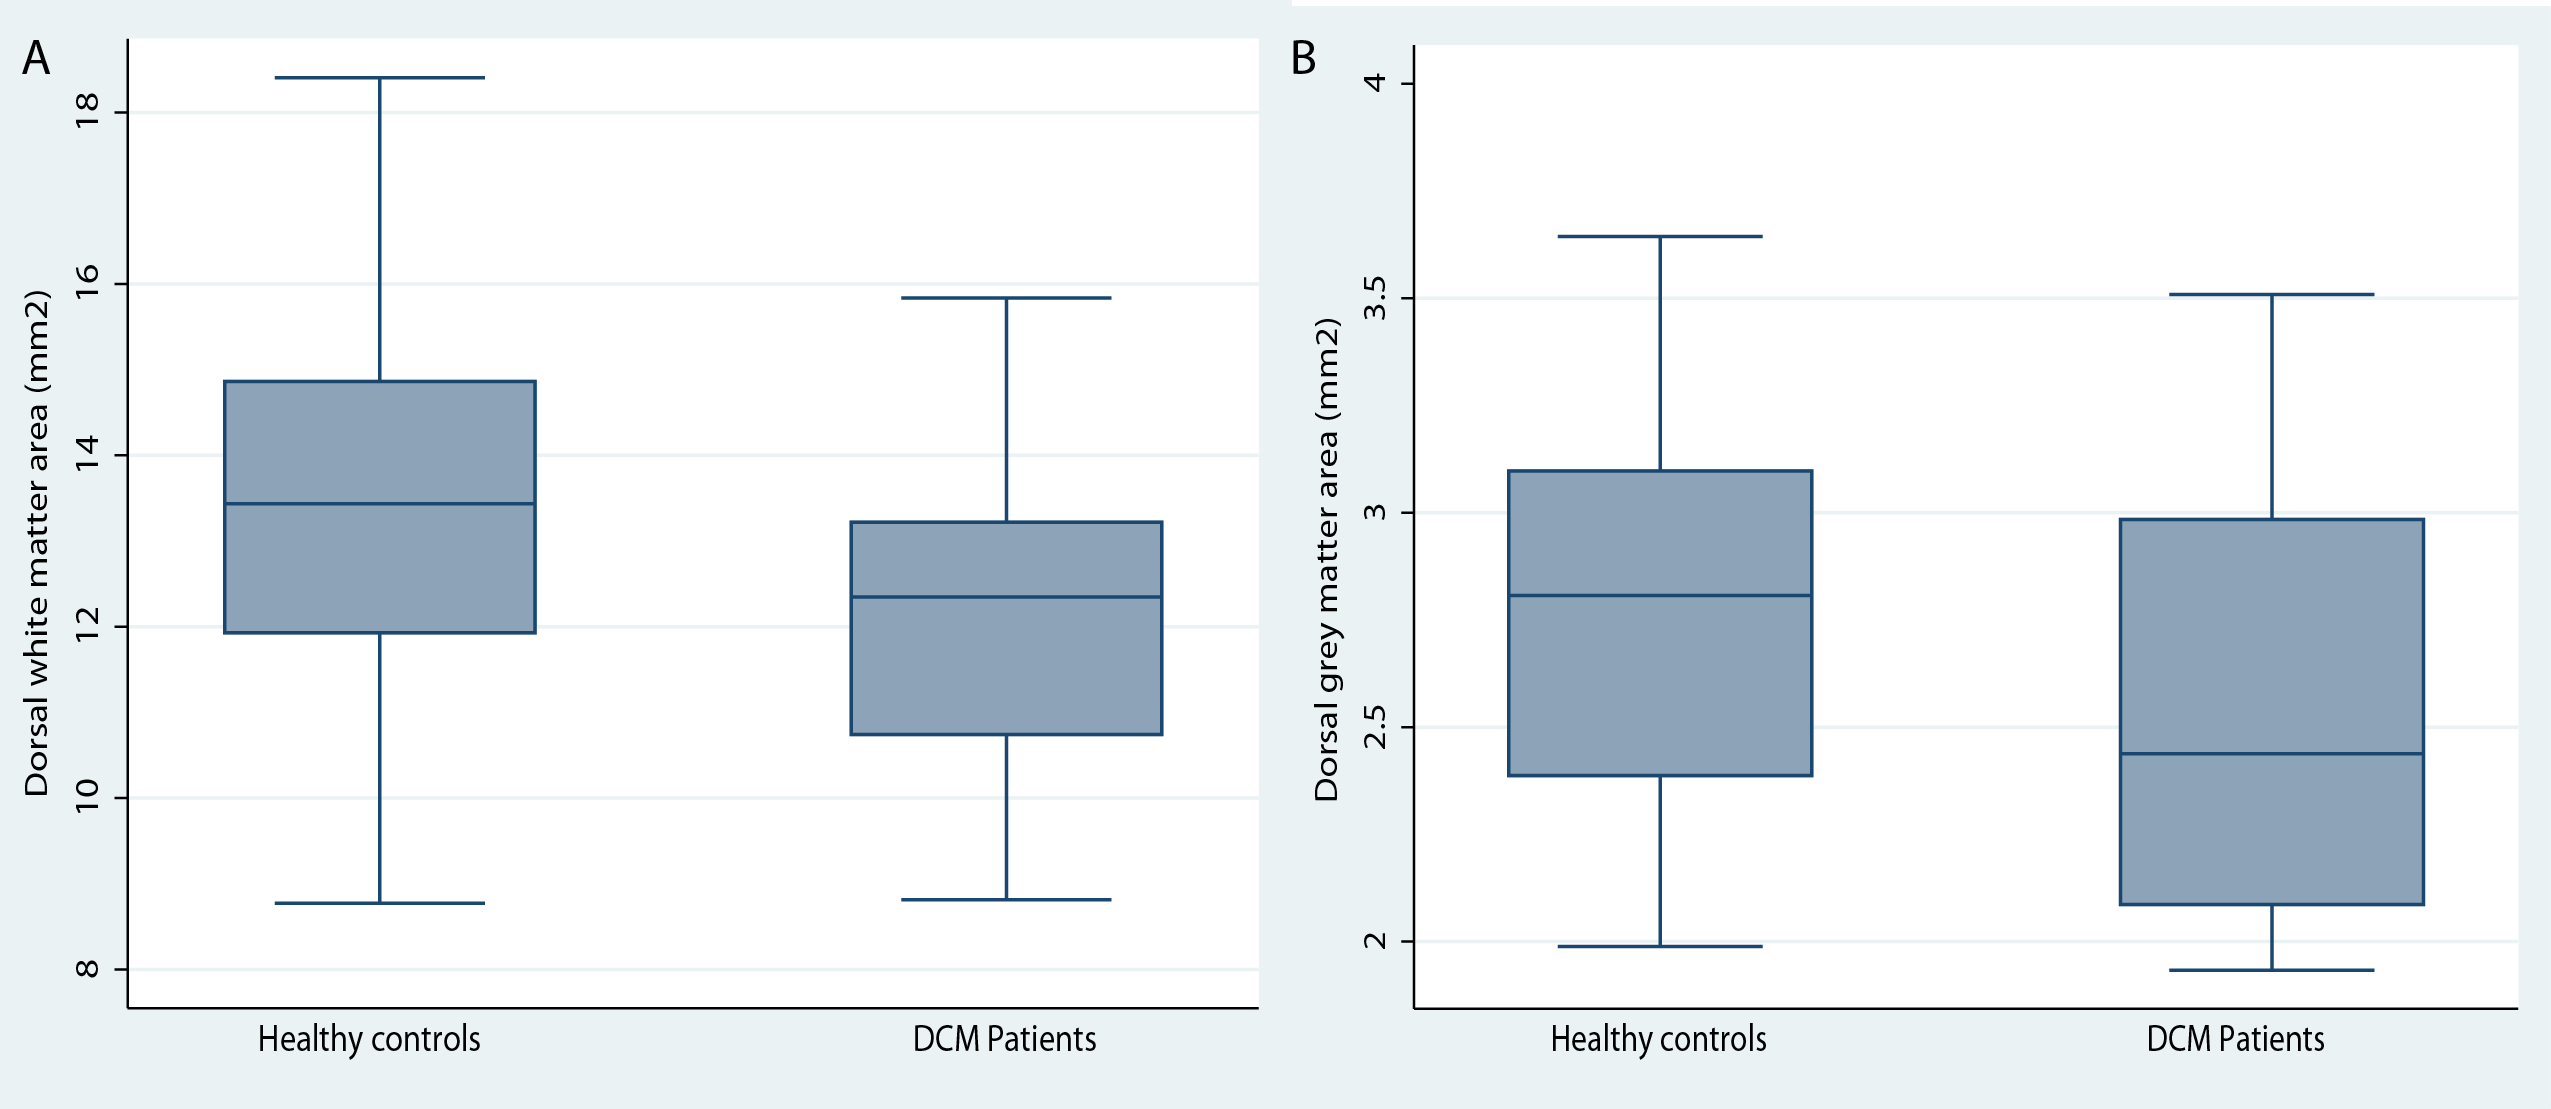
Significant lumbar cord atrophy (decreased spinal cord and white matter area) was observed in DCM patients compared to healthy controls (SCA: p<0.01, (mean±sd): 58.4±6 mm2 and 64.4±7 mm2, respectively) (WMA: p<0.01, (mean±sd): 40.5±5 mm2 and 45.8±6 mm2, respectively) (figure 2), whereas the difference in the grey matter area was not significant (17.9±3.4 mm2 and 18.6±2.9 mm2, respectively).White matter atrophy was associated with sensory outcome (light touch score: p<.001, correlation coef.=0.92; pinprick score: p=0.001, correlation coef=0.86) independent of cervical white matter area. Similarly, dorsal white matter area was associated with light-touch score (p=.048, correlation coef=0.5) and pinprick scores (p=.025, correlation coef=0.6).
Electrophysiological examinations showed P40 latency values of the tibial SEPs in the normal range (mean±SD: 42.6±3.2ms) and were not correlated with MRI or clinical measures.
Discussion and Conclusion
This study shows remote lumbar cord atrophy in mild DCM patients, which adds evidence that DCM induces neurodegeneration across the central nervous system. The cord atrophy may be mainly due to the white matter degeneration, as no significant changes were observed in the lumbar cord grey matter. Although, the DCM patients were mildly impaired and their electrophysiological measures were in normal range, remote neurodegeneration (i.e. lumbar cord atrophy) was captured by structural MRI and its magnitude was associated with sensory impairment of lower extremities. This suggests that macrostructural MRI readouts are sensitive to remote pathological changes in mild DCM patients and may become early predictors of the disease progression. Future studies applying microstructural MRI techniques (e.g. diffusion MRI) are still needed to investigate underlying mechanisms of the remote neurodegenerative changes.Acknowledgements
This study is supported by grants from Wings for life charity (INSPIRED) (No WFL-CH-007/14),References
1. Akter F, Kotter M. Pathobiology of Degenerative Cervical Myelopathy. Neurosurg Clin N Am 2018;29:13-19.
2. Grabher P, Mohammadi S, Trachsler A, et al. Voxel-based analysis of grey and white matter degeneration in cervical spondylotic myelopathy. Sci Rep 2016;6:24636.
3. Martin AR, De Leener B, Cohen-Adad J, et al. Can microstructural MRI detect subclinical tissue injury in subjects with asymptomatic cervical spinal cord compression? A prospective cohort study. BMJ Open 2018;8:e019809.
4. Martin AR, De Leener B, Cohen-Adad J, et al. Clinically Feasible Microstructural MRI to Quantify Cervical Spinal Cord Tissue Injury Using DTI, MT, and T2*-Weighted Imaging: Assessment of Normative Data and Reliability. AJNR Am J Neuroradiol 2017;38:1257-1265.
5. David G, Mohammadi S, Martin AR, et al. Traumatic and nontraumatic spinal cord injury: pathological insights from neuroimaging. Nat Rev Neurol 2019.
6. Ellingson BM, Salamon N, Woodworth DC, Holly LT. Correlation between degree of subvoxel spinal cord compression measured with super-resolution tract density imaging and neurological impairment in cervical spondylotic myelopathy. J Neurosurg Spine 2015;22:631-638.
7. David G, Seif M, Huber E, et al. In vivo evidence of remote neural degeneration in the lumbar enlargement after cervical injury. Neurology 2019;92:e1367-e1377.
8. Kirshblum SC, Burns SP, Biering-Sorensen F, et al. International standards for neurological classification of spinal cord injury (revised 2011). J Spinal Cord Med 2011;34:535-546.
9. Tetreault L, Kopjar B, Nouri A, et al. The modified Japanese Orthopaedic Association scale: establishing criteria for mild, moderate and severe impairment in patients with degenerative cervical myelopathy. Eur Spine J 2017;26:78-84.
Figures