1175
Towards minimal T1 and B1 contributions in cervical spinal cord inhomogeneous magnetization transfer imaging1Aix-Marseille Univ, CNRS, CRMBM, Marseille, France, 2APHM, Hopital Universitaire Timone, CEMEREM, Marseille, France, 3Aix-Marseille Univ, IFSTTAR, LBA, Marseille, France, 4iLab-Spine International Research Laboratory, Marseille-Montréal, France, 5Siemens Healthcare SAS, Saint-Denis, France
Synopsis
Inhomogeneous Magnetization Transfer (ihMT) is a promising MRI technique, sensitive to myelinated tissue that can be used to study demyelinating pathologies such as MS. But the conventional MT and ihMT ratio metrics could be sensitive to T1 and B1 variations, especially in the context of spinal cord imaging. In order to minimize these effects, this study focuses on 3D ihMT-RAGE sequence with high FA reference acquisition and ihMTR inverse metric computation. The quantifications within GM and WM along the cervical spinal cord demonstrate that this technique is promising for investigating SC pathologies.
Introduction
Inhomogeneous Magnetization Transfer (ihMT) is an MRI modality that can be made sensitive to myelinated tissue 1-4, hence bearing great potentials to study neurodegenerative diseases such as the demyelinating Multiple Sclerosis 5. Now largely applied in the brain 6-9, this technique has also been used to image cervical spinal cord (cSC). With the objective of exploring gray and white matter, 2D transverse imaging techniques such as single-slice HASTE 10, multi-slice SE EPI 11, and more recently 3D Rapid Acquisition Gradient Echo (RAGE) 12, which shows a better performance in investigating diffuse alterations along the whole cSC, have been proposed. However, in addition to ECG-synchronization to counteract pulsatile CSF effects around the cord and the consequent T1 relaxation variation that may occur, inhomogeneities in the transmit field (B1+) along the cord have to be considered. Recently, a new metric - namely ihMTR inverse – relying on an additional image with a high flip angle reference, has been proposed as an alternative to decrease B1 and T1 variations in the brain 13. In this work, we thus combined such an approach with a 3D ECG-triggered ihMT-RAGE acquisition, determined the conditions under which it can be used, and evaluated its feasibility for cSC WM/GM quantifications.Materials & Methods
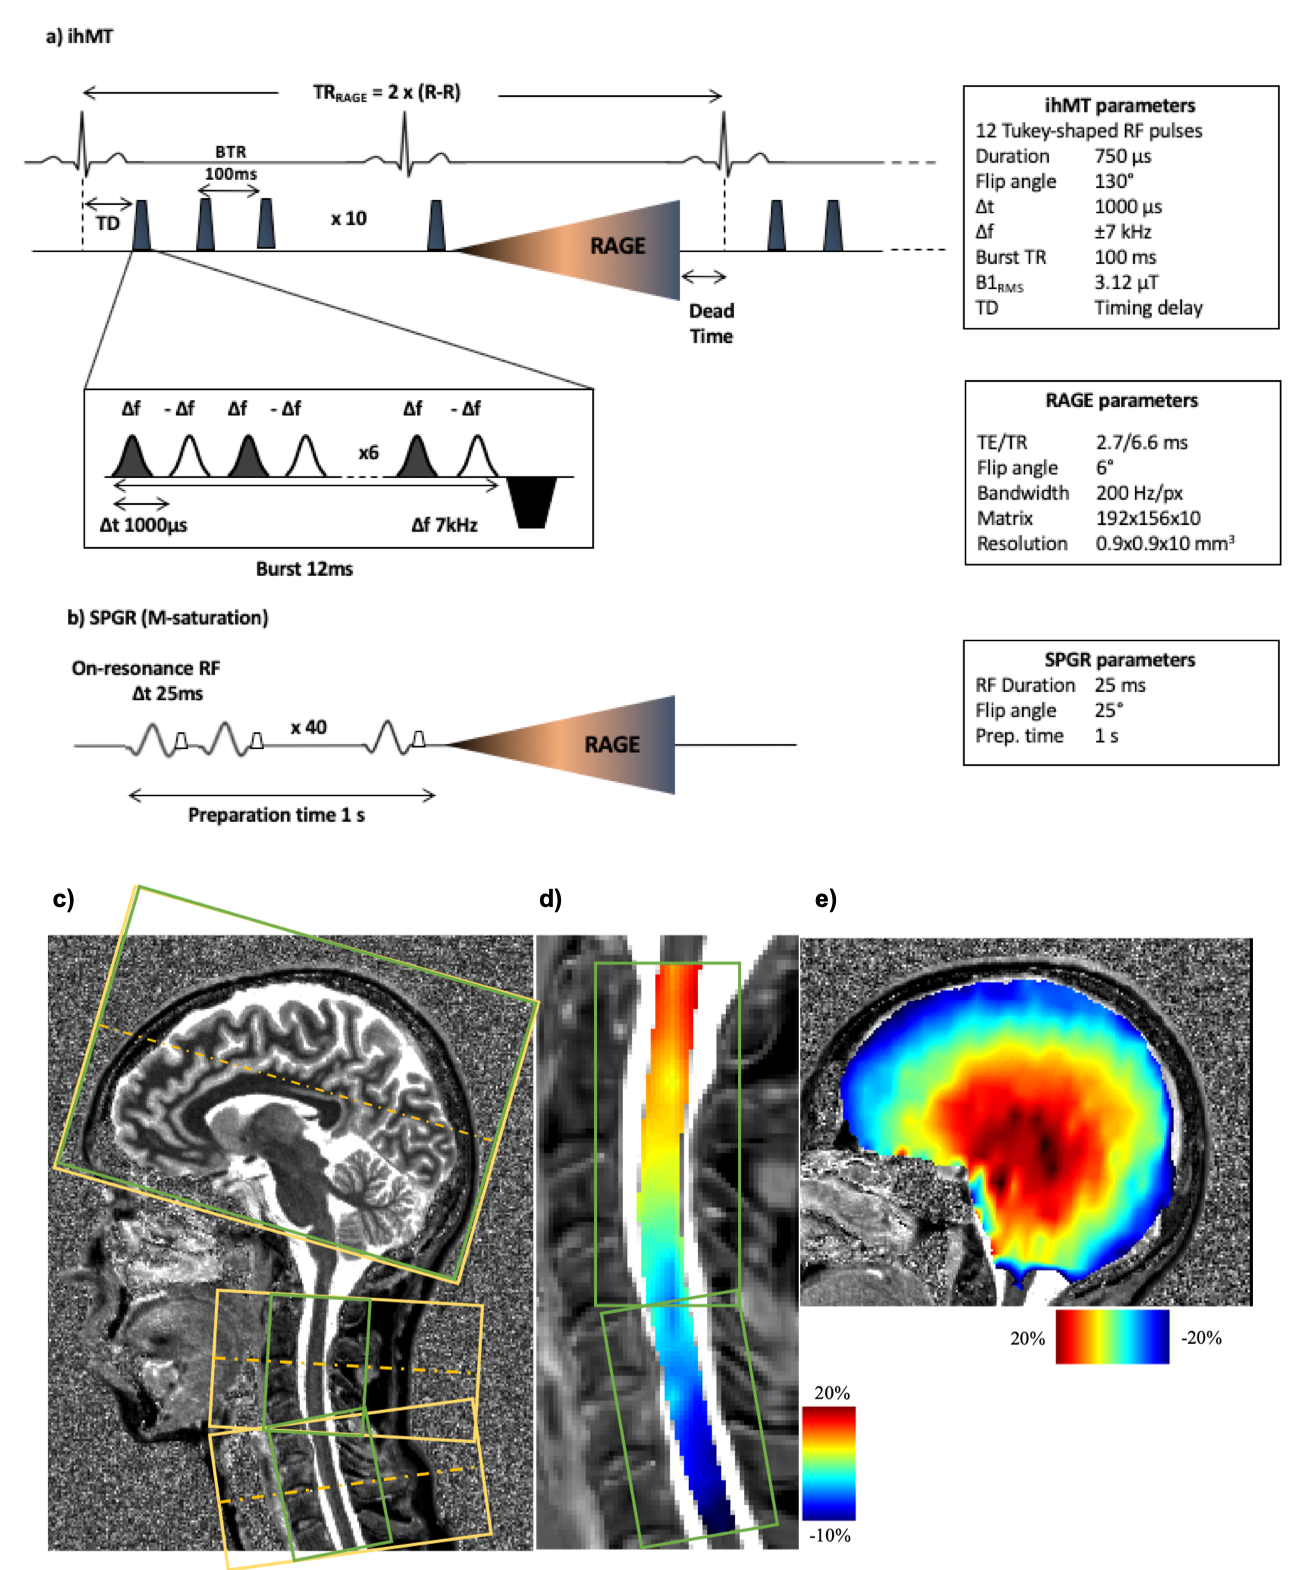
Experiments were performed on a 3T Siemens scanner using vendor head and neck coils and a centric-out 3D RAGE readout 12. Two ihMT preparations, one with a lower number of bursts and higher concentration of energy and the other with higher number of bursts and lower energy concentration, were initially tested. For the reference acquisition 13, Spoiled Gradient Echo (SPGR) RF-spoiled on-resonance pulses with 25 ms repetition time and FA of 25°, applied 40 times over 1s, were used. The sequence was first tested on brain (n=2 subjects, FOV 256 mm, 2 mm isotropic resolution) to avoid confounding physiological effects encountered in the cord. Intra-session reproducibility was first evaluated. For testing the metrics variation with regards to T1, the acquisitions were done with two different TRs of 2500 and 3000 ms, while keeping the preparation the same (increasing dead time at the end of the sequence by 500 ms, allowing longer T1 relaxation). For testing the sensitivity to B1, the reference voltage was changed to 70% and 110% of the original scan (-30% and +10% variation). ihMT and ihMT inv ratio maps were generated after Gibbs ringing artifact removal and motion correction (ANTs 14) of native images. Quantifications for the brain were done in the MNI 152 atlas space. The preparation with a lower energy concentration (10 bursts of Tukey shaped RF pulses, peak B1 of 20 μT, 1s total preparation), demonstrated better performance with regards to B1 and T1 variations (data not shown here) and seemed to drive the system towards steady state and therefore was applied for cSC investigations. The cSC was imaged with a spatial resolution of 0.9x0.9x10 mm3, with two slabs (C1-C4 and C4-C7) to reduce partial volume effect induced by the natural curvature of the cord, and to decrease the amount of B1 inhomogeneity along the scanning FOV (Figure 1). The preparation and read-out window for the sequence on SC was kept the same (1600 ms), but as the sequence was triggered with ECG, the effective TR depended on the subject’s heart rate. The data were motion corrected, the cord was extracted using Spinal Cord Toolbox (SCT 15) and the segmentation of WM and GM was done manually on the contrasted MT dual maps. BM4D 16 was used for Rician denoising on ihMTR and ihMTRinv maps. B1 and T1 map acquisitions were additionally performed for both brain and cord explorations.Results & discussion
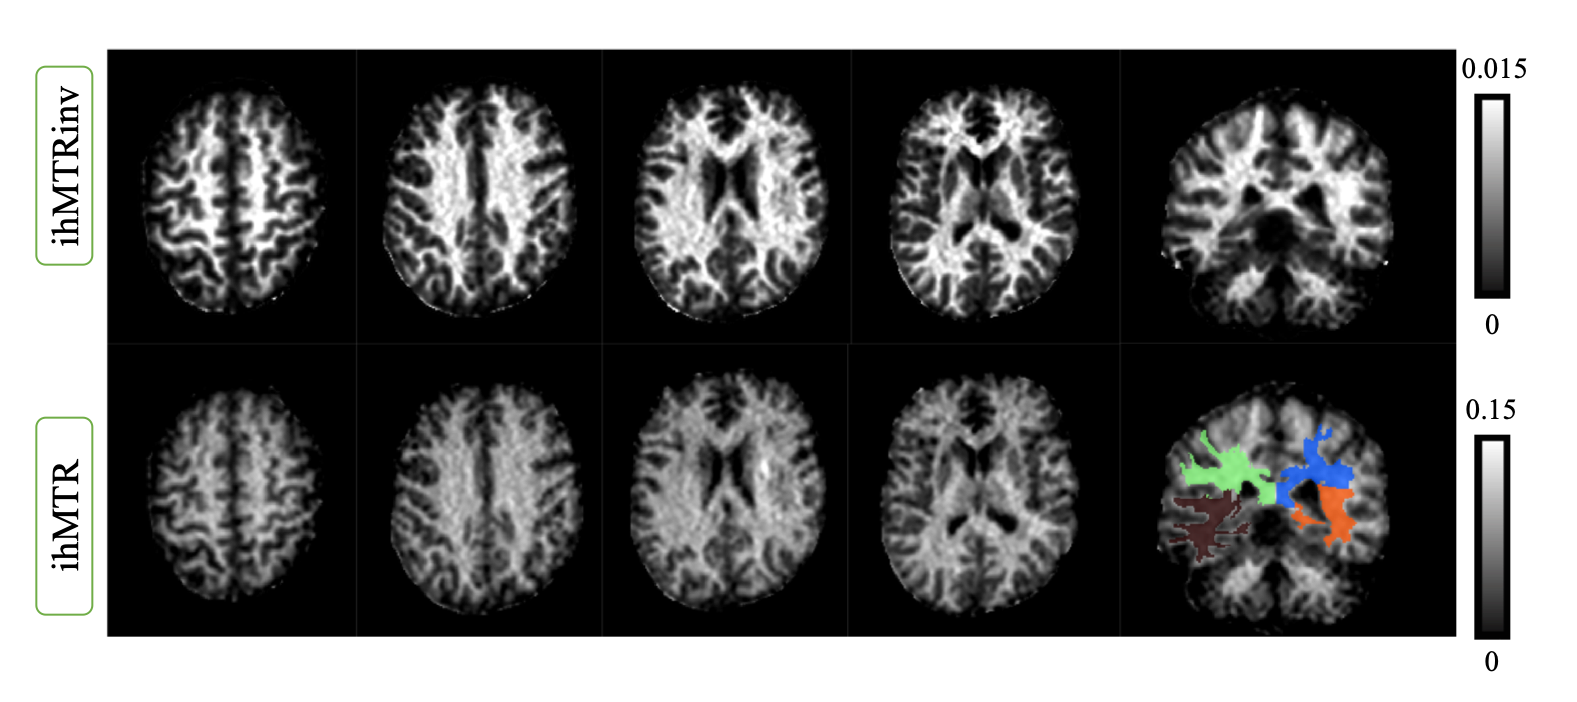
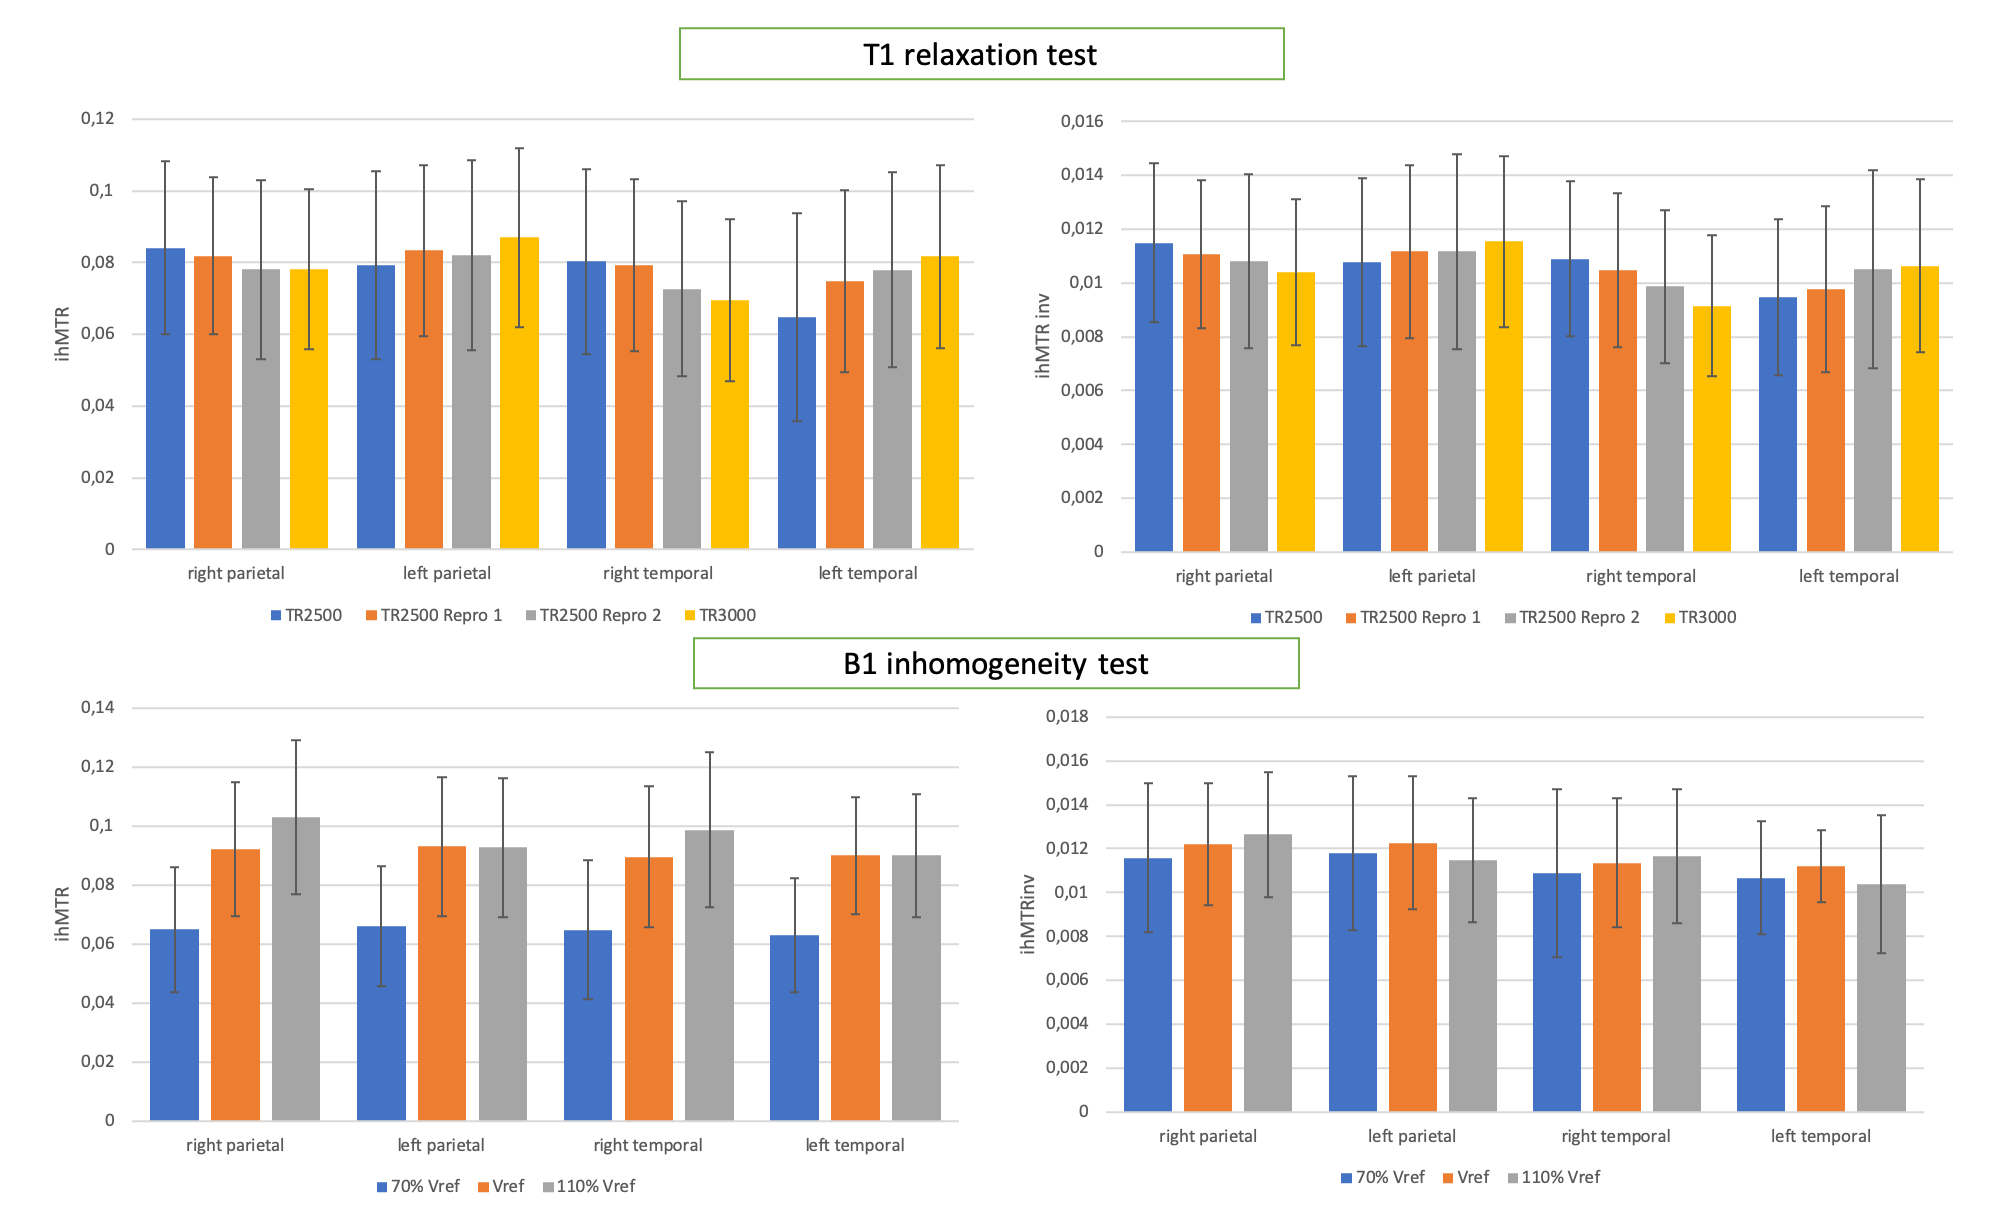
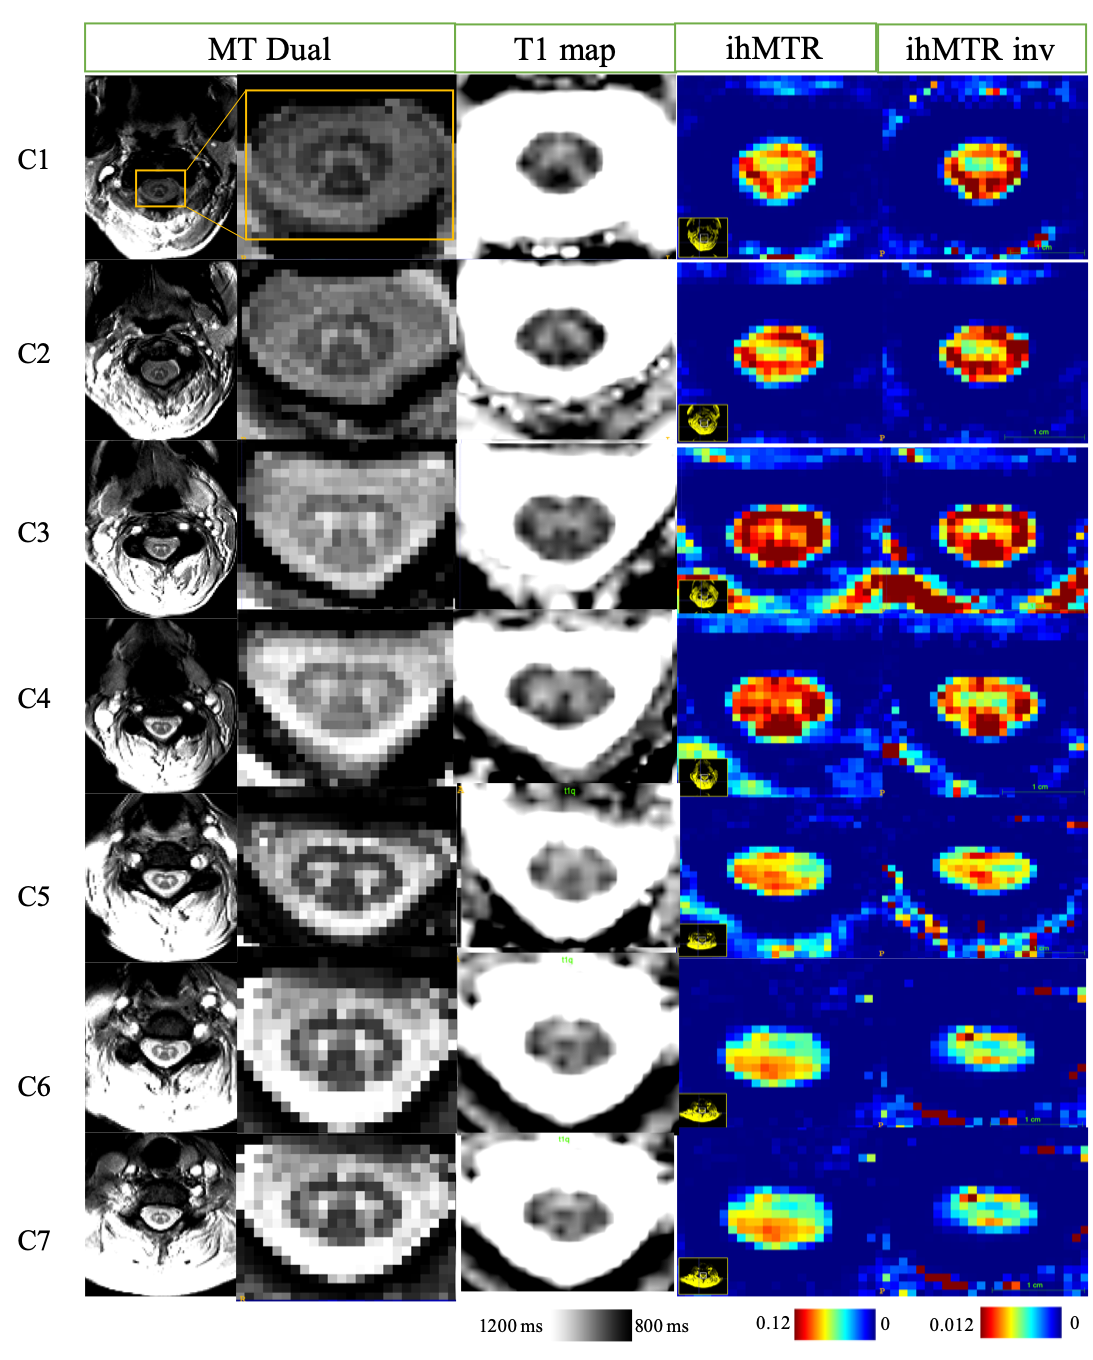
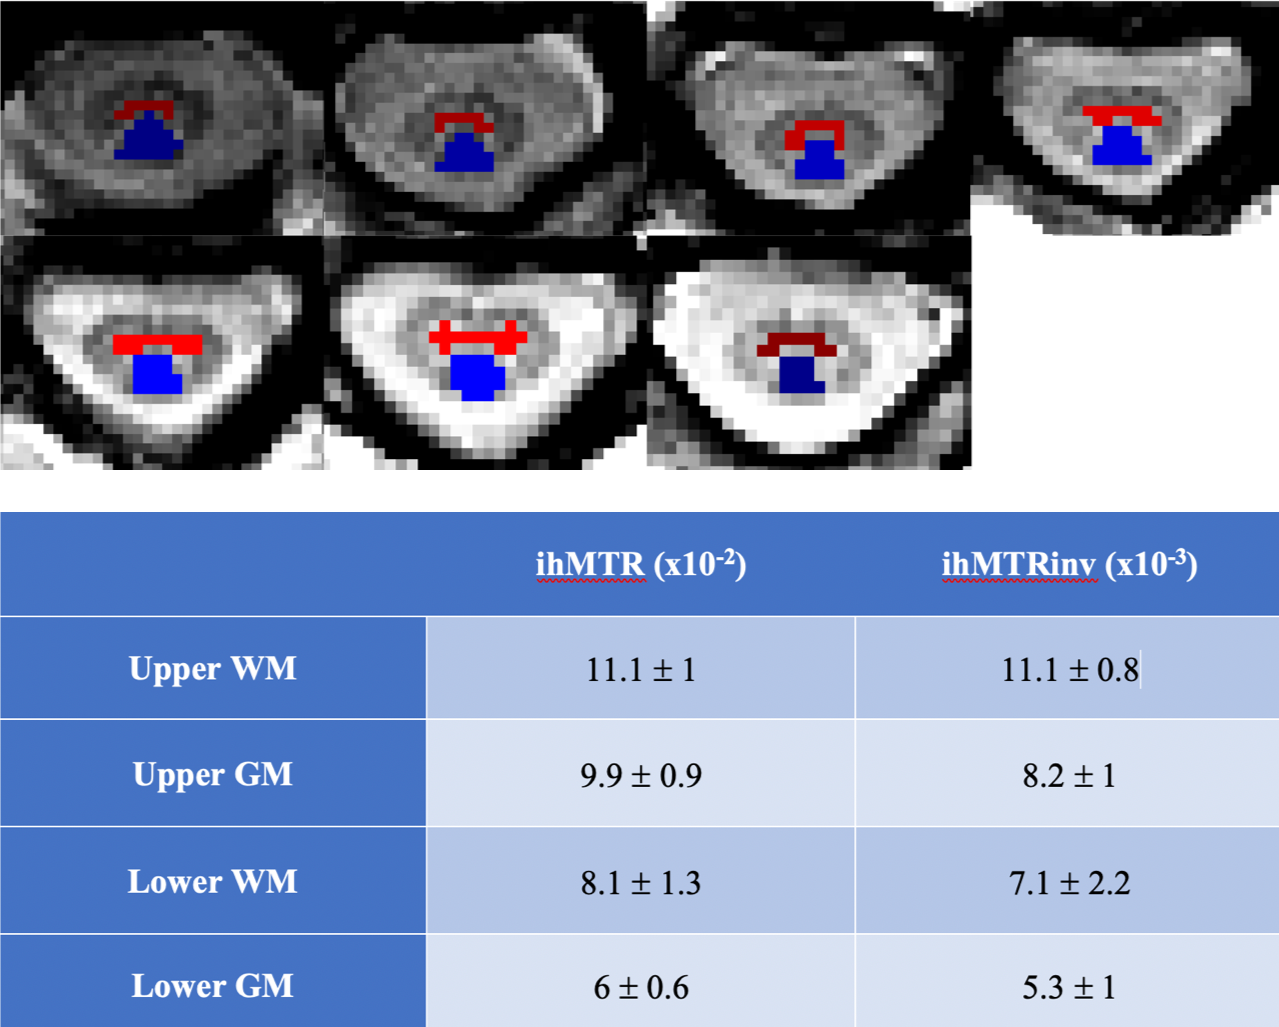
Figure 2 shows representative ihMTR and ihMTRinv maps obtained on brain. The results for the intra-session reproducibility, B1 and T1 immunity tests on 4 different brain ROIs for one subject are shown on figure 3. Altogether, the results indicate that with this ihMT-RAGE sequence, both ihMTR and ihMTRinv metrics were quite immune to the range of tested T1 variations, with metric variations well within the reproducibility error (COV for ihMTR was 1.6% and 0.6% for ihMTRinv). Regarding immunity to B1, ihMTR was observed to significantly vary with the reference voltage (COV=20%), whereas ihMTRinv did not change significantly (COV=2.6%) through the range of values investigated [-30%, +10%]. On SC, using 2 slabs, each positioned at the scanner isocenter, the amount of B1 variation along the cord did not exceed 20% (fig 1), ie. was within the “insensitive zone” previously determined from the brain. The mean values of ihMTR and ihMTRinv for GM and WM on upper (C1 to C4) and lower (C5 to C7) cervical levels for 2 healthy volunteers are demonstrated on Figure 5. It is seen that in the highly myelinated WM, the ihMTRinv metric is in average 35% higher than the anterior GM.Conclusion
A triggered 3D ihMT RAGE sequence with the newly introduced ihMTR inverse metric was experimentally shown to be robust to B1 and T1 variations. It also provided good delineation between cSC WM/GM, hence offering great perspectives to study demyelinating pathologies. Further work will focus on regional investigations on larger cohorts and applications in a pathophysiological context.Acknowledgements
This project has received funding from the European Union’s Horizon 2020 research and innovation programme under the Marie Skłodowska-Curie grant agreement No713750 and this work was performed by a laboratory member of France Life Imaging network (grant ANR-11-INBS-0006)References
1. Varma, G. et al. Interpretation of magnetization transfer from inhomogeneously broadened lines (ihMT) in tissues as a dipolar order effect within motion restricted molecules. J. Magn. Reson. 260, 67–76 (2015).
2. Girard, O. M. et al. Magnetization transfer from inhomogeneously broadened lines (ihMT): Improved imaging strategy for spinal cord applications. Magn. Reson. Med. 77, 581–591 (2017).
3. Girard, O. M. et al. Magnetization transfer from inhomogeneously broadened lines (ihMT): Experimental optimization of saturation parameters for human brain imaging at 1.5 Tesla. Magn. Reson. Med. 73, 2111–2121 (2015).
4. Duhamel, G. et al. Validating the sensitivity of inhomogeneous magnetization transfer (ihMT) MRI to myelin with fluorescence microscopy. Neuroimage 199, 289–303 (2019).
5. Van Obberghen, E. et al. Inhomogeneous Magnetization Transfer (ihMT) in normal-appearing tissue correlates with disability of multiple sclerosis patients. Neurology (2017).
6. Mchinda, S. et al. Whole brain inhomogeneous magnetization transfer (ihMT) imaging: Sensitivity enhancement within a steady-state gradient echo sequence. Magn. Reson. Med. 79, 2607–2619 (2018).
7. Ercan, E. et al. Microstructural correlates of 3D steady-state inhomogeneous magnetization transfer (ihMT) in the human brain white matter assessed by myelin water imaging and diffusion tensor imaging. Magn. Reson. Med. 80, 2402–2414 (2018).
8. Geeraert, B. L. et al. A comparison of inhomogeneous magnetization transfer, myelin volume fraction, and diffusion tensor imaging measures in healthy children. Neuroimage 182, 343–350 (2018).
9. Geeraert, B. L., et al. A multiparametric analysis of white matter maturation during late childhood and adolescence. Hum. Brain Mapp. (2019).
10. Taso, M. et al. Tract-specific and age-related variations of the spinal cord microstructure: A multi-parametric MRI study using diffusion tensor imaging (DTI) and inhomogeneous magnetization transfer (ihMT). NMR Biomed. 29, 817–832 (2016).
11. Rasoanandrianina, H. et al. A new rapid and high-resolution multi-slice inhomogeneous Magnetization Transfer protocol to evaluate diffuse and regional cervical cord myelination at 3T. ISMRM 2018
12. Troalen, T. et al. Cervical Spine inhomogeneous Magnetization Transfer ( ihMT ) Imaging Using ECG-Triggered 3D Rapid Acquisition Gradient-Echo ( ihMT-RAGE ). ISMRM 3–7 (2018).
13. Varma, G. et al. An inhomogeneous magnetization transfer ( ihMT ) quantification method robust to B1 and T1 variations in magnetization prepared acquisitions. ISMRM 2–5 (2019).
14. Avants, et. al Advanced normalization tools (ANTS). Insight j 2 (2009).
15. De Leener, B. et al. SCT: Spinal Cord Toolbox, an open-source software for processing spinal cord MRI data. Neuroimage 145, 24–43 (2017).
16. Maggioni, M., et. al A Nonlocal Transform-Domain Filter for Volumetric Data Denoising and Reconstruction. IEEE Trans. image Process. 1–15 (2012).
Figures