1171
Ex vivo MRI template of the human cervical cord at 80μm isotropic resolution1NeuroPoly Lab, Institute of Biomedical Engineering, Polytechnique Montreal, Montreal, QC, Canada, 2Centre for Advanced Imaging, The University of Queensland, Brisbane, Australia, 3Radiology department, College of applied medical sciences, Najran University, Najran, Saudi Arabia, 4Department of Computer and Software Engineering, Polytechnique Montreal, Montreal, QC, Canada, 5Faculty of Health Sciences, Curtin University of Technology, Perth, Australia, 6National Imaging Facility, Centre for Advanced Imaging, The University of Queensland, Brisbane, Australia, 7School of Biomedical Sciences, The University of Queensland, Brisbane, Australia, 8Functional Neuroimaging Unit, CRIUGM, Université de Montréal, Montreal, QC, Canada
Synopsis
Spinal cord MRI templates allow reproducible and large scale atlas-based studies. However, current templates may have suboptimal resolutions (~0.5mm isotropic) to analyse high resolution data acquired at ultra-high field (e.g. 7T scanners). We generated a 3D human cervical cord template at 80µm isotropic resolution, from 13 ex vivo specimens, with a reference based on spinal levels. Further, the template was registered to the existing in vivo PAM50 template. Results showed consistency with histological studies in terms of grey matter morphology, and template generation achieved high accuracy (mean distance error: 0.10±0.01mm). The template and related scripts will be made publicly available.
Introduction
MRI templates provide a reproducible and standardized way to process and analyse large amounts of data, while mitigating effects of inter- and intra-rater variability 1,2. Spinal cord MRI templates have been successfully developed in recent years 3–5. The resolution of these in vivo templates are however limited around to 0.5mm isotropic, which hampers a correspondence with histological descriptions of the anatomical spinal cord structure at microscopic resolution 6–8. The goal of this study was to generate a 3D human cervical cord template at 80µm isotropic resolution. Constructed from ex vivo data, this template, based on C2-C8 spinal levels, was registered to the existing in vivo PAM50 template 5 to enable atlas-based analysis with high-resolution data.Data
The cervical cord of 13 subjects (7 F / 6 M ; 76±13 years old, no known history of neurological disease) was obtained with a median post-mortem interval of 5 days (range: 2-10). Specimen procurement and preparation further detailed in 9. Imaging was performed on a Bruker 9.4T animal MR system (BioSpec 94/30 USR), running Paravision 5.1 (BrukerBiospin, Karlsruhe, Germany). Anatomical images were acquired using a 3D FLASH gradient echo sequence at 80μm isotropic resolution. Scan parameters included: TR=36ms, TE=8, 22ms, flip angle=24°, with an overall scan time of 1.5hours.Methods
Spinal levels: Manual labelling of the rostral and caudal extent of each nerve root was performed using the “3D rendered volume” tool of Osirix (v 5.8.5). Each spinal level was then identified by orthogonal projection of these labels onto the spinal cord centerline, as described in 10.Tissue segmentation: White and grey matter tissues were automatically segmented using a deep learning algorithm 11. For each subject, the network was trained on 20 randomly picked and manually segmented slices, then inferred on the ~1,000 remaining slices. Results were reviewed and manually corrected when needed (~5%).
Preprocessing: Based on the method described in 5, preprocessing steps included (i) generation of spinal cord centerline for each subject, (ii) computation of average template centerline, including spinal level alignment across subjects, in order to generate the initial template space, (iii) spinal cord straightening 12, (iv) intensity bias correction along the spinal cord axis.
Template generation: A non-linear image registration method, described in 13, was used to generate an unbiased right-left symmetric template. Transformations were constrained in the axial plane and followed a hierarchical approach: 16x8x4x2x1 shrink and blurring factors during 4x4x6x8x8 iterations. White and grey matter probabilistic maps were computed by averaging the registered masks of all subjects.
Registration to the PAM50 template: The generated template was registered to the PAM50 template 5 as described hereafter. The PAM50 template was up-sampled to 80µm isotropic and the spinal levels labelling was derived from the center of mass of probabilistic distributions 10. The ex vivo template was non-linearly registered along z using spinal level labels, followed by in-plane non-linear deformations (ANTs).
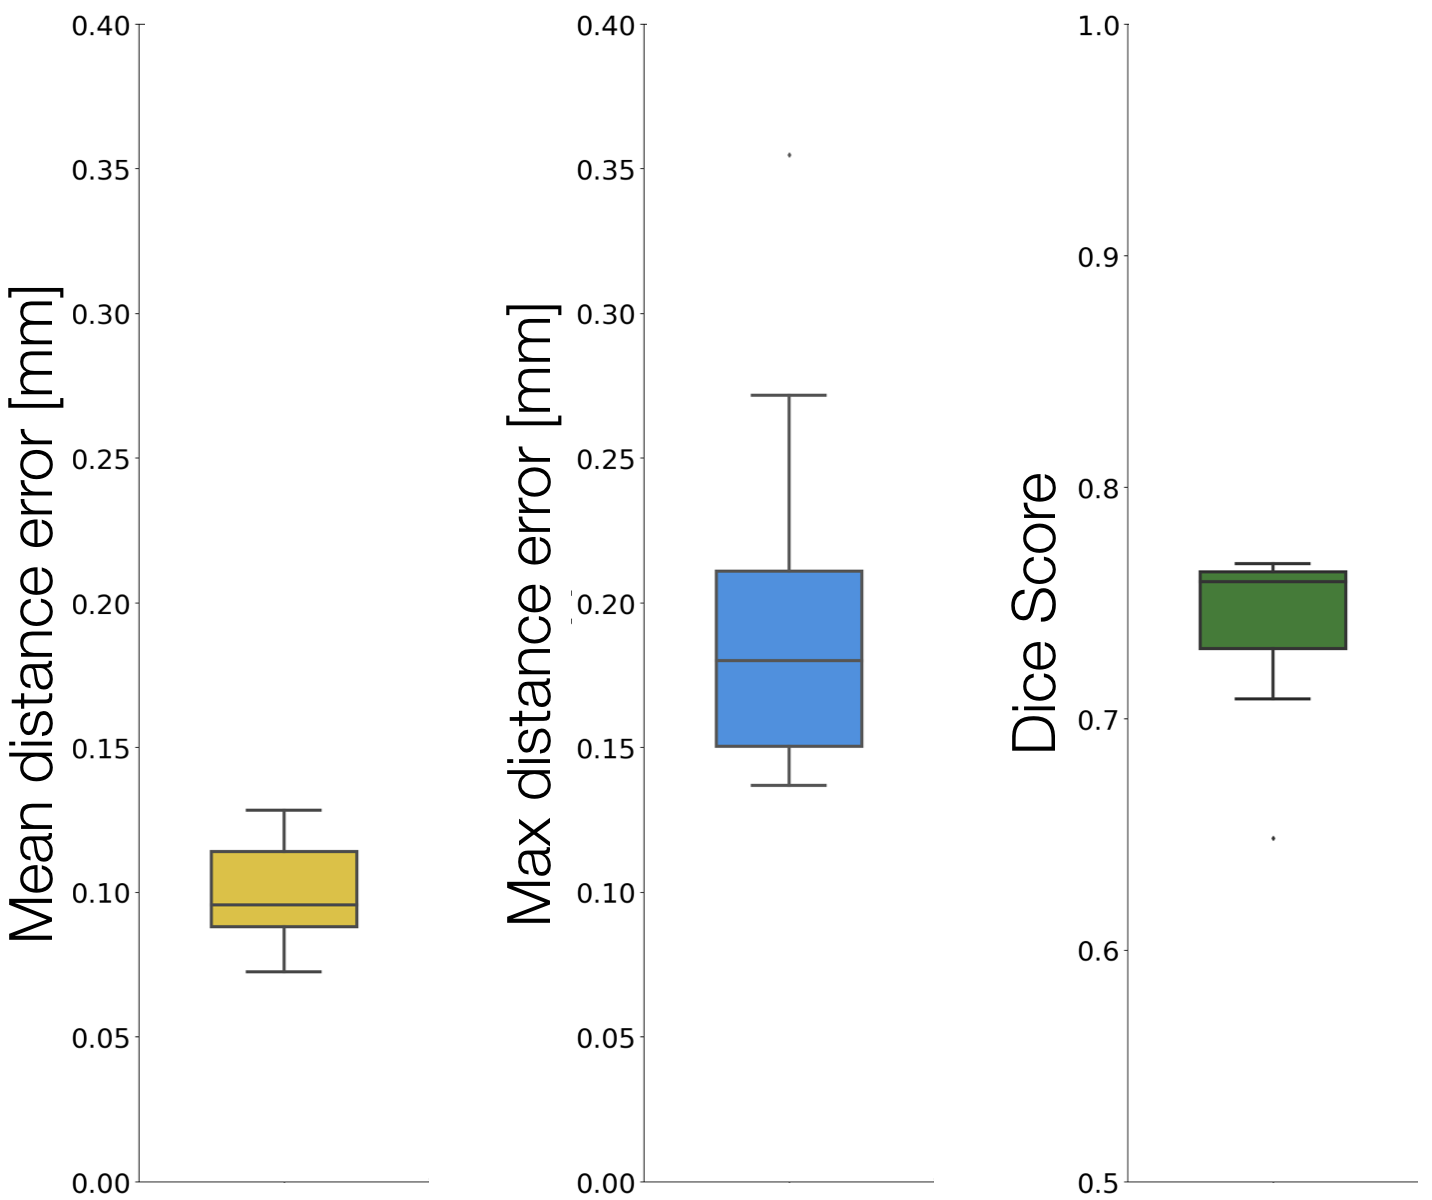
Validation: Template creation accuracy was evaluated by computing the mean and maximum distance error between the template centerline and each individual registered centerline. Similarly, the Dice score was computed between the template grey matter binary mask and each individual registered mask. Accuracy of the registration between our template and the PAM50 was assessed by computing the Dice score between each spinal cord mask along the common spinal coverage (i.e. C2-C8).
Scripts used for this project will be released , and the generated template will be available through the Spinal Cord Toolbox 14.
Results
Axial slices of the generated template, from C2 to C8 spinal levels, are presented in Figure 1, along with grey matter probabilistic maps. In particular, a fine delineation of the grey matter anatomical structure is achieved: e.g. distinct regions containing motor neuron pools that control the axial muscle, deltoid and biceps (medial to laterally) at C5, and tricep muscle at C7 ; which visually corroborates with histological studies 7,8.Results (median, IQR) of the template validation (Figure 2) showed high accuracy for (i) template creation, mean and maximum distance error of (0.10, [0.09, 0.11]) and (0.18, [0.15, 0.21])mm respectively, (ii) grey matter map generation, Dice score of (0.76, [0.73, 0.76]), and (iii) registration to the PAM50, Dice score of (0.96, [0.95, 0.96]).
Discussion and Conclusion
This new template could facilitate large and robust study of the association between function and structure in the spinal cord. In particular, it could be useful for fMRI experiments (e.g. task-related activations) since it is based on spinal levels (i.e. innervation of spinal nerves). Its high 3D resolution could be of great interest for analysing 7T data (e.g. axial resolution of 0.18 mm 16), while benefiting from the PAM50 atlases (e.g. white matter pathways 17). Limitations of the study include: (i) coverage limited to C2-C8 spinal levels, (ii) an old population used to construct the template, while age has been shown to influence spinal cord morphology, such as grey to white matter ratio 18, (iii) postmortem fixation may induce tissue shrinkage 19. Future work plan to align the proposed template with a white matter microstructure atlas of the spinal cord based on electron microscopy 20. Moreover, grey matter probabilistic maps specific to either the ‘normal’ or the ‘pre-fixed’ subjects from our cohort, as defined in 15, will be generated.Acknowledgements
- The authors acknowledge the facilities and scientific and technical assistance of the National Imaging Facility, a National Collaborative Research Infrastructure Strategy (NCRIS) capability, at the Centre for Advanced Imaging, University of Queensland.
- Funded by IVADO [EX-2018-4], Canada Research Chair in Quantitative Magnetic Resonance Imaging [950-230815], the Canadian Institute of Health Research [CIHR FDN-143263], the Canada Foundation for Innovation [32454, 34824], the Fonds de Recherche du Québec - Santé [28826], the Fonds de Recherche du Québec - Nature et Technologies [2015-PR-182754], the Natural Sciences and Engineering Research Council of Canada [RGPIN-2019-07244], the Canada First Research Excellence Fund (IVADO and TransMedTech), the Courtois NeuroMod project and the Quebec BioImaging Network [5886, 35450], Spinal Research and Wings for Life (INSPIRED project).
- We acknowledge the NVIDIA Corporation for the donation of a GPU.
References
1. Martin AR, De Leener B, Cohen-Adad J, Cadotte DW, Kalsi-Ryan S, Lange SF, et al. A Novel MRI Biomarker of Spinal Cord White Matter Injury: T2*-Weighted White Matter to Gray Matter Signal Intensity Ratio. AJNR Am J Neuroradiol. 2017 Apr 20.
2. Eden D, Gros C, Badji A, Dupont SM, De Leener B, Maranzano J, et al. Spatial distribution of multiple sclerosis lesions in the cervical spinal cord. Brain. 2019 Mar 1;142(3):633–46.
3. Stroman PW, Figley CR, Cahill CM. Spatial normalization, bulk motion correction and coregistration for functional magnetic resonance imaging of the human cervical spinal cord and brainstem. Magn Reson Imaging. 2008 Jul;26(6):809–14.
4. Taso M, Le Troter A, Sdika M, Cohen-Adad J, Arnoux P-J, Guye M, et al. A reliable spatially normalized template of the human spinal cord--Applications to automated white matter/gray matter segmentation and tensor-based morphometry (TBM) mapping of gray matter alterations occurring with age. Neuroimage. 2015 Aug 15;117:20–8.
5. De Leener B, Fonov VS, Collins DL, Callot V, Stikov N, Cohen-Adad J. PAM50: Unbiased multimodal template of the brainstem and spinal cord aligned with the ICBM152 space. Neuroimage. 2018 Jan 15;165:170–9.
6. Standring S. Gray’s Anatomy: The Anatomical Basis of Clinical Practice. Churchill Livingstone; 2015. 1584 p.
7. Sengul G, Watson C, Tanaka I, Paxinos G. Atlas of the Spinal Cord of the Rat, Mouse, Marmoset, Rhesus, and Human. 2013. 344 p.
8. Watson C, Paxinos G, Kayalioglu G. The Spinal Cord: A Christopher and Dana Reeve Foundation Text and Atlas. Academic Press; 2009. 408 p.
9. Abdullah Asiri A, Watson C, Nair S, Cowin G, Ruitenberg M, Kurniawan N. Mapping the human cervical spinal cord using ex-vivo magnetic resonance micro-imaging. In: Proceedings of the 24th Annual Meeting of ISMRM. 2016.
10. Cadotte DW, Cadotte A, Cohen-Adad J, Fleet D, Livne M, Wilson JR, et al. Characterizing the location of spinal and vertebral levels in the human cervical spinal cord. AJNR Am J Neuroradiol. 2015 Apr;36(4):803–10.
11. Paugam F, Lefeuvre J, Perone CS, Gros C, Reich DS, Sati P, et al. Open-source pipeline for multi-class segmentation of the spinal cord with deep learning. Magn Reson Imaging [Internet]. 2019 Apr 17; Available from: http://dx.doi.org/10.1016/j.mri.2019.04.009.
12. De Leener B, Mangeat G, Dupont S, Martin AR, Callot V, Stikov N, et al. Topologically preserving straightening of spinal cord MRI. J Magn Reson Imaging. 2017 Oct;46(4):1209–19.
13. Fonov VS, Le Troter A, Taso M, De Leener B, Lévêque G, Benhamou M, et al. Framework for integrated MRI average of the spinal cord white and gray matter: the MNI-Poly-AMU template. Neuroimage. 2014 Nov 15;102 Pt 2:817–27.
14. De Leener B, Lévy S, Dupont SM, Fonov VS, Stikov N, Louis Collins D, et al. SCT: Spinal Cord Toolbox, an open-source software for processing spinal cord MRI data. Neuroimage. 2017 Jan 15;145(Pt A):24–43.
15. Bruce A. A Topographical atlas of the spinal cord. Рипол Классик; 1901. 15 p.
16. Massire A, Taso M, Besson P, Guye M, Ranjeva J-P, Callot V. High-resolution multi-parametric quantitative magnetic resonance imaging of the human cervical spinal cord at 7T. Neuroimage. 2016 Dec;143:58–69.
17. Lévy S, Benhamou M, Naaman C, Rainville P, Callot V, Cohen-Adad J. White matter atlas of the human spinal cord with estimation of partial volume effect. Neuroimage. 2015 Oct 1;119:262–71.
18. Fradet L, Arnoux P-J, Ranjeva J-P, Petit Y, Callot V. Morphometrics of the entire human spinal cord and spinal canal measured from in vivo high-resolution anatomical magnetic resonance imaging. Spine . 2014 Feb 15;39(4):E262–9.
19. Kim TH, Zollinger L, Shi XF, Rose J, Jeong E-K. Diffusion tensor imaging of ex vivo cervical spinal cord specimens: the immediate and long-term effects of fixation on diffusivity. Anat Rec . 2009 Feb;292(2):234–41.
20. Duval T, Saliani A, Nami H, Nanci A, Stikov N, Leblond H, et al. Axons morphometry in the human spinal cord. Neuroimage. 2018 Oct 13.
Figures