1170
Quantitative MRI of the spinal cord: reproducibility and normative values across 40 sites
Eva Alonso-Ortiz1, Charley Gros1, Alexandru Foias1, Mihael Abramovic2, Christoph Arneitz2, Nicole Atcheson3, Laura Barlow4, Robert Barry5,6,7, Markus Barth3, Marco Battiston8, Christian Buchel9, Matthew Budde10, Virginie Callot11,12, Benjamin De Leener13,14,15, Maxime Descoteaux16,17, Paulo Loureiro de Sousa18, Dostal Marek19, Julien Doyon15, Adam Dvorak20, Falk Eippert21, Karla Epperson22, Jürgen Finsterbusch9, Issei Fukunaga23, Claudia Wheeler-Kingshott8,24,25, Giancarlo Germani26, Guillaume Gilbert27, Francesco Grussu28,29, Akifumi Hagiwara23, Pierre-Gilles Henry30, Tomas Horak31, Masaaki Hori23, James Joers30, K Kamiya32, Haleh Karbasforoushan33, Ali Khatibi34,35, Joo-Won Kim36, Nawal Kinany37, Hagen Kitzler38, S Kolind39, Joe Yazhuo Kong40,41,42, Petr Kudlička31, Paul Kuntke43, Nyoman Kurniawan3, Slawomir Kusmia44, Rene Labounek45,46, Maria Marcella Laganà47, Corree Laule48, Christine Law49, Christophe Lenglet30, Tobias Leutritz21, Yaou Liu50,51, Sara Llufriu52, Sean Mackey53, Eloy Martinez52, Igor Nestrasil30,45, Nico Papinutto54, Daniel Papp55, Deborah Pareto56, Todd Parrish57, Anna Pichiecchio26,58, Alex Rovira Cañellas56, Marc Ruitenberg59, Rebecca Samson28, Giorgio Savini26, Maryam Seif60, Alan Seifert36, Alex Smith55, Z A Smith57, Elisabeth Solana52, Y Suzuki61, G Tackley44, Alexandra Tinnermann9, Jan Valosek46, Marios Yiannakas28, Kenneth Weber62, Nikolaus Weiskopf21, Richard Wise44, P O Wyss2, Junqian Xu36, and Julien Cohen-Adad1,63
1NeuroPoly Lab, Institute of Biomedical Engineering, Polytechnique Montreal, Montreal, QC, Canada, 2Department of Radiology, Swiss Paraplegic Centre, Nottwil, Switzerland, 3Centre for Advanced Imaging, The University of Queensland, Brisbane, Australia, 4Department of Radiology, University of British Columbia, Vancouver, BC, Canada, 5Athinoula A. Martinos Center for Biomedical Imaging, Department of Radiology, Massachusetts General Hospital, Charlestown, MD, United States, 6Department of Radiology, Harvard Medical School, Boston, MA, United States, 7Harvard–Massachusetts Institute of Technology Health Sciences & Technology, Cambridge, MA, United States, 8Queen Square MS Centre, Queen Square Institute of Neurology, Faculty of Brain Sciences, University College London, London, United Kingdom, 9Institute of Systems Neuroscience, University Medical Center Hamburg-Eppendorf, Hamburg, Germany, 10Department of Neurosurgery, Medical College of Wisconsin, Milwaukee, WI, United States, 11CNRS, CRMBM, Aix-Marseille University, Marseille, France, 12APHM, Hopital Universitaire Timone, CEMEREM, Marseille, France, 13Department of Computer and Software Engineering, Polytechnique Montreal, Montreal, QC, Canada, 14CHU Sainte-Justine Research Centre, Montreal, QC, Canada, 15Montreal Neurological Institute, McGill University, Montreal, QC, Canada, 16CIMS, Centre de Recherche CHUS, Sherbrooke, QC, Canada, 17Sherbrooke Connectivity Imaging Lab (SCIL), Computer Science Department,, Université de Sherbrooke, Sherbrooke, QC, Canada, 18CNRS, ICube, FMTS, Université de Strasbourg, Strasbourg, France, 19University Hospital Brno, Brno, Czech Republic, 20Department of Physics and Astronomy, University of British Columbia, Vancouver, BC, Canada, 21Max Planck Institute for Human Cognitive and Brain Sciences, Leipzig, Germany, 22Richard M. Lucas Center, Stanford University School of Medicine, Stanford, CA, United States, 23Department of Radiology, Juntendo University School of Medicine, Tokyo, Japan, 24Department of Brain and Behavioural Sciences, University of Pavia, Pavia, Italy, 25Brain MRI 3T Research Centre, IRCCS Mondino Foundation, Pavia, Italy, 26Neuroradiology Unit, IRCCS Mondino Foundation, Pavia, Italy, 27MR Clinical Science, Philips Healthcare, Markham, ON, Canada, 28Queen Square MS Centre, Queen Square Institute of Neurology, Faculty of Brain Sciences, Faculty of Brain Sciences, University College London, London, United Kingdom, 29Centre for Medical Image Computing, Department of Computer Science, University College London, London, United Kingdom, 30Center for Magnetic Resonance Research, Department of Radiology, University of Minnesota, Minneapolis, MN, United States, 31CEITEC - Central European Institute of Technology, Brno, Czech Republic, 32University of Tokyo, Tokyo, Japan, 33Interdepartmental Neuroscience Program, Northwestern University School of Medicine, Chicago, IL, United States, 34Department of Neurology and Neurosurgery, McGill University, Montreal, QC, Canada, 35Centre of Precision Rehabilitation for Spinal Pain (CPR Spine), School of Sport, Exercise and Rehabilitation Sciences, College of Life and Environmental Sciences, University of Birmingham, Birmingham, United Kingdom, 36Translational and Molecular Imaging Institute, Department of Radiology, Icahn School of Medicine at Mount Sinai, New York, NY, United States, 37Center for Neuroprosthetics, Institute of Bioengineering, Ecole Polytechnique Fédérale de Lausanne, Lausanne, Switzerland, 38Department of Neuroradiology, Technische Universität Dresden, Dresden, Germany, 39Departments of Medicine (Neurology), Physics & Astronomy, Radiology, University of British Columbia, Vancouver, BC, Canada, 40CAS Key Laboratory of Behavioral Science, Institute of Psychology, Chinese Academy of Sciences, Beijing, China, 41Department of Psychology, University of Chinese Academy of Sciences, Beijing, China, 42Wellcome Centre for Integrative Neuroimaging, University of Oxford, Oxford, United Kingdom, 43University Hospital Carl Gustav Carus, Dresden, Germany, 44CUBRIC, Cardiff University, Walles, United Kingdom, 45Division of Clinical Behavioral Neuroscience, Department of Pediatrics, University of Minnesota, Minneapolis, MN, United States, 46Departments of Neurology and Biomedical Engineering, University Hospital Olomouc, Olomouc, Czech Republic, 47IRCCS Fondazione Don Carlo Gnocchi, Milan, Italy, 48Departments of Pathology & Laboratory Medicine, Physics & Astronomy, Radiology; International Collaboration on Repair Discoveries (ICORD), University of British Columbia, Vancouver, BC, Canada, 49Department of Anesthesiology, Perioperative and Pain Medicine, Stanford University School of Medicine, Palo Alto, CA, United States, 50Department of Radiology, Beijing Tiantan Hospital, Capital Medical University, Beijing, China, 51Tiantan Image Research Center, China National Clinical Research Center for Neurological Diseases, Beijing, China, 52Center of Neuroimmunology, Laboratory of Advanced Imaging in Neuroimmunological Diseases, Hospital Clinic Barcelona, Institut d'Investigacions Biomediques August Pi i Sunyer (IDIBAPS) and Universitat de Barcelona, Barcelona, Spain, 53Stanford University School of Medicine, Stanford, CA, United States, 54Department of Neurology, University of California San Francisco, San Francisco, CA, United States, 55Wellcome Centre For Integrative Neuroimaging, FMRIB, NDCN, University of Oxford, Oxford, United Kingdom, 56Neuroradiology Section, Vall Hebron University Hospital, Barcelona, Spain, 57Feinberg School of Medicine, Northwestern University School of Medicine, Chicago, IL, United States, 58Department of Brain and Behavioural Neuroscience, University of Pavia, Pavia, Italy, 59School of Biomedical Sciences, Faculty of Medicine, The University of Queensland, Brisbane, Australia, 60Spinal Cord Injury Center Balgrist, University of Zurich, Zurich, Switzerland, 61Department of Radiology, University of Tokyo, Tokyo, Japan, 62Systems Neuroscience and Pain Laboratory, Stanford University, Stanford, CA, United States, 63Functional Neuroimaging Unit, CRIUGM, University of Montreal, Montreal, QC, Canada
1NeuroPoly Lab, Institute of Biomedical Engineering, Polytechnique Montreal, Montreal, QC, Canada, 2Department of Radiology, Swiss Paraplegic Centre, Nottwil, Switzerland, 3Centre for Advanced Imaging, The University of Queensland, Brisbane, Australia, 4Department of Radiology, University of British Columbia, Vancouver, BC, Canada, 5Athinoula A. Martinos Center for Biomedical Imaging, Department of Radiology, Massachusetts General Hospital, Charlestown, MD, United States, 6Department of Radiology, Harvard Medical School, Boston, MA, United States, 7Harvard–Massachusetts Institute of Technology Health Sciences & Technology, Cambridge, MA, United States, 8Queen Square MS Centre, Queen Square Institute of Neurology, Faculty of Brain Sciences, University College London, London, United Kingdom, 9Institute of Systems Neuroscience, University Medical Center Hamburg-Eppendorf, Hamburg, Germany, 10Department of Neurosurgery, Medical College of Wisconsin, Milwaukee, WI, United States, 11CNRS, CRMBM, Aix-Marseille University, Marseille, France, 12APHM, Hopital Universitaire Timone, CEMEREM, Marseille, France, 13Department of Computer and Software Engineering, Polytechnique Montreal, Montreal, QC, Canada, 14CHU Sainte-Justine Research Centre, Montreal, QC, Canada, 15Montreal Neurological Institute, McGill University, Montreal, QC, Canada, 16CIMS, Centre de Recherche CHUS, Sherbrooke, QC, Canada, 17Sherbrooke Connectivity Imaging Lab (SCIL), Computer Science Department,, Université de Sherbrooke, Sherbrooke, QC, Canada, 18CNRS, ICube, FMTS, Université de Strasbourg, Strasbourg, France, 19University Hospital Brno, Brno, Czech Republic, 20Department of Physics and Astronomy, University of British Columbia, Vancouver, BC, Canada, 21Max Planck Institute for Human Cognitive and Brain Sciences, Leipzig, Germany, 22Richard M. Lucas Center, Stanford University School of Medicine, Stanford, CA, United States, 23Department of Radiology, Juntendo University School of Medicine, Tokyo, Japan, 24Department of Brain and Behavioural Sciences, University of Pavia, Pavia, Italy, 25Brain MRI 3T Research Centre, IRCCS Mondino Foundation, Pavia, Italy, 26Neuroradiology Unit, IRCCS Mondino Foundation, Pavia, Italy, 27MR Clinical Science, Philips Healthcare, Markham, ON, Canada, 28Queen Square MS Centre, Queen Square Institute of Neurology, Faculty of Brain Sciences, Faculty of Brain Sciences, University College London, London, United Kingdom, 29Centre for Medical Image Computing, Department of Computer Science, University College London, London, United Kingdom, 30Center for Magnetic Resonance Research, Department of Radiology, University of Minnesota, Minneapolis, MN, United States, 31CEITEC - Central European Institute of Technology, Brno, Czech Republic, 32University of Tokyo, Tokyo, Japan, 33Interdepartmental Neuroscience Program, Northwestern University School of Medicine, Chicago, IL, United States, 34Department of Neurology and Neurosurgery, McGill University, Montreal, QC, Canada, 35Centre of Precision Rehabilitation for Spinal Pain (CPR Spine), School of Sport, Exercise and Rehabilitation Sciences, College of Life and Environmental Sciences, University of Birmingham, Birmingham, United Kingdom, 36Translational and Molecular Imaging Institute, Department of Radiology, Icahn School of Medicine at Mount Sinai, New York, NY, United States, 37Center for Neuroprosthetics, Institute of Bioengineering, Ecole Polytechnique Fédérale de Lausanne, Lausanne, Switzerland, 38Department of Neuroradiology, Technische Universität Dresden, Dresden, Germany, 39Departments of Medicine (Neurology), Physics & Astronomy, Radiology, University of British Columbia, Vancouver, BC, Canada, 40CAS Key Laboratory of Behavioral Science, Institute of Psychology, Chinese Academy of Sciences, Beijing, China, 41Department of Psychology, University of Chinese Academy of Sciences, Beijing, China, 42Wellcome Centre for Integrative Neuroimaging, University of Oxford, Oxford, United Kingdom, 43University Hospital Carl Gustav Carus, Dresden, Germany, 44CUBRIC, Cardiff University, Walles, United Kingdom, 45Division of Clinical Behavioral Neuroscience, Department of Pediatrics, University of Minnesota, Minneapolis, MN, United States, 46Departments of Neurology and Biomedical Engineering, University Hospital Olomouc, Olomouc, Czech Republic, 47IRCCS Fondazione Don Carlo Gnocchi, Milan, Italy, 48Departments of Pathology & Laboratory Medicine, Physics & Astronomy, Radiology; International Collaboration on Repair Discoveries (ICORD), University of British Columbia, Vancouver, BC, Canada, 49Department of Anesthesiology, Perioperative and Pain Medicine, Stanford University School of Medicine, Palo Alto, CA, United States, 50Department of Radiology, Beijing Tiantan Hospital, Capital Medical University, Beijing, China, 51Tiantan Image Research Center, China National Clinical Research Center for Neurological Diseases, Beijing, China, 52Center of Neuroimmunology, Laboratory of Advanced Imaging in Neuroimmunological Diseases, Hospital Clinic Barcelona, Institut d'Investigacions Biomediques August Pi i Sunyer (IDIBAPS) and Universitat de Barcelona, Barcelona, Spain, 53Stanford University School of Medicine, Stanford, CA, United States, 54Department of Neurology, University of California San Francisco, San Francisco, CA, United States, 55Wellcome Centre For Integrative Neuroimaging, FMRIB, NDCN, University of Oxford, Oxford, United Kingdom, 56Neuroradiology Section, Vall Hebron University Hospital, Barcelona, Spain, 57Feinberg School of Medicine, Northwestern University School of Medicine, Chicago, IL, United States, 58Department of Brain and Behavioural Neuroscience, University of Pavia, Pavia, Italy, 59School of Biomedical Sciences, Faculty of Medicine, The University of Queensland, Brisbane, Australia, 60Spinal Cord Injury Center Balgrist, University of Zurich, Zurich, Switzerland, 61Department of Radiology, University of Tokyo, Tokyo, Japan, 62Systems Neuroscience and Pain Laboratory, Stanford University, Stanford, CA, United States, 63Functional Neuroimaging Unit, CRIUGM, University of Montreal, Montreal, QC, Canada
Synopsis
Normative quantitative MRI values are useful for establishing diagnosis in individuals with a suspected disease. Building on the recent creation of an open-access multi-center database (n=248 subjects) of spinal cord MRI, we processed those data to extract quantitative metrics that are commonly used (cross-sectional area, diffusion and magnetization transfer metrics). Inter-vendor (Siemens, Philips, GE), inter- and intra-site coefficients of variation (COV) were calculated. Overall results suggest that the spinal cord generic acquisition protocol is reproducible across sites and vendors (COVs within 2-8%). The data and processing pipeline are publicly available at https://spine-generic.readthedocs.io/.
Introduction
While quantitative MRI (qMRI) techniques have been successfully implemented in the brain for several decades, spinal cord (SC) imaging is still largely underutilized. This is mostly a direct consequence of the many challenges that need to be overcome in order to acquire good quality data 1,2. For the past 20 years, researchers have been developing methods to overcome these challenges, including more sensitive coil arrays 3,4 and advanced pulse sequences for mitigating motion and susceptibility artifacts 2,5. As a result, researchers have been able to acquire state-of-the-art SC qMRI data that now has strong potential for providing highly relevant insights into SC anatomy, function and health. A subsequent issue is that, until recently, there was no consensus established by the imaging community for acquiring SC qMRI data, leading to poor reproducibility of scientific results across centers. To address this limitation, a consortium of international SC researchers published a standardized protocol for acquiring SC qMRI across the three main MRI vendors (Siemens, GE, Philips) 6. Based on this protocol, 40 sites acquired data in healthy adults, which are available as open-access 7. The purpose of this study was to process those data and extract quantitative metrics that are commonly used by researchers and clinicians for assessing SC structural impairment (cross-sectional area, diffusion and magnetization transfer metrics), to evaluate their reproducibility and propose normative values.Methods
Data: Each site was instructed to scan 6 participants (3 males, 20-40 y.o.) across GE (n=6), Philips (n=8) and Siemens (n=26) platforms, yielding 248 datasets in total (a few sites scanned more than 6 participants). Briefly, the acquisition protocol includes a 1mm isotropic T1w scan, 0.8mm isotropic T2w, magnetization transfer saturation protocol (axial orientation), an axial multi-echo GRE scan and a single-shell diffusion-weighted scan. Data are available at: https://openneuro.org/datasets/ds001919/ (v1.0.5) and are organized using the Brain Imaging Data Structure (BIDS) 8 file naming convention in order to facilitate data sharing and processing using BIDS-compatible processing pipelines.Processing: Data were processed with Spinal Cord Toolbox (SCT) v4.1.0 9 using the analysis script described at: https://spine-generic.readthedocs.io/ and illustrated in Figure 1. A visual quality control (QC) was performed (part of SCT) to assess quality and processing results. If issues with automatic segmentation or labeling were found, those labels were manually corrected and the processing was re-run.
Statistics: Intra-site COVs were calculated across different subjects (no scan-rescan). Inter-site COVs were calculated from the intra-site means.
Results
Data quality: Overall, the acquisition protocol (e.g. parameters, slice placement) was followed by all sites. Data quality was mostly satisfactory, with some exceptions caused by motion, swapped MTon and MToff, mis-placement of FOV, changed coil and shim configuration between MTon/off and T1w, and poor shimming on DWI scans. Only 1 dataset (out of 248) and 11 volumes (out of 1240) had to be removed from the analysis. Figure 2 illustrates data quality for the T1w MPRAGE.Processing: Total processing time was ~6h (2.2GHz x 64 cores, 512 GB RAM). After visual QC of processing results, we had to manually correct 9% of the segmentations and 13% of the vertebral labeling.
MRI metrics: Cord CSA computed from T1w and T2w between C2-C3 yielded inter-site COVs within 7.7-8.6% and intra-site COVs within 2.9-5.6% (see Figure 3 for detailed results and normative values). Although a significant linear trend is observed between T1w and T2w cord CSA, T2w images demonstrated larger cord CSA estimates than the T1w images (Figure 4). Gray matter CSA computed from the multi-echo GRE scan yielded intra-site COVs of 6.5% (GE), 13.8% (Philips) and 6.3% (Siemens), and inter-site COVs of 4.1% (GE), 9.1% (Philips) and 3.9% (Siemens). DTI fractional anisotropy (FA) and MTR, averaged across C2-C5 levels, yielded better intra- and inter-site COVs compared to CSA measures, with intra-site COVs within 2.7-5%, and inter-site COVs ranging within 1.9-3.9% (see Figure 5 for detailed results and normative values).
Discussion
The main result of this study is that, within a given vendor, the intra-site COV was approximately twice as much as the inter-site COV, indicating that subject variability largely accounts for the observed differences across sites. This result suggests that the implementation of the spinal cord generic protocol was successful. When comparing CSA (assessing cord morphometry) vs. diffusion and MT metrics (assessing white matter microstructure), we found that the intra-site COVs were roughly twice as large as the diffusion/MT metrics, which is consistent with the assumption that cord shape varies more than the internal microstructure of the white matter across healthy individuals. Future work will involve further interpretation of results and site-specific differences, notably looking at the influence of age, ethnic background and sex.Conclusion
The spinal cord generic acquisition protocol is reproducible across sites and vendors (COVs within 2-8%). The segmentation bias between T1w and T2w could be modeled and accounted for. Our proposed standardized acquisition protocol and data analysis pipeline paves the way towards transparency, reproducibility and multi-center studies.Acknowledgements
Funded by the Canada Research Chair in Quantitative Magnetic Resonance Imaging [950-230815], the Canadian Institute of Health Research [CIHR FDN-143263], the Canada Foundation for Innovation [32454, 34824], the Fonds de Recherche du Québec - Santé [28826], the Fonds de Recherche du Québec - Nature et Technologies [2015-PR-182754], the Natural Sciences and Engineering Research Council of Canada [RGPIN-2019-07244], the Canada First Research Excellence Fund (IVADO and TransMedTech), the Courtois NeuroMod project and the Quebec BioImaging Network [5886, 35450], the UCL-UCLH Biomedical Research Centre for ongoing funding; the European Union’s Horizon 2020 research and innovation programme under grant agreement No. 634541; the Engineering and Physical Sciences Research Council (EPSRC EP/R006032/1, M020533/1), Spinal Research (UK), Wings for Life (Austria), Craig H. Neilsen Foundation (USA) (jointly funding the INSPIRED study), Wings for Life (#169111), the UK Multiple Sclerosis Society (grants 892/08 and 77/2017), the National Institutes of Health grants R00EB016689 and R01EB027779, the Czech Health Research Council [NV18-04-00159]; NIH grants P41 EB027061 and P30 NS076408 (C.L.); Orphan Disease Center at the University of Pennsylvania MDBR-17-123-MPS (I.N.).References
- Wheeler-Kingshott CA, Stroman PW, Schwab JM, Bacon M, Bosma R, Brooks J, et al. The current state-of-the-art of spinal cord imaging: applications. Neuroimage. 2014 Jan 1;84:1082–93.
- Stroman PW, Wheeler-Kingshott C, Bacon M, Schwab JM, Bosma R, Brooks J, et al. The current state-of-the-art of spinal cord imaging: methods. Neuroimage. 2014 Jan 1;84:1070–81.
- Cohen-Adad J, Wald LL. Array Coils [Internet]. Quantitative MRI of the Spinal Cord. 2014. p. 59–67. Available from: http://dx.doi.org/10.1016/b978-0-12-396973-6.00005-8
- Barry RL, Vannesjo SJ, By S, Gore JC, Smith SA. Spinal cord MRI at 7T. Neuroimage. 2018 Mar;168:437–51.
- Saritas EU, Holdsworth SJ, Bammer R. Susceptibility artifacts. In: Quantitative MRI of the Spinal Cord, Elsevier, J Cohen-Adad and CAM Wheeler-Kingshott, eds. 2014;91–104.
- Cohen-Adad J. Spinal Cord MRI Generic Acquisition Protocol [Internet]. Available from: http://www.spinalcordmri.org/protocols
- Cohen-Adad J. Spinal Cord MRI Public Database (Multi-subjects) [Internet]. [cited 2019 Jul 23]. Available from: https://openneuro.org/datasets/ds001919/
- Gorgolewski KJ, Auer T, Calhoun VD, Craddock RC, Das S, Duff EP, et al. The brain imaging data structure, a format for organizing and describing outputs of neuroimaging experiments. Sci Data. 2016 Jun 21;3:160044.
- De Leener B, Lévy S, Dupont SM, Fonov VS, Stikov N, Louis Collins D, et al. SCT: Spinal Cord Toolbox, an open-source software for processing spinal cord MRI data. Neuroimage. 2017 Jan 15;145(Pt A):24–43.
Figures
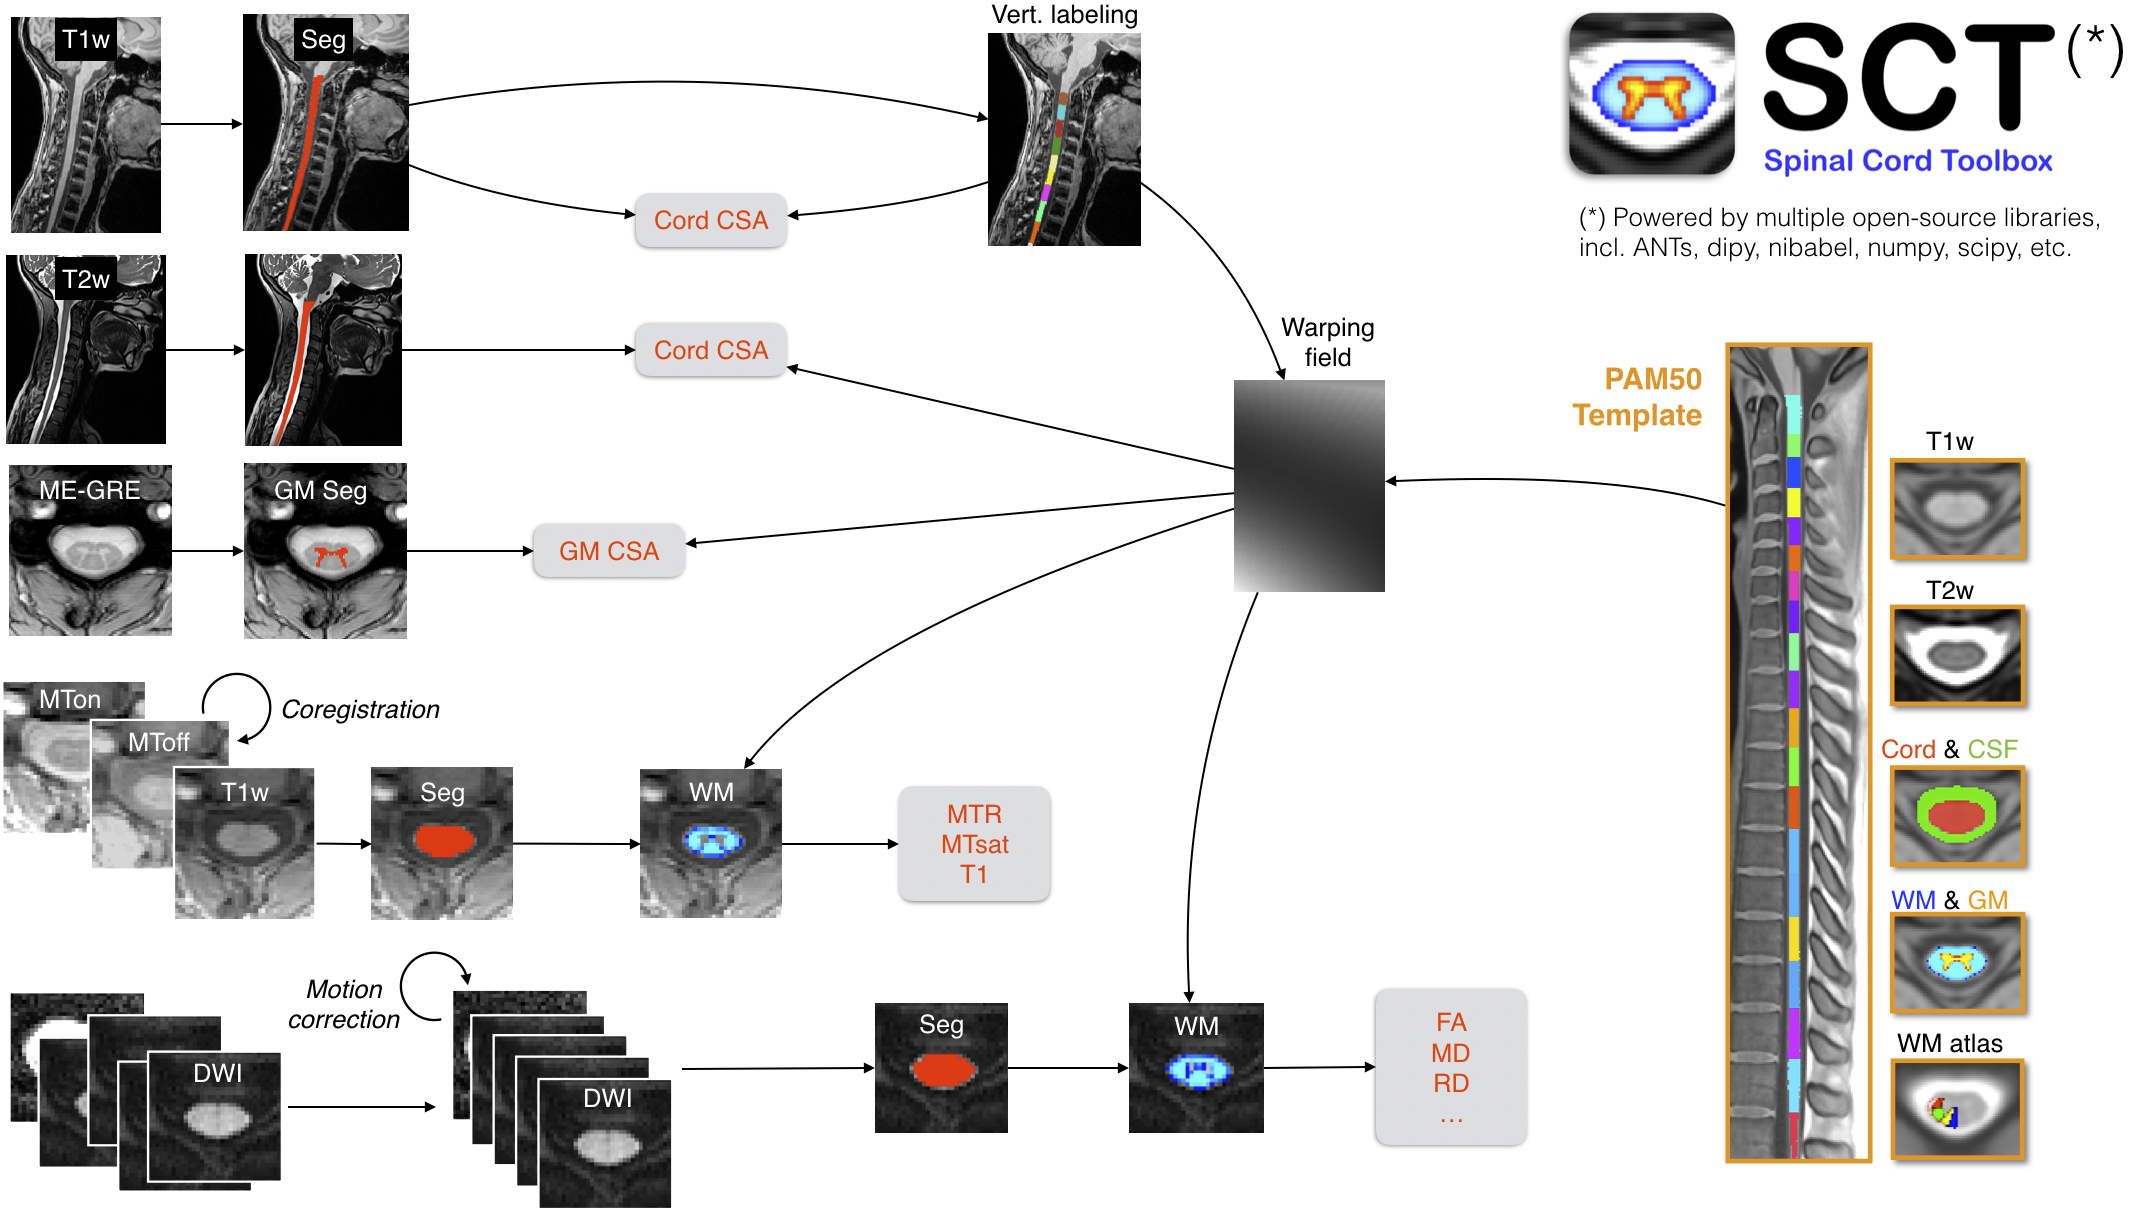
Figure 1. Overview of the processing pipeline. Briefly, for each subject, the spinal cord is automatically segmented on the T1w, T2w, T1w-ax, mean DWI, while the gray matter is segmented on the ME-GRE scan (after averaging across echoes). Vertebral labeling is run on the T1w scan, followed by registration with the PAM50 template for each contrast. Estimated metrics are shown in red. For more details about the pipeline, see [9].
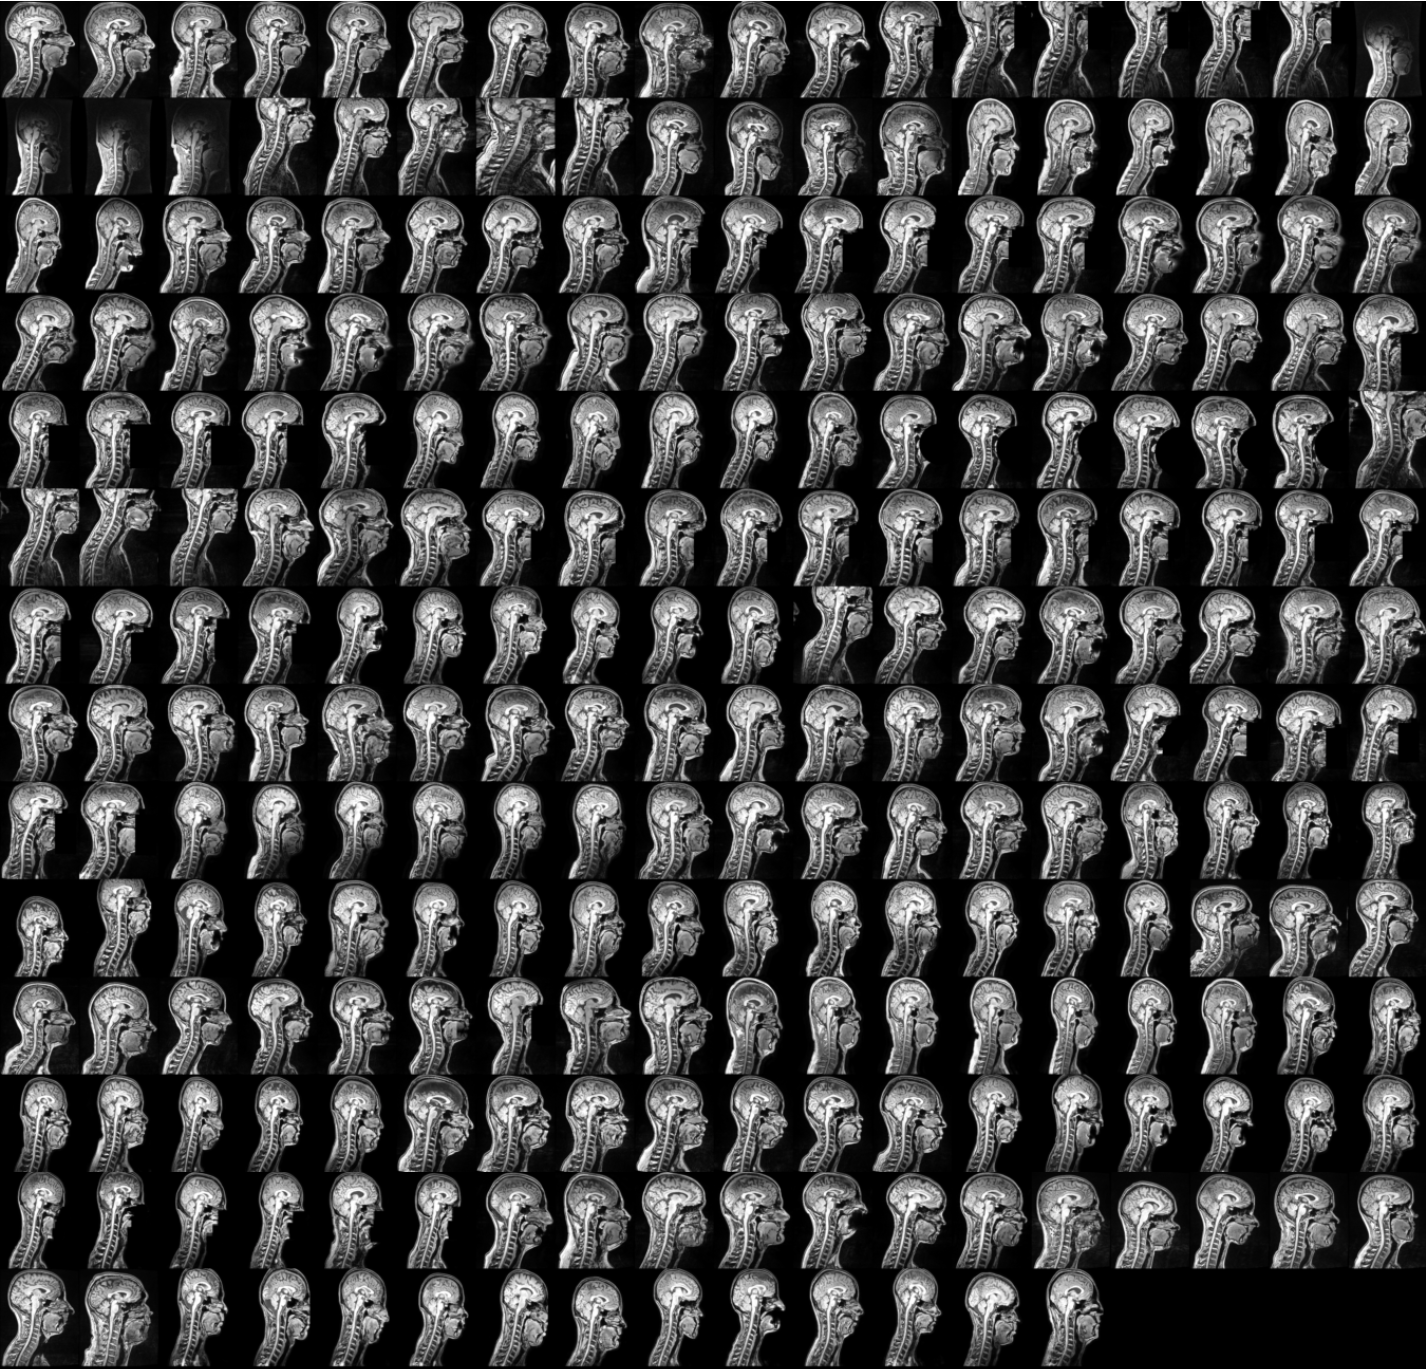
Figure 2. Illustration of FOV placement and data quality across all subjects of the spine-generic database for the T1w MPRAGE scan. Images were flattened (i.e. slice-wise alignment of the cord centerline along the right-left direction) in order to get a quick overview of the SC quality in a single sagittal plane.
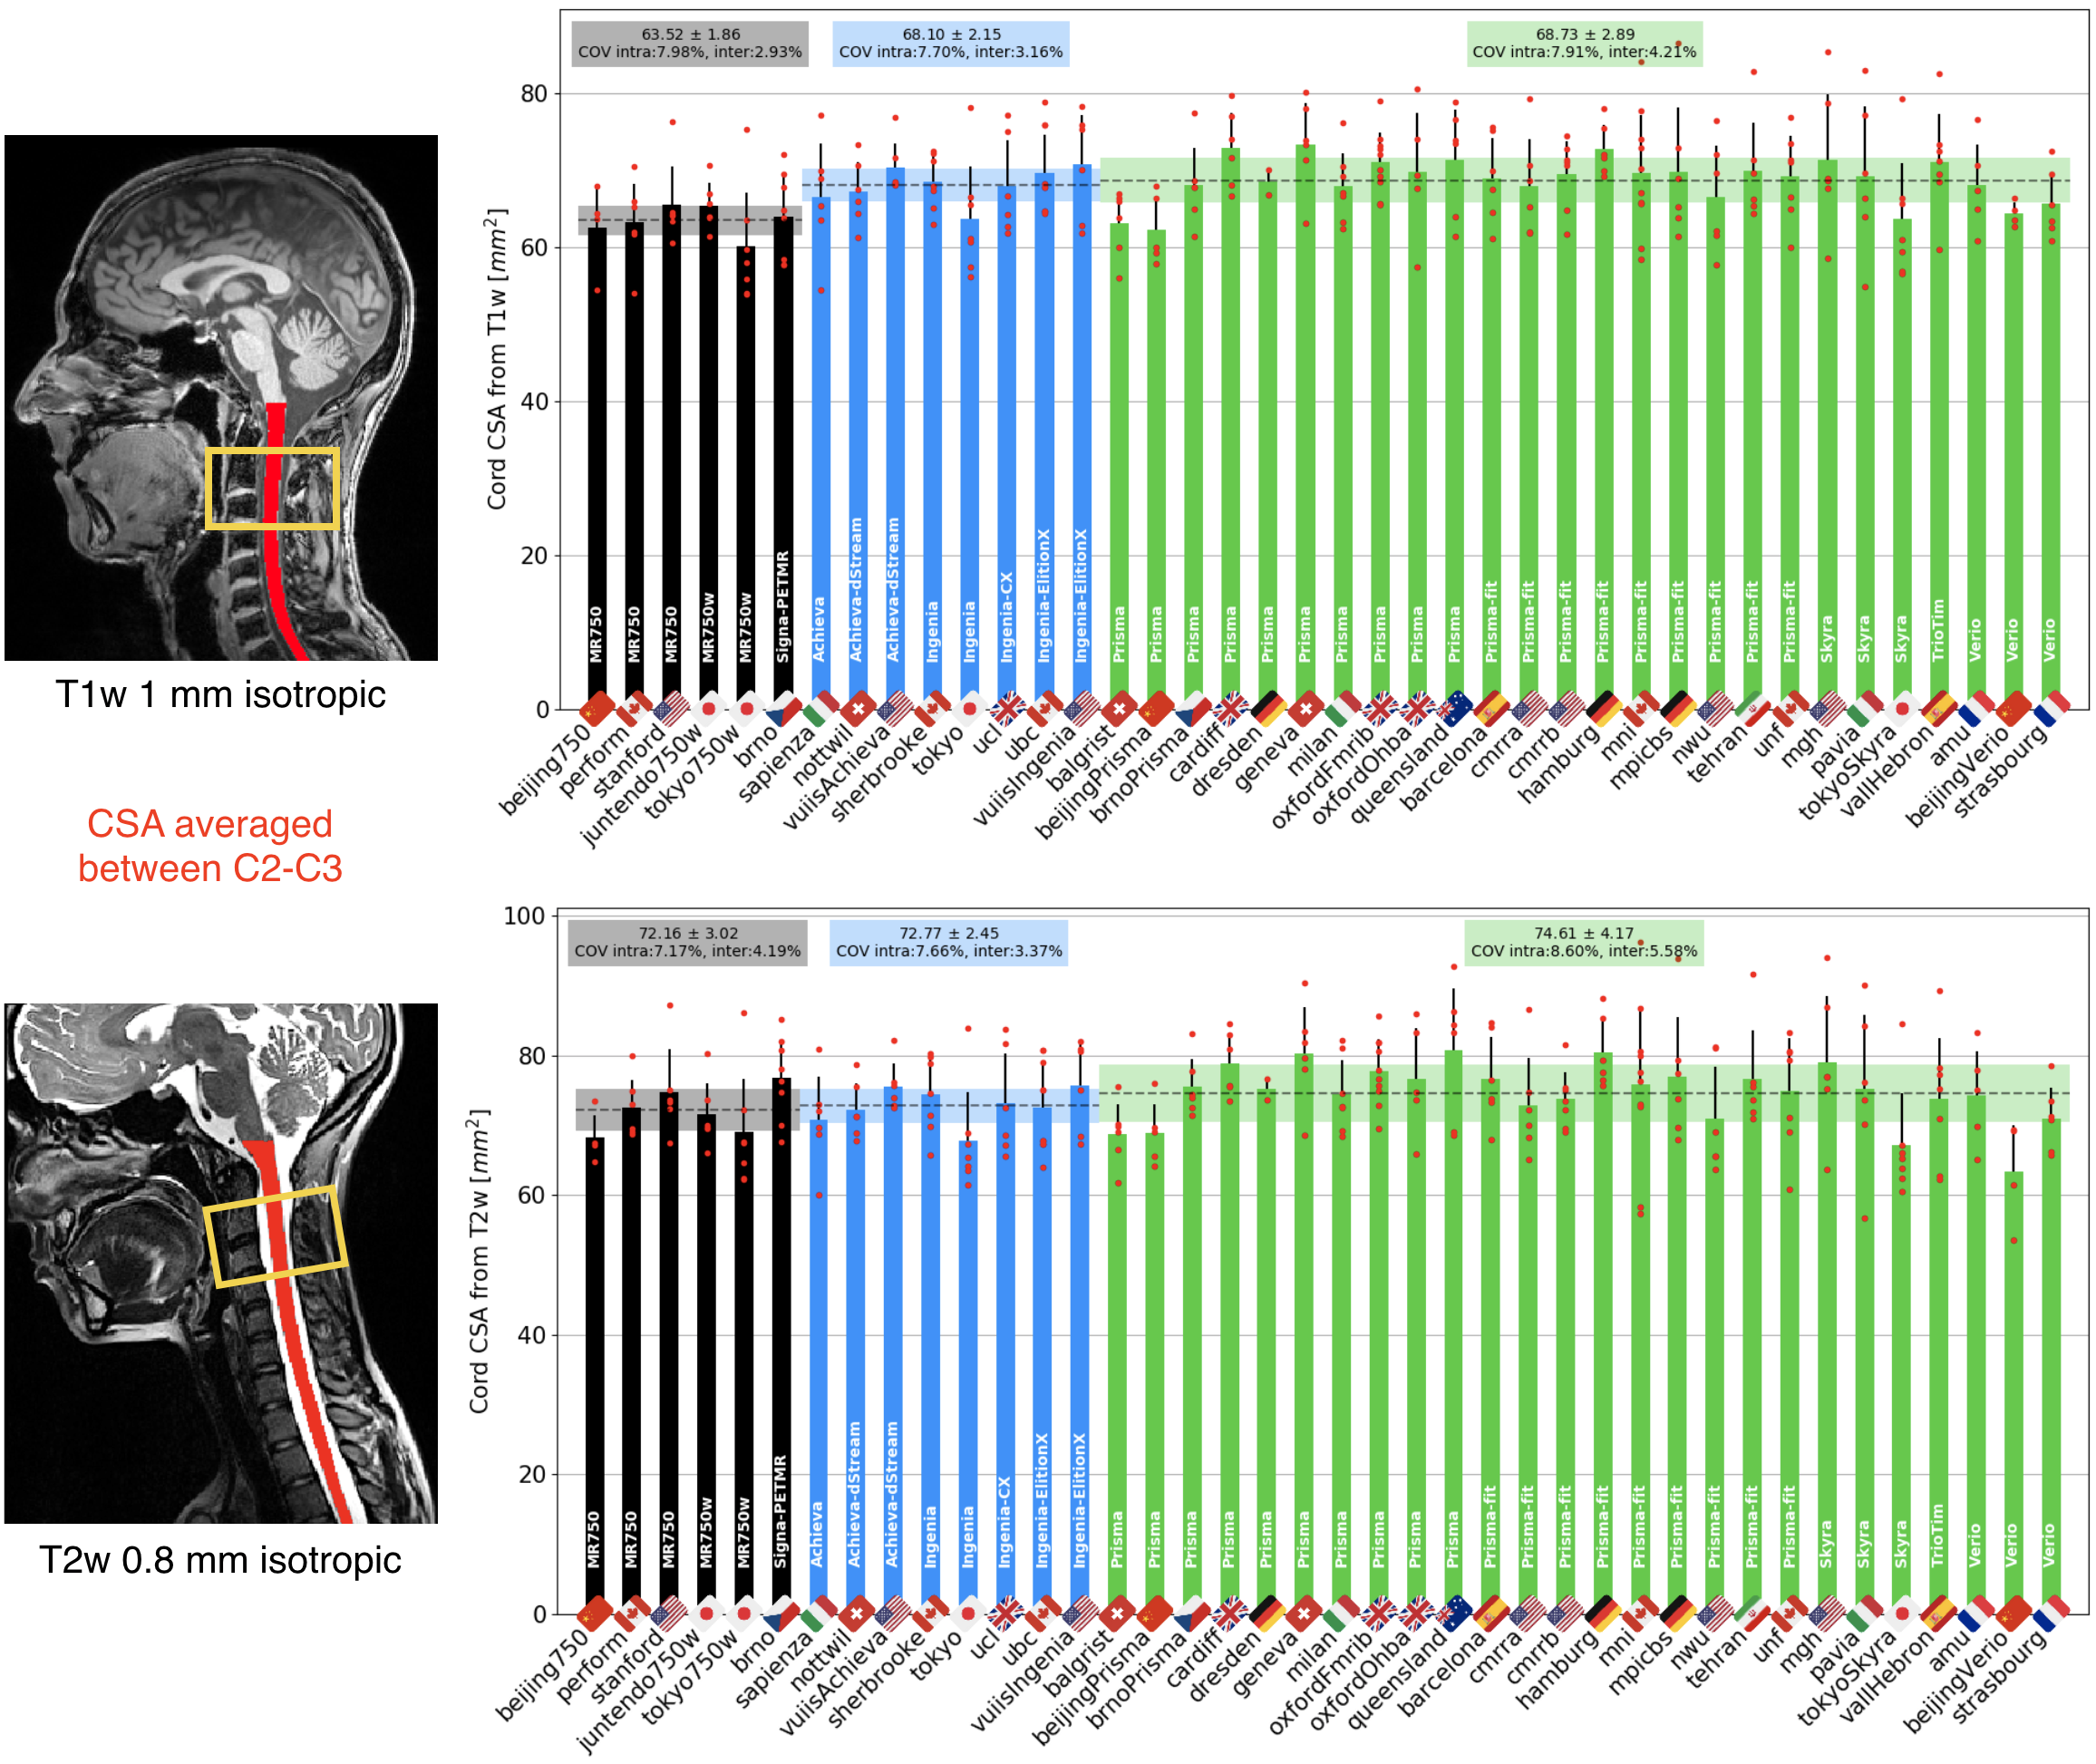
Figure 3. Results of SC cross-sectional area (CSA) averaged across C2-C3 vertebral levels, for T1w (top) and T2w (bottom) scans. Bar plots represent the mean value across subjects (red dots) of each center, with the error bar being the standard deviation. Bars are clustered per vendor: GE (black), Philips (blue) and Siemens (green). Dashed horizontal line represents the mean CSA per vendor, surrounded by the standard deviation (shaded area).
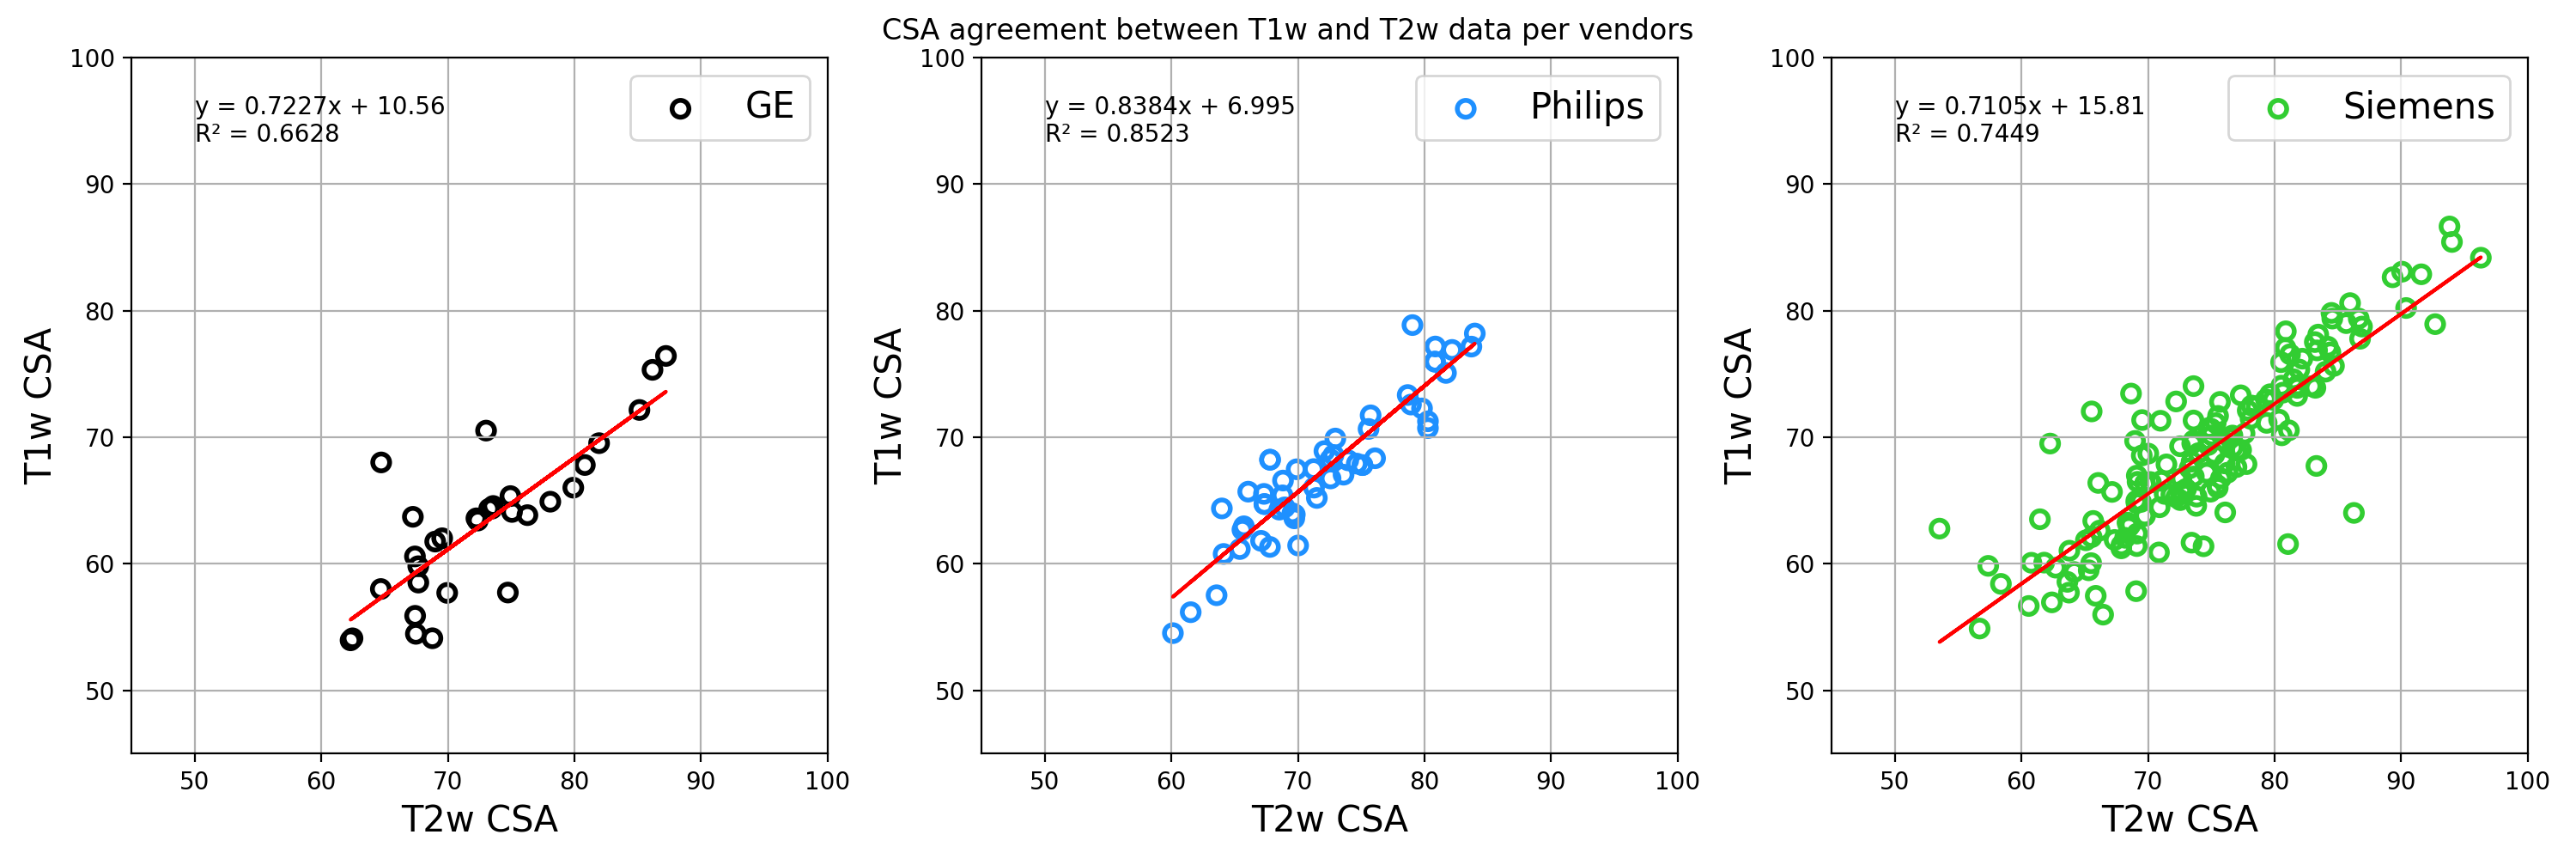
Figure 4. Relationship between CSA calculated from the T1w vs. T2w scans. Differences across vendors are attributed to variations in sequence implementation, which in turn leads to slightly different definitions of the cord boundary during segmentation and thus, different CSA results. The ability to retrieve the within-vendor relationship between T1w and T2w CSAs opens the door to the aggregation of multi-contrast data from large-scale studies.
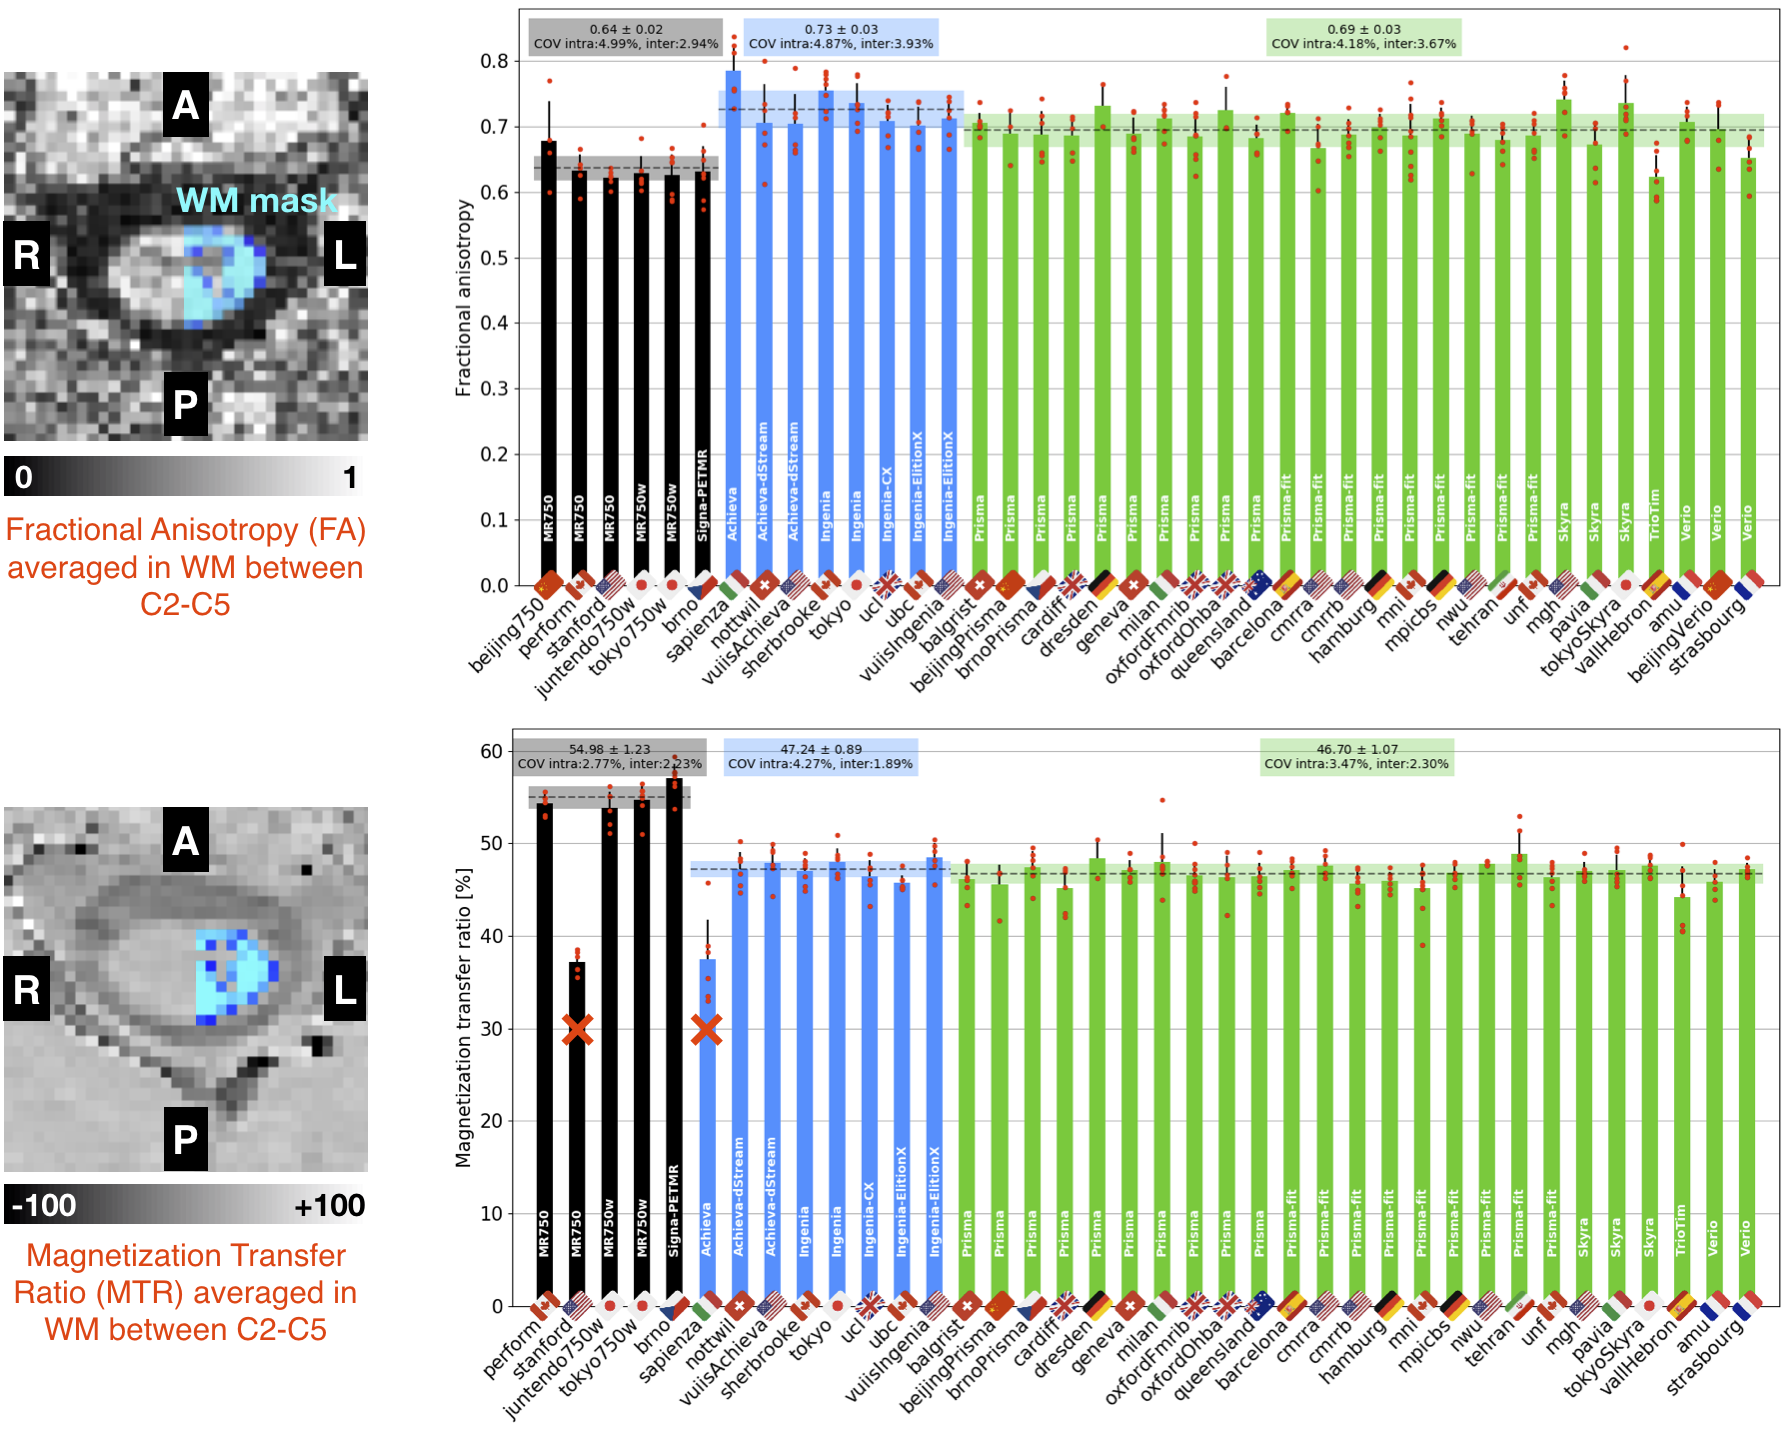
Figure 5. Diffusion fractional anisotropy (top) and magnetization transfer ratio (bottom), averaged in the white matter between C2-C5 vertebral levels. Bar plots represent the mean value across subjects (red dots). Dashed horizontal line represents the mean value per vendor, surrounded by the standard deviation (shaded area). Sites marked with “x” were excluded from the COVs calculations because acquisition parameters drastically differed from the generic protocol.