1169
Automatic Quantification Pipeline for Spinal Cord Grey and White Matter in Multiple Sclerosis1Neurologic Clinic and Policlinic, Departments of Medicine, Biomedical Engineering and Clinical Research, University Hospital Basel, University of Basel, Basel, Switzerland, 2Translational Imaging in Neurology (ThINK) Basel, Department of Medicine and Biomedical Engineering, University Hospital Basel, University of Basel, Basel, Switzerland, 3Medical Image Analysis Center (MIAC AG), Basel, Switzerland, 4Department of Biomedical Engineering, University of Basel, Allschwil, Switzerland, 5Division of Diagnostic and Interventional Neuroradiology, Department of Radiology and Nuclear Medicine, University Hospital Basel, University of Basel, Basel, Switzerland, 6Medical Faculty, University of Basel, Basel, Switzerland, 7Division of Radiological Physics, Department of Radiology, University Hospital Basel, University of Basel, Basel, Switzerland, 8Department of Neurology, DKD Helios Klinik Wiesbaden, Wiesbaden, Germany
Synopsis
Currently, there is no gold-standard for spinal cord (SC) grey and white matter (GM/WM) quantification in multiple sclerosis (MS). In this work, the cervical SC of 24 MS patients and 24 healthy controls (HC) was scanned on a 3T MRI-system using averaged magnetization inversion recovery acquisitions. Manual segmentations were provided to train a “Multi-Dimensional Gated Recurrent Unit” neural network for subsequent automatic SC GM/WM/lesion segmentation. Accuracy of automatic segmentations was high and decreased in the order WM→GM→lesions and HC→MS. MS patients had reduced SC GM and WM compared to HC. Finally, SC GM, WM and lesions correlated with physical disability.
Introduction
Multiple sclerosis (MS) is a chronic inflammatory and neurodegenerative disorder, affecting approximately 2 million predominantly young individuals worldwide 1,2. Focal lesions of the spinal cord (SC) are found in up to 83% of MS patients 3,4, whereas diffuse damage also occurs manifesting as both SC grey and white matter (GM and WM respectively) atrophy 5–8. However, “conventional” SC MRI was -until recently- not suitable to differentiate sufficiently between SC GM and WM. To that end, an averaged magnetization inversion recovery acquisitions (AMIRA) sequence was proposed, that allows for excellent SC GM/WM contrast in clinically feasible acquisition times 9. Although fully automatic segmentation methods have been recently shown to reliably segment SC GM and WM in healthy subjects 10–14, an accurate and reproducible segmentation method in MS patients is more challenging due to the presence of SC lesions.Methods
The cervical SC of 24 MS patients (1 scan per subject; 14 female; 15 relapsing-remitting, 6 secondary progressive and 3 primary progressive MS; age 41.8 ± 11.8 years; disease duration 12.4 ± 8.5 years) and 24 sex- and age-matched healthy controls (HC) (3 scans per subject in test-retest fashion; 15 female; age 40.2 ± 10.8 years) was scanned on a 3T MRI-system (Magnetom Prisma, Siemens Healthineers). Twelve axial AMIRA slices (FOV = 128x128mm2, slice thickness 8mm, 4mm slice overlap, in-plane resolution = 0.67x0.67mm2, TEbSSFP = 2.14 ms, TRbSSFP = 5.13 ms, signal averaging = 1, acquisition time = 51s per slice) were acquired over a 48mm cord segment, extending from the C2-C5 vertebral level 9. SC GM, WM and lesions were manually segmented by one experienced rater. Subsequently, manual segmentations were used to train Multi-Dimensional Gated Recurrent Unit (MD-GRU) neural segmentation networks of SC GM/WM as well as lesion segmentation networks in a 3-fold cross-validation fashion (see 15,16). Using this method, AMIRA images from all MS patients and HC were then automatically segmented as test-datasets. Accuracy of the automatic method compared to manual segmentations for the normal appearing GM, WM and lesions was calculated using Dice similarity coefficients (DSC) and Hausdorff distances (HD). A cubic transformation was performed for DSC and GM/WM areas, whereas a logarithmic transformation was performed for HD. Accuracy comparisons were done using multivariate one-way analysis of variation. To detect differences between MS patients and HC in SC GM and WM at the respective SC levels, linear mixed effect models (LMER) were deployed and the respective regression coefficients (B) were calculated. In MS patients, the correlation with the expanded disability status scale (EDSS) was also examined after correction for significant demographic and clinical factors.Results
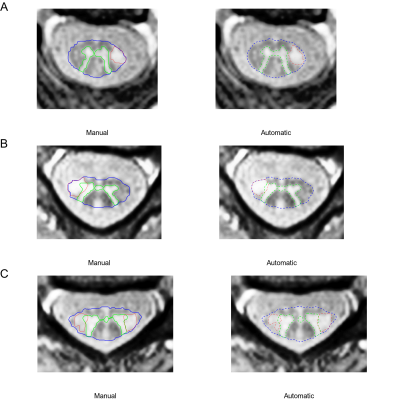
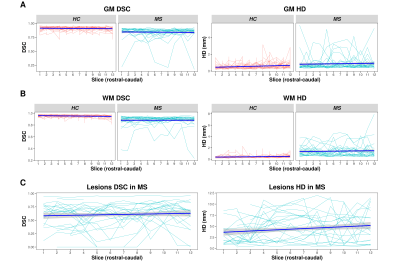
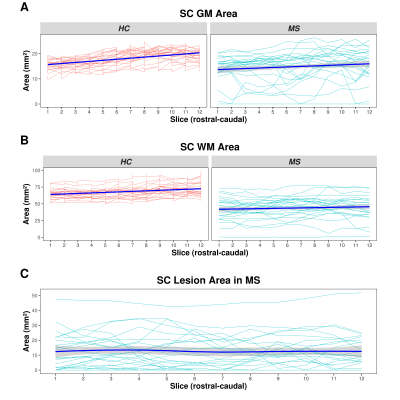
In MS patients, accuracy of the automatic segmentation was high (GM DSC: 0.84 ± 0.09, HD: 0.86 ± 0.79mm; WM DSC: 0.88 ± 0.09, HD: 1.42 ± 1.05mm; see also Figures 1&2), but lower compared to HC (GM DSC: 0.91 ± 0.03, HD: 0.56 ± 0.33; WM DSC: 0.95 ± 0.02, HD: 0.43 ± 0.22; see also Figure 2)(all p<0.001). In both HC and MS patients, accuracy was lower for GM compared to WM and more caudally acquired slices (all p<0.001). Accuracy of the automatic MS lesion segmentation (DSC: 0.62 ± 0.21, HD: 3.24 ± 2.36mm; see also Figure 1&2) was lower than for GM and WM (both p<0.001). In MS patients, larger lesion areas were associated with lower accuracy in GM and WM (both p<0.001), affecting the GM more than the WM (p<0.001). In our LMER, MS patients had lower GM (B=-73.51 ± 30.25mm4, p<0.05) and WM (B=-2508.15 ± 346.03mm4, p<0.001) areas compared to HC (Figure 3). Larger lesion areas were associated with smaller GM (B=-6.08 ± 0.73mm4) and WM (B=-47.55 ± 4.06mm4) areas (both p<0.001). Disease duration, sex and age were not associated with GM and WM areas. However, GM (B=-228.24 ± 35.42mm4, p<0.001), WM (B=-2433.72 ± 301.29mm4, p<0.001) and SC lesion area (B=11.79 ± 3.90mm2, p<0.01) were correlated with the EDSS.Discussion
We applied and assessed the performance of a novel pipeline for automatic quantification of SC GM, WM and lesions in MS patients. The AMIRA sequence was able to produce SC images with a high GM/WM contrast in all participants, whereas the proposed segmentation method showed high accuracy and reliability in all SC compartments. This abstract demonstrates preliminary results using manual segmentations of only one manual rater, whereas the reliability of the proposed segmentation method is expected to further improve after completion of MD-GRU training on manual segmentations of multiple raters. Using this automatic pipeline, MS patients were found to have both lower SC GM and WM areas compared to healthy controls. Focal SC lesions were found to drive this process at least partially. All three metrics (SC GM, WM and lesional areas) were correlated with physical disability.Conclusion
This pipeline allows to accurately assess healthy and MS SC GM, WM and lesional metrics, both in research and clinical settings. Utilization of this pipeline in future cross-sectional and longitudinal studies would contribute to a better understanding of the mechanisms driving physical disability in different MS groups and help improve patient management. Finally, SC metrics have the potential to become important endpoints in future MS clinical trials.Acknowledgements
We would like to thank all multiple sclerosis patients and healthy subjects that participated in this study.References
1. GBD 2015 Neurological Disorders Collaborator Group. Global, regional, and national burden of neurological disorders during 1990-2015: a systematic analysis for the Global Burden of Disease Study 2015. Lancet Neurol 16, 877–897 (2017).
2. Reich, D. S., Lucchinetti, C. F. & Calabresi, P. A. Multiple Sclerosis. New England Journal of Medicine 378, 169–180 (2018).
3. Weier, K. et al. Biplanar MRI for the assessment of the spinal cord in multiple sclerosis. Multiple Sclerosis Journal 18, 1560–1569 (2012).
4. Bot, J. C. J. et al. Spinal cord abnormalities in recently diagnosed MS patients: Added value of spinal MRI examination. Neurology 62, 226–233 (2004).
5. Tsagkas, C. et al. Spinal cord volume loss: A marker of disease progression in multiple sclerosis. Neurology 91, e349–e358 (2018).
6. Tsagkas, C. et al. Preferential spinal cord volume loss in primary progressive multiple sclerosis. Mult. Scler. 1352458518775006 (2018) doi:10.1177/1352458518775006.
7. Schlaeger, R. et al. Spinal cord gray matter atrophy correlates with multiple sclerosis disability. Ann. Neurol. 76, 568–580 (2014).
8. Petrova, N., Carassiti, D., Altmann, D. R., Baker, D. & Schmierer, K. Axonal loss in the multiple sclerosis spinal cord revisited: Axonal Loss in the MS Spinal Cord Revisited. Brain Pathology 28, 334–348 (2018).
9. Weigel, M. & Bieri, O. Spinal cord imaging using averaged magnetization inversion recovery acquisitions. Magnetic Resonance in Medicine 79, 1870–1881 (2018).
10. Prados, F. et al. Fully automated grey and white matter spinal cord segmentation. Scientific Reports 6, 36151 (2016).
11. Datta, E. et al. Gray matter segmentation of the spinal cord with active contours in MR images. NeuroImage 147, 788–799 (2017).
12. Dupont, S. M. et al. Fully-integrated framework for the segmentation and registration of the spinal cord white and gray matter. Neuroimage 150, 358–372 (2017).
13. De Leener, B. et al. SCT: Spinal Cord Toolbox, an open-source software for processing spinal cord MRI data. Neuroimage 145, 24–43 (2017).
14. Tsagkas, C. et al. Automatic Spinal Cord Gray Matter Quantification: A Novel Approach. American Journal of Neuroradiology (2019) doi:10.3174/ajnr.A6157.
15. Andermatt, S., Pezold, S. & Cattin, P. Multi-dimensional Gated Recurrent Units for the Segmentation of Biomedical 3D-Data. in Deep Learning and Data Labeling for Medical Applications (eds. Carneiro, G. et al.) 142–151 (Springer International Publishing, 2016).
16. Horvath, A. et al. Spinal Cord Gray Matter-White Matter Segmentation on Magnetic Resonance AMIRA Images with MD-GRU | SpringerLink. in vol. vol 11397 (Springer, Cham, 2019).
Figures


