1168
Spatial Specificity of BOLD Signal in the Spinal Cord at 7T Using a Noxious Thermal Stimulus1Biomedical Engineering and Imaging Institute, Icahn School of Medicine at Mount Sinai, New York, NY, United States, 2Department of Radiology, Icahn School of Medicine at Mount Sinai, New York, NY, United States, 3Graduate School of Biomedical Sciences, Icahn School of Medicine at Mount Sinai, New York, NY, United States, 4Spinal Cord Injury Center, University Hospital Balgrist, University of Zurich, Zurich, Switzerland, 5Wellcome Centre for Integrative Neuroimaging, FMRIB, University of Oxford, Oxford, United Kingdom
Synopsis
BOLD signal in gradient-echo images is a combination of macrovascular and microvascular contributions, where the macrovascular component, arising from larger veins draining the activated tissue, is less specific to the site of activation. In this work, we image activation produced in the cervical spinal cord by a noxious thermal stimulus at 7T. We consistently observed activation in the dorsal white matter medial to the dorsal horn, rather than in the gray matter itself. However, due to the relatively straightforward venous architecture of the spinal cord, this observed displaced activation does remain closely related to the true site of neuronal activation.
Introduction
The spinal cord contains many neural circuits of scientific and clinical interest1, but fMRI of the spinal cord is complicated by its small size and unfavorable location2. Higher field strengths yield greater SNR and finer spatial resolution, but the spatial specificity of the BOLD signal to the actual site of neuronal activation is complicated. BOLD signal in gradient-echo (GRE) images is a combination of macrovascular and microvascular contributions, where the macrovascular component, arising from larger veins draining the activated tissue, is less specific to the site of activation. Increasing field strength increases the microvascular BOLD signal to a greater extent than the macrovascular BOLD signal, leading to greater spatial specificity in gradient-echo EPI (GRE-EPI)3,4. In this work, we image activation produced in the cervical spinal cord by a noxious thermal stimulus using two 7T BOLD fMRI protocols: single-shot GRE-EPI, and 4-shot GRE-EPI. The multi-shot protocol provides reduced spatial distortion and signal drop-out.Methods
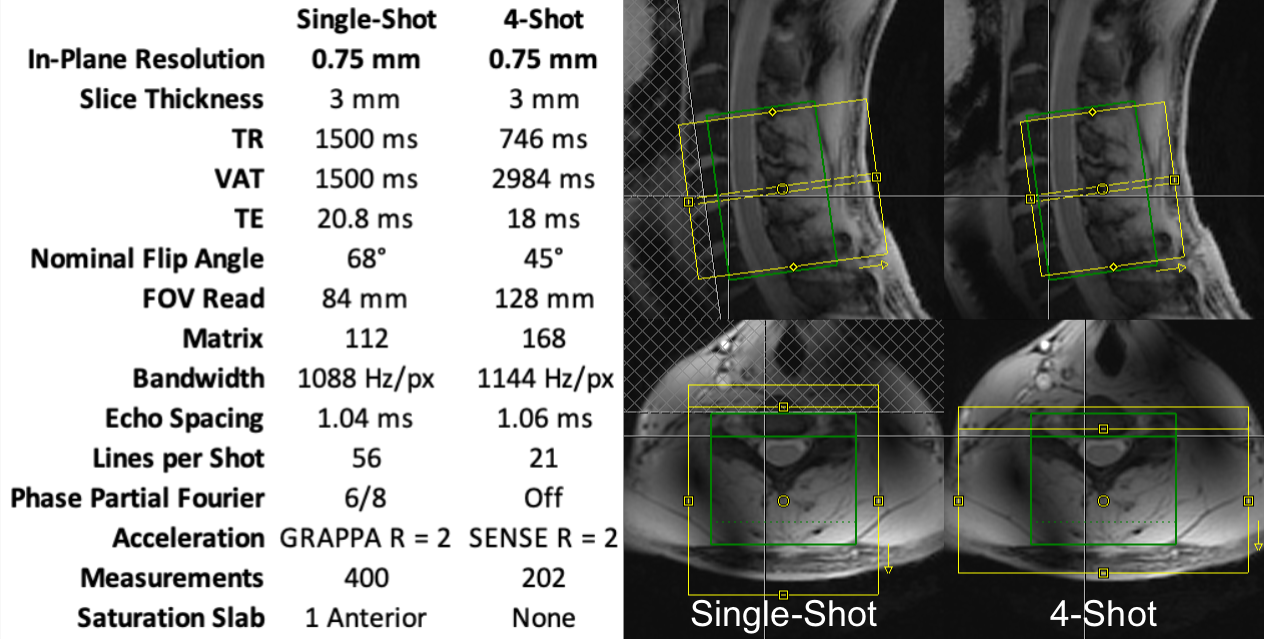
The cervical spinal cords (C4-C7 vertebral levels) of eight healthy volunteers were scanned using a 7T whole-body MRI system (Magnetom, Siemens) and a 22-channel RF coil5. Detailed parameters are tabulated in Figure 1. Pulse-oximeter and respiratory traces were simultaneously acquired. Multi-shot reconstruction included a navigator-based per-shot frequency offset demodulation to mitigate respiratory field variations.In each 10min experiment, noxious thermal stimulation was applied to the lateral surface of the base of the right thumb at a calibrated intensity of 3/10 using an fMRI-compatible thermal stimulator (TSA-II, Medoc). Stimuli were 10s in duration, baseline temperature was 32°C, and inter-stimulus intervals were randomized between 25-45s. This stimulus should produce sensory activation in the ipsilateral dorsal horn at the neurological C6 (vertebral C5) level.
Four-dimensional timeseries images were motion-corrected slicewise (x- and y-translation) using FSL FLIRT6, straightened using Spinal Cord Toolbox7, and spatially smoothed using an anisotropic Gaussian kernel (2mm in-plane, 6mm through-slice). GLM analysis was performed within a mask of the spinal cord in FSL FEAT8, incorporating a 37-term physiological noise model (8 cardiac, 8 respiratory, 16 interaction, heart rate, respiratory volume per time, CSF signal, and 2 motion correction terms)9.
Results
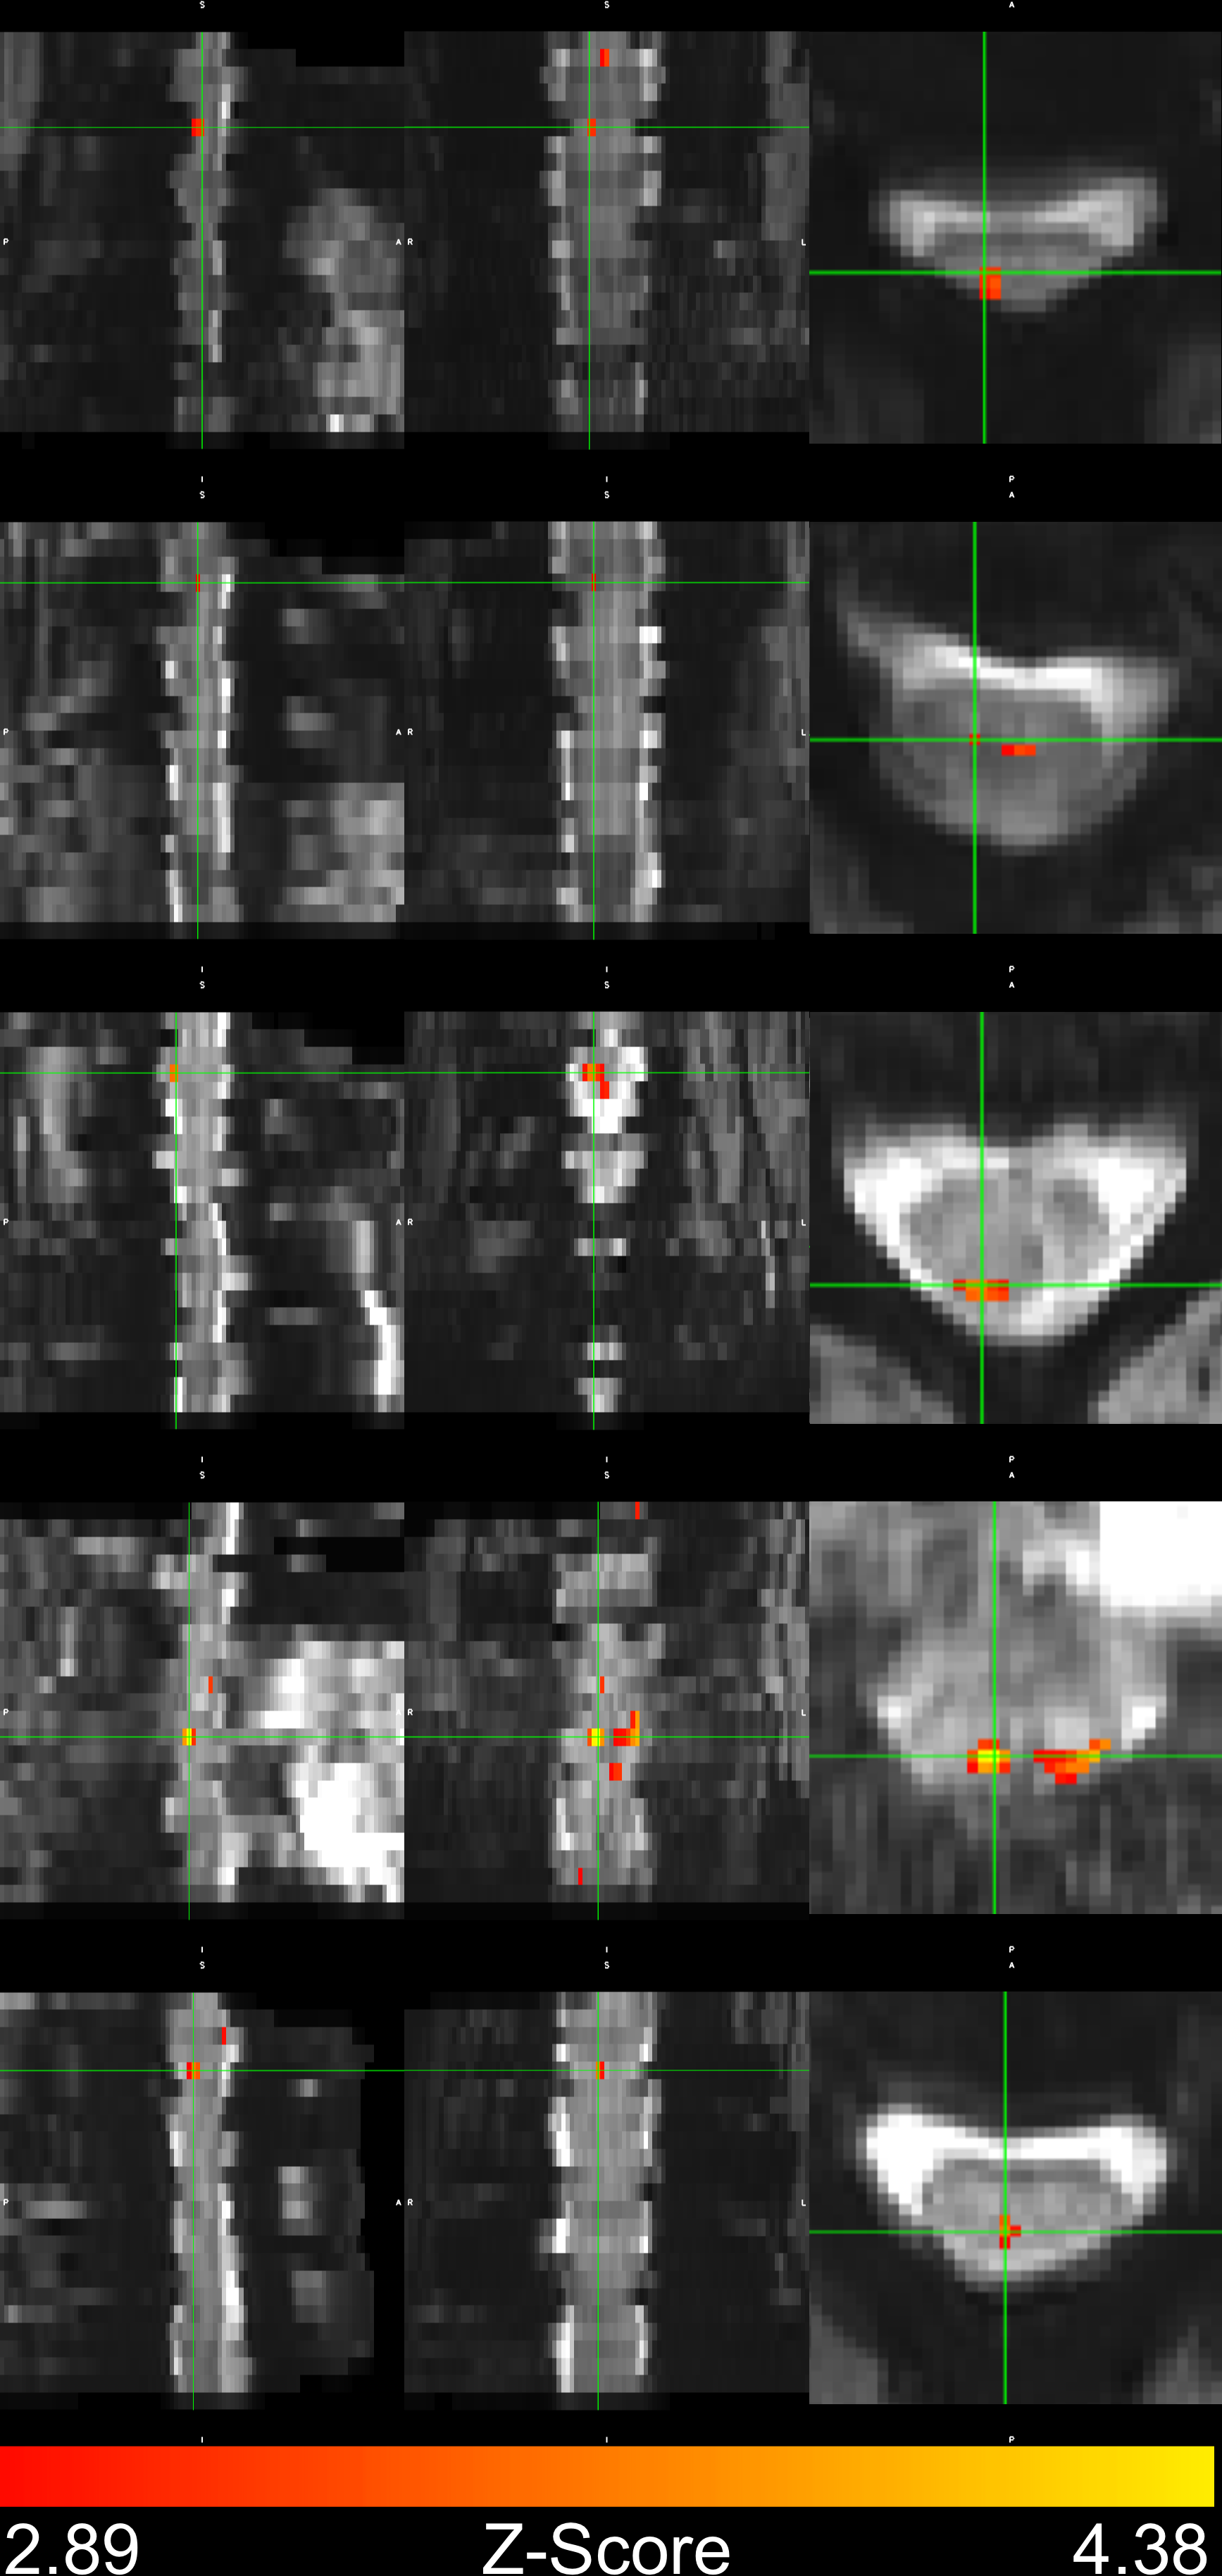
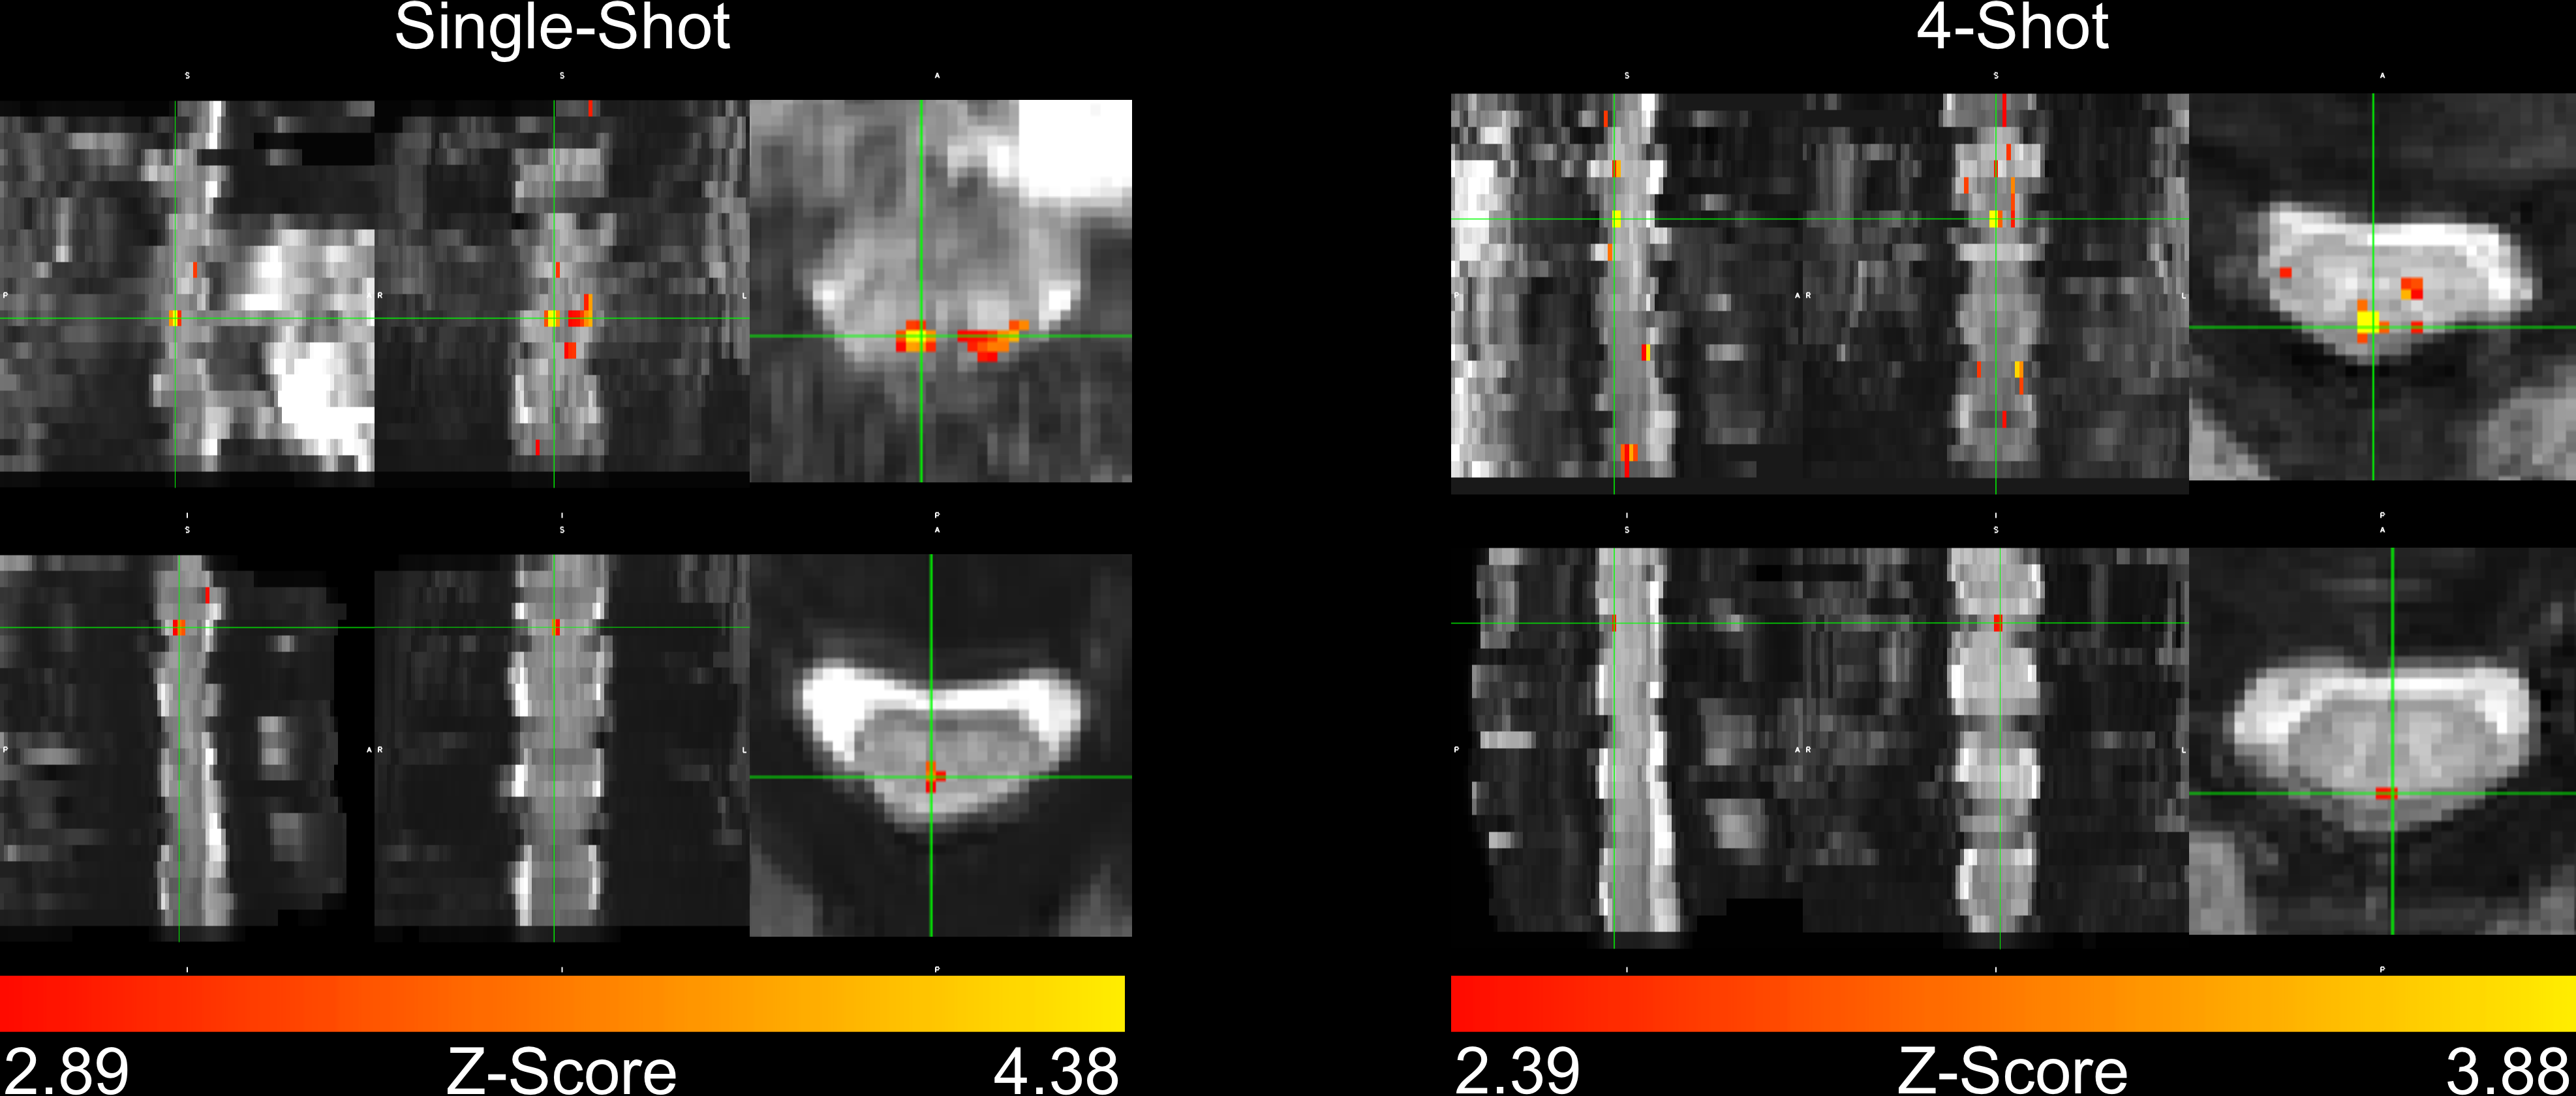
In four subjects, activation occurred in the dorsal column white matter adjacent to the dorsal nerve root (Figure 2). In one subject, activation occurred within the dorsal horn gray matter (Figure 2, row 2), and in three subjects, activation was not detected due to through-slice dephasing and respiratory signal contamination (not illustrated).Four-shot reconstructions were available in two subjects. Activation in 4-shot images also occurred in the dorsal column white matter, in the same location in the transverse plane as in the single-shot images (Figure 3). In one subject, activation occurs one vertebral level lower than expected in the single-shot image, due to subject motion shifting the thermal stimulator to the palmar surface of the hand before the single-shot scan.
Discussion
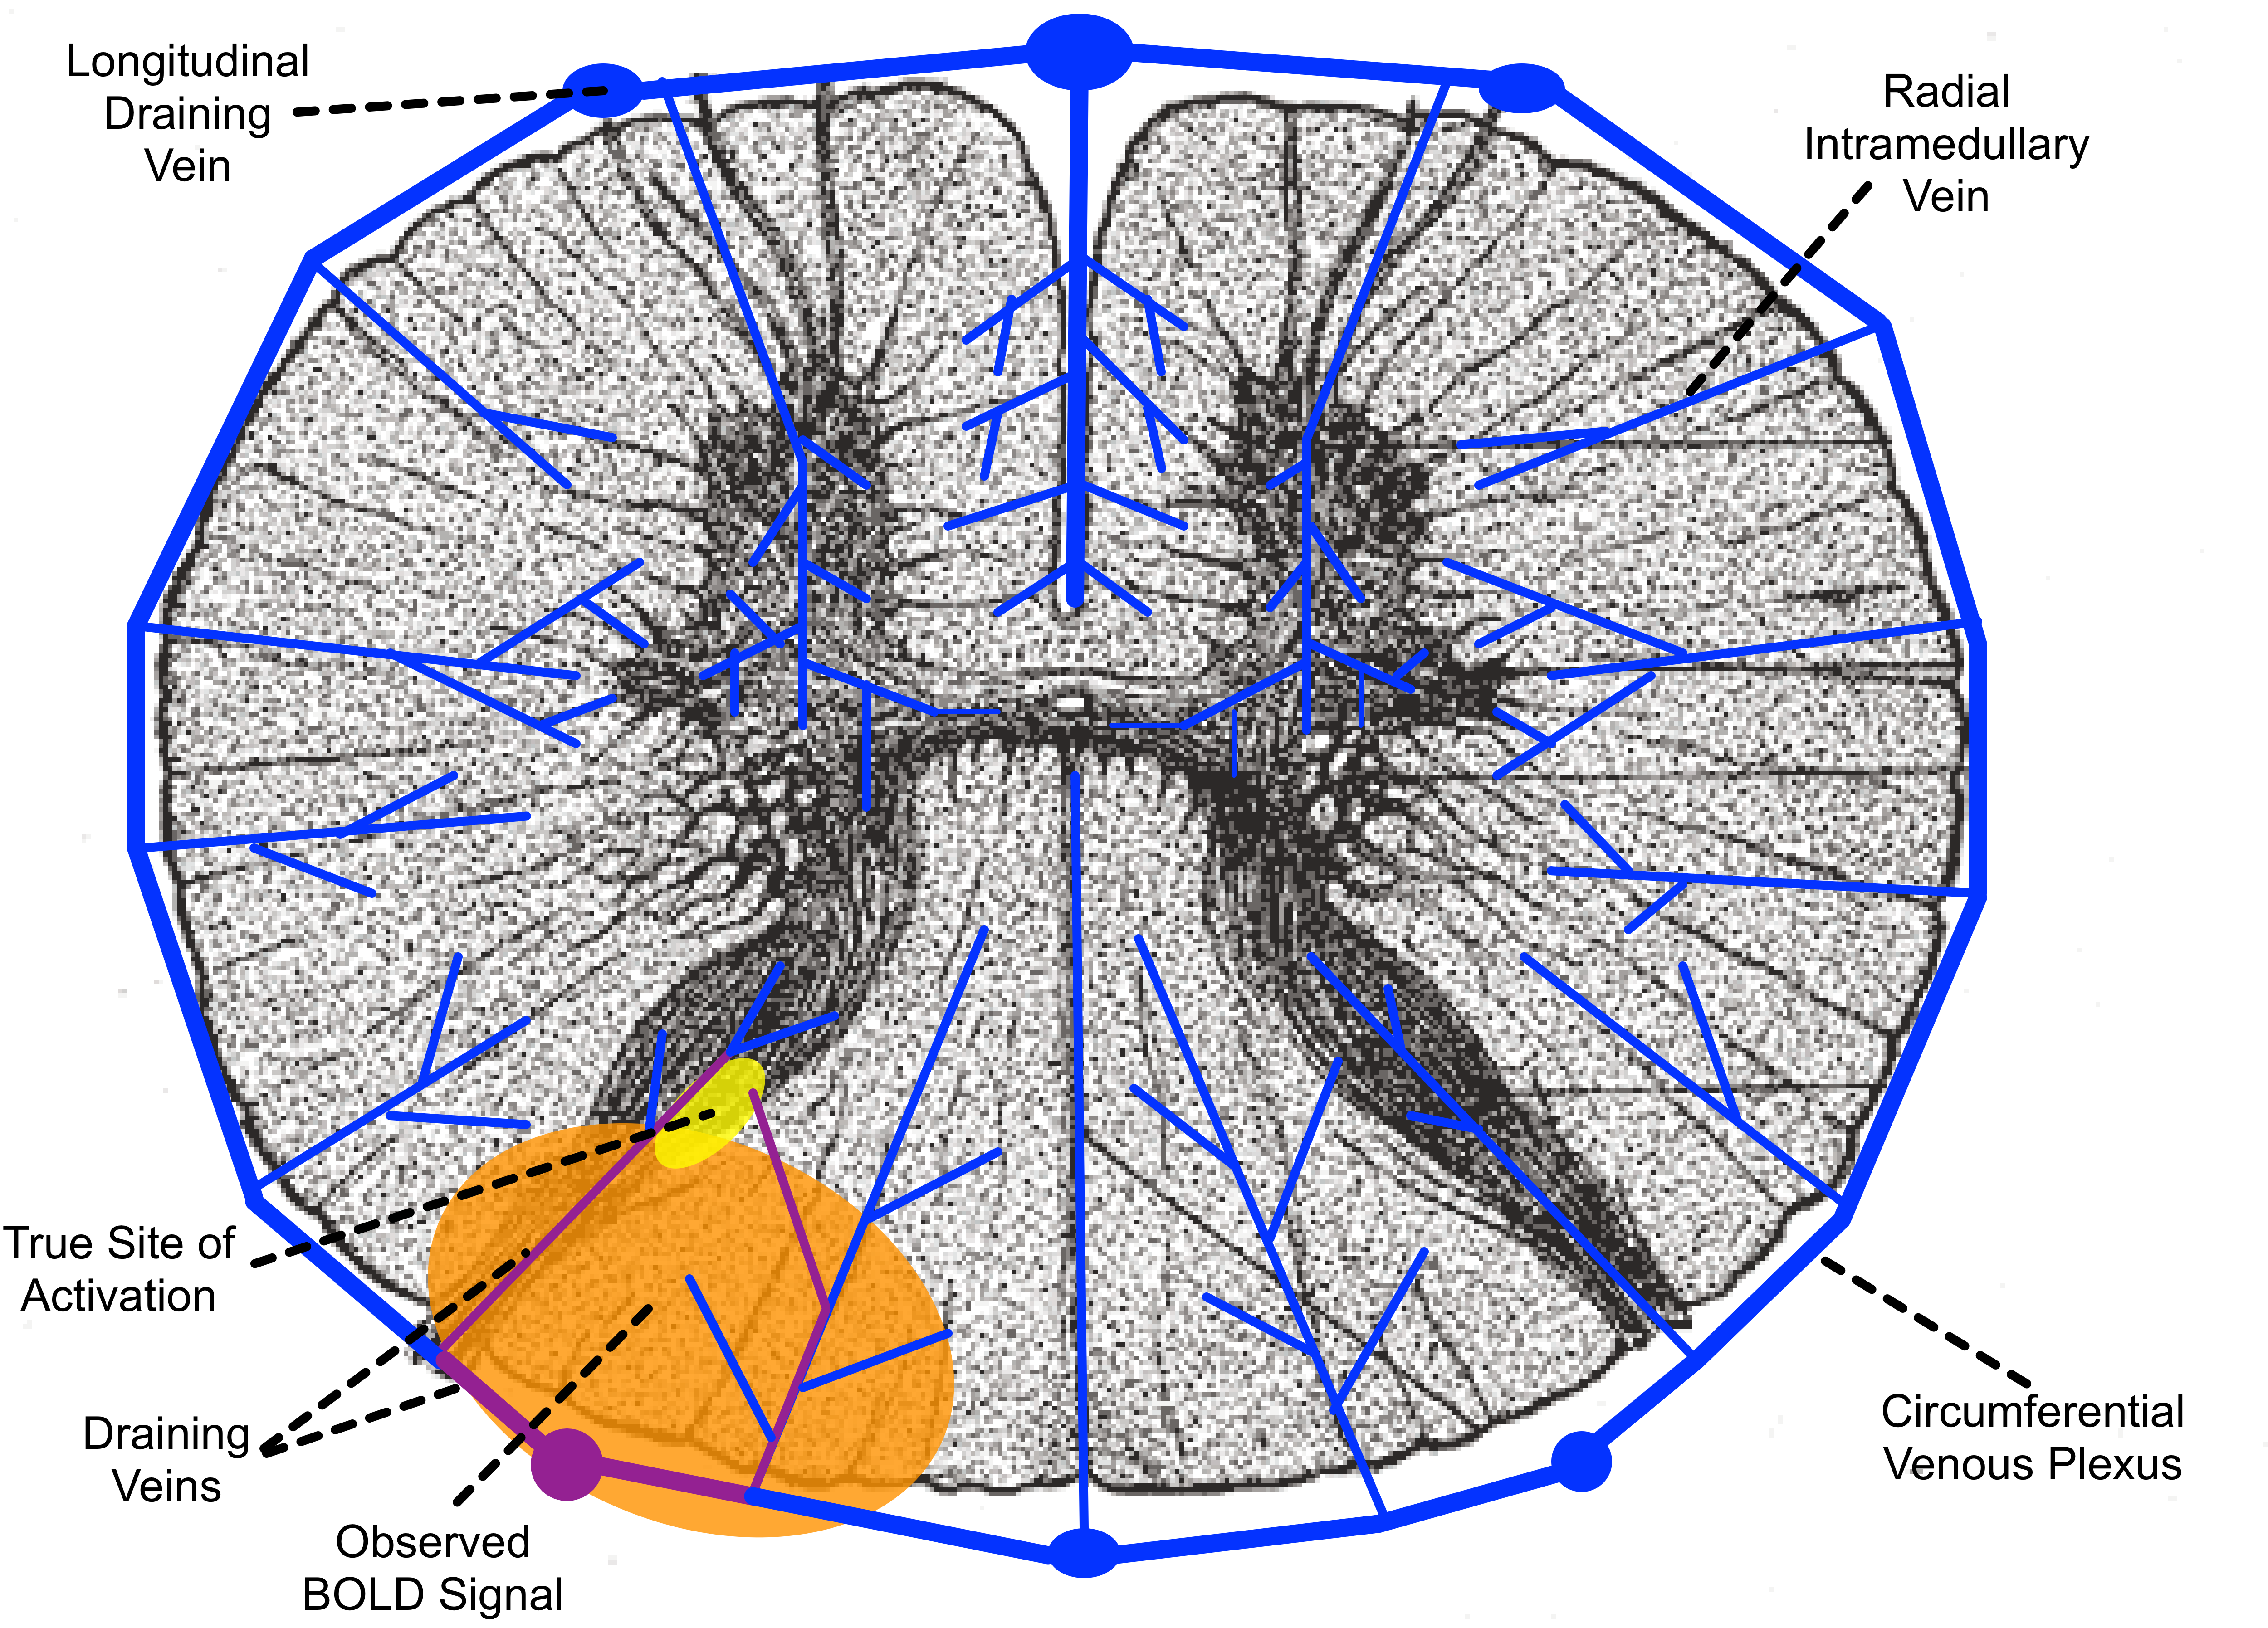
Although the microvascular BOLD signal increases by a greater factor than the macrovascular BOLD signal as field strength increases, larger veins still produce the greatest BOLD signal in GRE-EPI at 7T, as they do at lower fields10. However, the organization of the venous drainage in the spinal cord (Figure 4) leads to a more straightforward relationship between the location of macrovascular BOLD signal and the site of neuronal activation than in the cortex11–13. Radial intramedullary veins drain into a circumferential plexus on the surface of the cord, which in turn drains into six larger longitudinal veins, then into radicular veins that exit the spinal canal along nerve roots. The intramedullary veins are small and roughly orthogonal to B0, so they produce strong extravascular BOLD signal changes related to neuronal activation within their specific watersheds. The larger longitudinal veins produce less BOLD signal, due to their orientation largely parallel to B0 and the dilution of more oxygenated venous blood from activated tissue with less oxygenated blood from unactivated tissue elsewhere in their watershed.The venous architecture in the spinal cord explains our observed BOLD activation in white matter. Activation in the dorsal horn gray matter (Figure 4, yellow) causes changes in blood oxygenation in the intramedullary veins and venous plexus draining the activated tissue (Figure 4, purple), producing BOLD signal change in the white matter tissue (Figure 4, orange) surrounding these veins. Because the venous plexus drains toward the midline, activation is observed in the dorsal, rather than the lateral, white matter. Although this activation is displaced in space from the site of neuronal activation, the radial intramedullary venous architecture means that this displaced activation has a clear and direct relation to the true site of activation.
If greater specificity is desired, phase-based post-acquisition suppression of macrovascular BOLD contribution14,15 and spin-echo-based fMRI16,17 have been demonstrated at lower fields, but may prove difficult at 7T where SAR limits are more significant and background phase distortions due to respiration are more severe.
Conclusion
We have consistently observed noxious thermal stimulus activation in the spinal cord dorsal white matter, rather than in the gray matter itself. Based on the spinal cord vascular architecture, this observed displaced activation remains closely related to the true site of neuronal activation.Acknowledgements
This study was supported by National Institutes of Health (NINDS) award number K01NS105160 (ACS).References
1. Stroman, P. W. et al. The current state-of-the-art of spinal cord imaging: methods. NeuroImage 84, 1070–1081 (2014).
2. Cohen-Adad, J. Functional Magnetic Resonance Imaging of the Spinal Cord: Current Status and Future Developments. Semin. Ultrasound CT MR 38, 176–186 (2017).
3. Yacoub, E. et al. Imaging brain function in humans at 7 Tesla. Magn. Reson. Med. 45, 588–594 (2001).
4. Gati, J. S., Menon, R. S., Ugurbil, K. & Rutt, B. K. Experimental determination of the BOLD field strength dependence in vessels and tissue. Magn. Reson. Med. 38, 296–302 (1997).
5. Zhang, B., Seifert, A. C., Kim, J.-W., Borrello, J. & Xu, J. 7 Tesla 22-channel wrap-around coil array for cervical spinal cord and brainstem imaging. Magn. Reson. Med. 78, 1623–1634 (2017).
6. Jenkinson, M. & Smith, S. A global optimisation method for robust affine registration of brain images. Med Image Anal 5, 143–156 (2001).
7. De Leener, B. et al. SCT: Spinal Cord Toolbox, an open-source software for processing spinal cord MRI data. NeuroImage 145, 24–43 (2017).
8. Woolrich, M. W., Ripley, B. D., Brady, M. & Smith, S. M. Temporal autocorrelation in univariate linear modeling of FMRI data. Neuroimage 14, 1370–1386 (2001).
9. Kong, Y., Jenkinson, M., Andersson, J., Tracey, I. & Brooks, J. C. W. Assessment of physiological noise modelling methods for functional imaging of the spinal cord. NeuroImage 60, 1538–1549 (2012).
10. Turner, R. How Much Cortex Can a Vein Drain? Downstream Dilution of Activation-Related Cerebral Blood Oxygenation Changes. NeuroImage 16, 1062–1067 (2002).
11. Cohen-Adad, J. et al. BOLD signal responses to controlled hypercapnia in human spinal cord. NeuroImage 50, 1074–1084 (2010).
12. Bouwman, C. J. C., Wilmink, J. T., Mess, W. H. & Backes, W. H. Spinal cord functional MRI at 3 T: gradient echo echo-planar imaging versus turbo spin echo. NeuroImage 43, 288–296 (2008).
13. Giove, F. et al. Issues about the fMRI of the human spinal cord. Magnetic Resonance Imaging 22, 1505–1516 (2004).
14. Menon, R. S. Postacquisition suppression of large-vessel BOLD signals in high-resolution fMRI. Magn. Reson. Med. 47, 1–9 (2002).
15. Barry, R. L., Strother, S. C. & Gore, J. C. Complex and magnitude-only preprocessing of 2D and 3D BOLD fMRI data at 7 T. Magn. Reson. Med. 67, 867–871 (2012).
16. Stroman, P. W., Kornelsen, J., Lawrence, J. & Malisza, K. L. Functional magnetic resonance imaging based on SEEP contrast: response function and anatomical specificity. Magnetic Resonance Imaging 23, 843–850 (2005).
17. Figley, C. R., Leitch, J. K. & Stroman, P. W. In contrast to BOLD: signal enhancement by extravascular water protons as an alternative mechanism of endogenous fMRI signal change. Magnetic Resonance Imaging 28, 1234–1243 (2010).
Figures