1165
Efficient Measurement of Composite Metric R2-R1ρ in Knee Cartilage1Radiology and Biomedical Imaging, University of California, San Francisco, San Francisco, CA, United States, 2Center for Digital Health Innovation, University of California, San Francisco, San Francisco, CA, United States
Synopsis
Cartilage degeneration, characterized by collagen structure disruption, proteoglycan depletion, and increased water content, has been shown to alter T2 and T1ρ relaxation times. A composite metric, R2-R1ρ, which further reflects an anisotropic component of R2, has recently demonstrated high sensitivity to cartilage degeneration; however, quantification of R2 and R1ρ respectively requires long scan times. In this work, we validated the potential of assessing R2-R1ρ using one pair of signals with T1ρ preparation and T2 preparation from a combined T1ρ/T2 quantification sequence for in vivo knee MRI at 3T.
Introduction
Cartilage degeneration, characterized by collagen structure disruption, proteoglycan depletion, and increased water content, has been shown to alter T2 and T1ρ relaxation times.1 A composite metric, R2-R1ρ (1/T2-1/T1ρ), which further reflects an anisotropic component of R2,2 has recently demonstrated high sensitivity to cartilage degeneration.3-4 However, quantification of both R2 and R1ρ respectively requires long scan times. In this work, we validated the potential of assessing R2-R1ρ efficiently using one pair of signals with T1ρ preparation and T2 preparation from a combined T1ρ/T2 quantification sequence4-5 for in vivo knee MRI at 3T.Methods
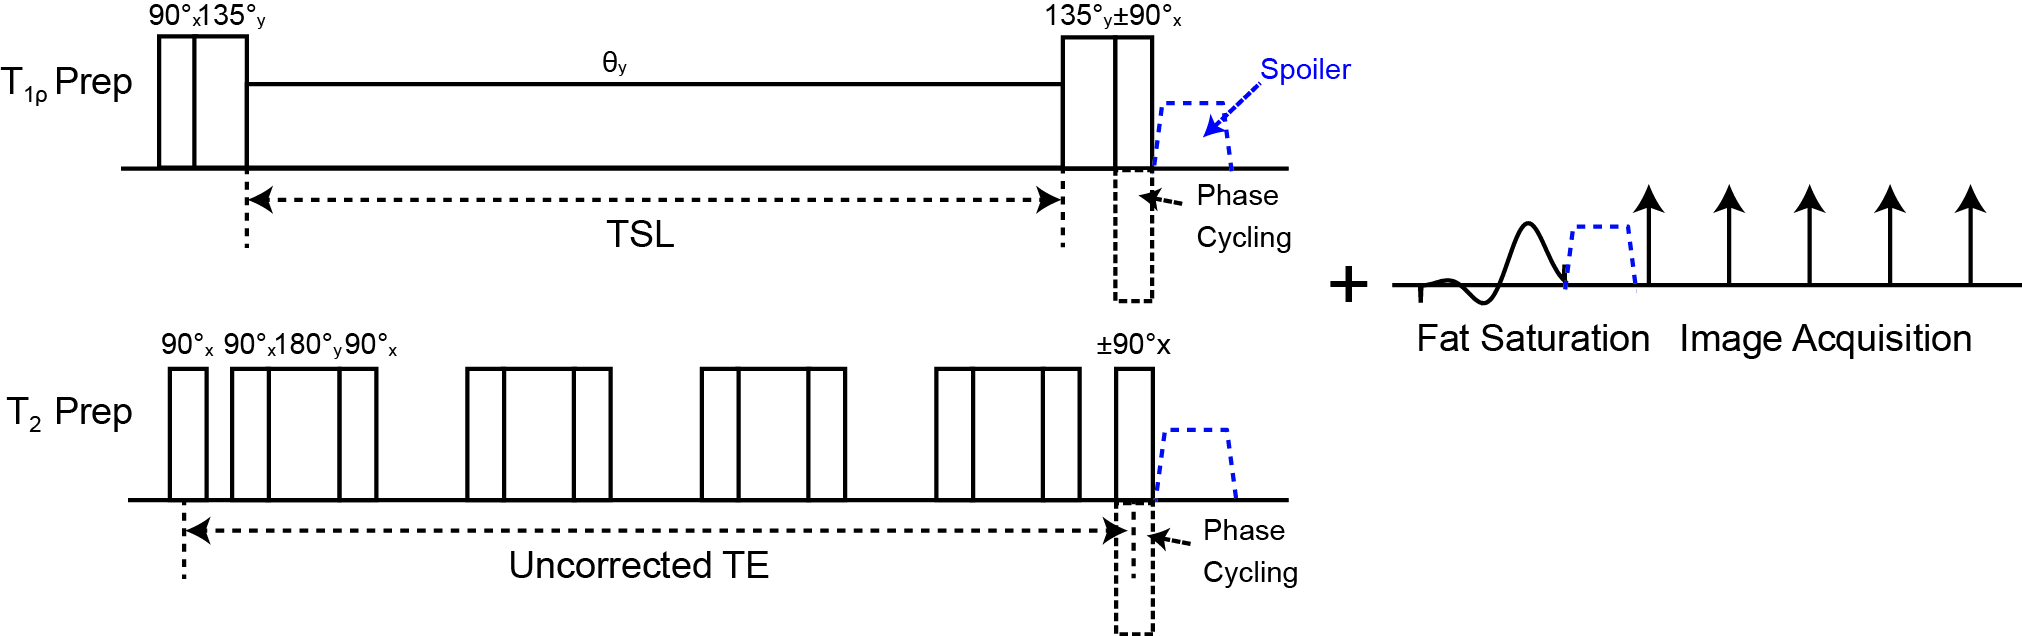
Our combined T1ρ/T2 quantification sequence used T1ρ or T2 preparation incorporated to 3D acquisition, magnetization-prepared angle-modulated partitioned k-space spoiled gradient echo snapshots (3D MAPSS).5-6 T1ρ preparation used composite tip-down and tip-up pulses7 while T2 preparation used a Malcolm Levitt (MLEV) train of nonselective composite 90°-180°-90° refocusing pulses,8 combined with RF phase cycling9 to provide less sensitivity to B0 and B1 inhomogeneities (Fig. 1). A chemical selective fat suppression pulse was applied following T1ρ/T2 preparation to provide similar fat suppression quality to images with different magnetization preparation. Assuming S1ρ(Tprep)=S0*exp(-Tprep/T1ρ) and S2(Tprep)= S0*exp(-Tprep/T2), R2-R1ρ can be computed as (-ln(S2(Tprep))+ln(S1ρ(Tprep)))/Tprep.Image Acquisition
In vivo validation was performed using a GE Discovery MR750 scanner (GE Healthcare, Waukesha, WI) and a 16-channel flex-coil array (Neo-Coil, Pewaukee, WI) with one healthy subject and three patients having osteoarthritis after obtaining informed consent. First, a combined T1ρ/T2 quantification sequence was performed with spin-lock times (TSLs) of 0, 12.85, 40, 80 ms, spin lock frequency of 500 Hz, and TEs of 0, 12.85, 25.70, and 51.39 ms to quantify T1ρ and T2 respectively (7-echo MAPSS, TSL=0 images were also used as TE=0 images). A field of view of 14x14 cm2, 256x128 matrix size, 4 mm slice thickness, 22 slices, 64 view acquisition per T1ρ or T2 preparation, and in-plane ARC acceleration10 by a factor of two were prescribed, resulting in 9.8 min scan time. Afterwards, a combined sequence with one TSL and one TE (2-echo MAPSS) was performed by varying TSL=TE=Tprep from 12.85 ms, 17.69 ms, 25.70 ms, to 38.54 ms using equivalent acquisition parameters.
Image Post-Processing and Quantification
Rigid registration between different TSL/TE images was first applied for all respective data sets. Seven-echo MAPSS images were used to acquire T1ρ and T2 maps through exponential curve fitting employing the Levenberg-Marquardt method, and then reference R2-R1ρ maps were obtained. From 2-echo MAPSS images, R2-R1ρ maps were calculated using negative logarithm of the signals. Cartilage was segmented semi-automatically into five different compartments, lateral/medial femur (LF/MF), lateral/medial tibia (LT/MT), and patellar (PT) using in-house developed software,11 with each compartment segmented on 4-6 slices of the second-TSL images. The mean R2-R1ρ values were computed for each compartment.6 The optimal Tprep to provide R2-R1ρ close to the reference values was determined.
Results
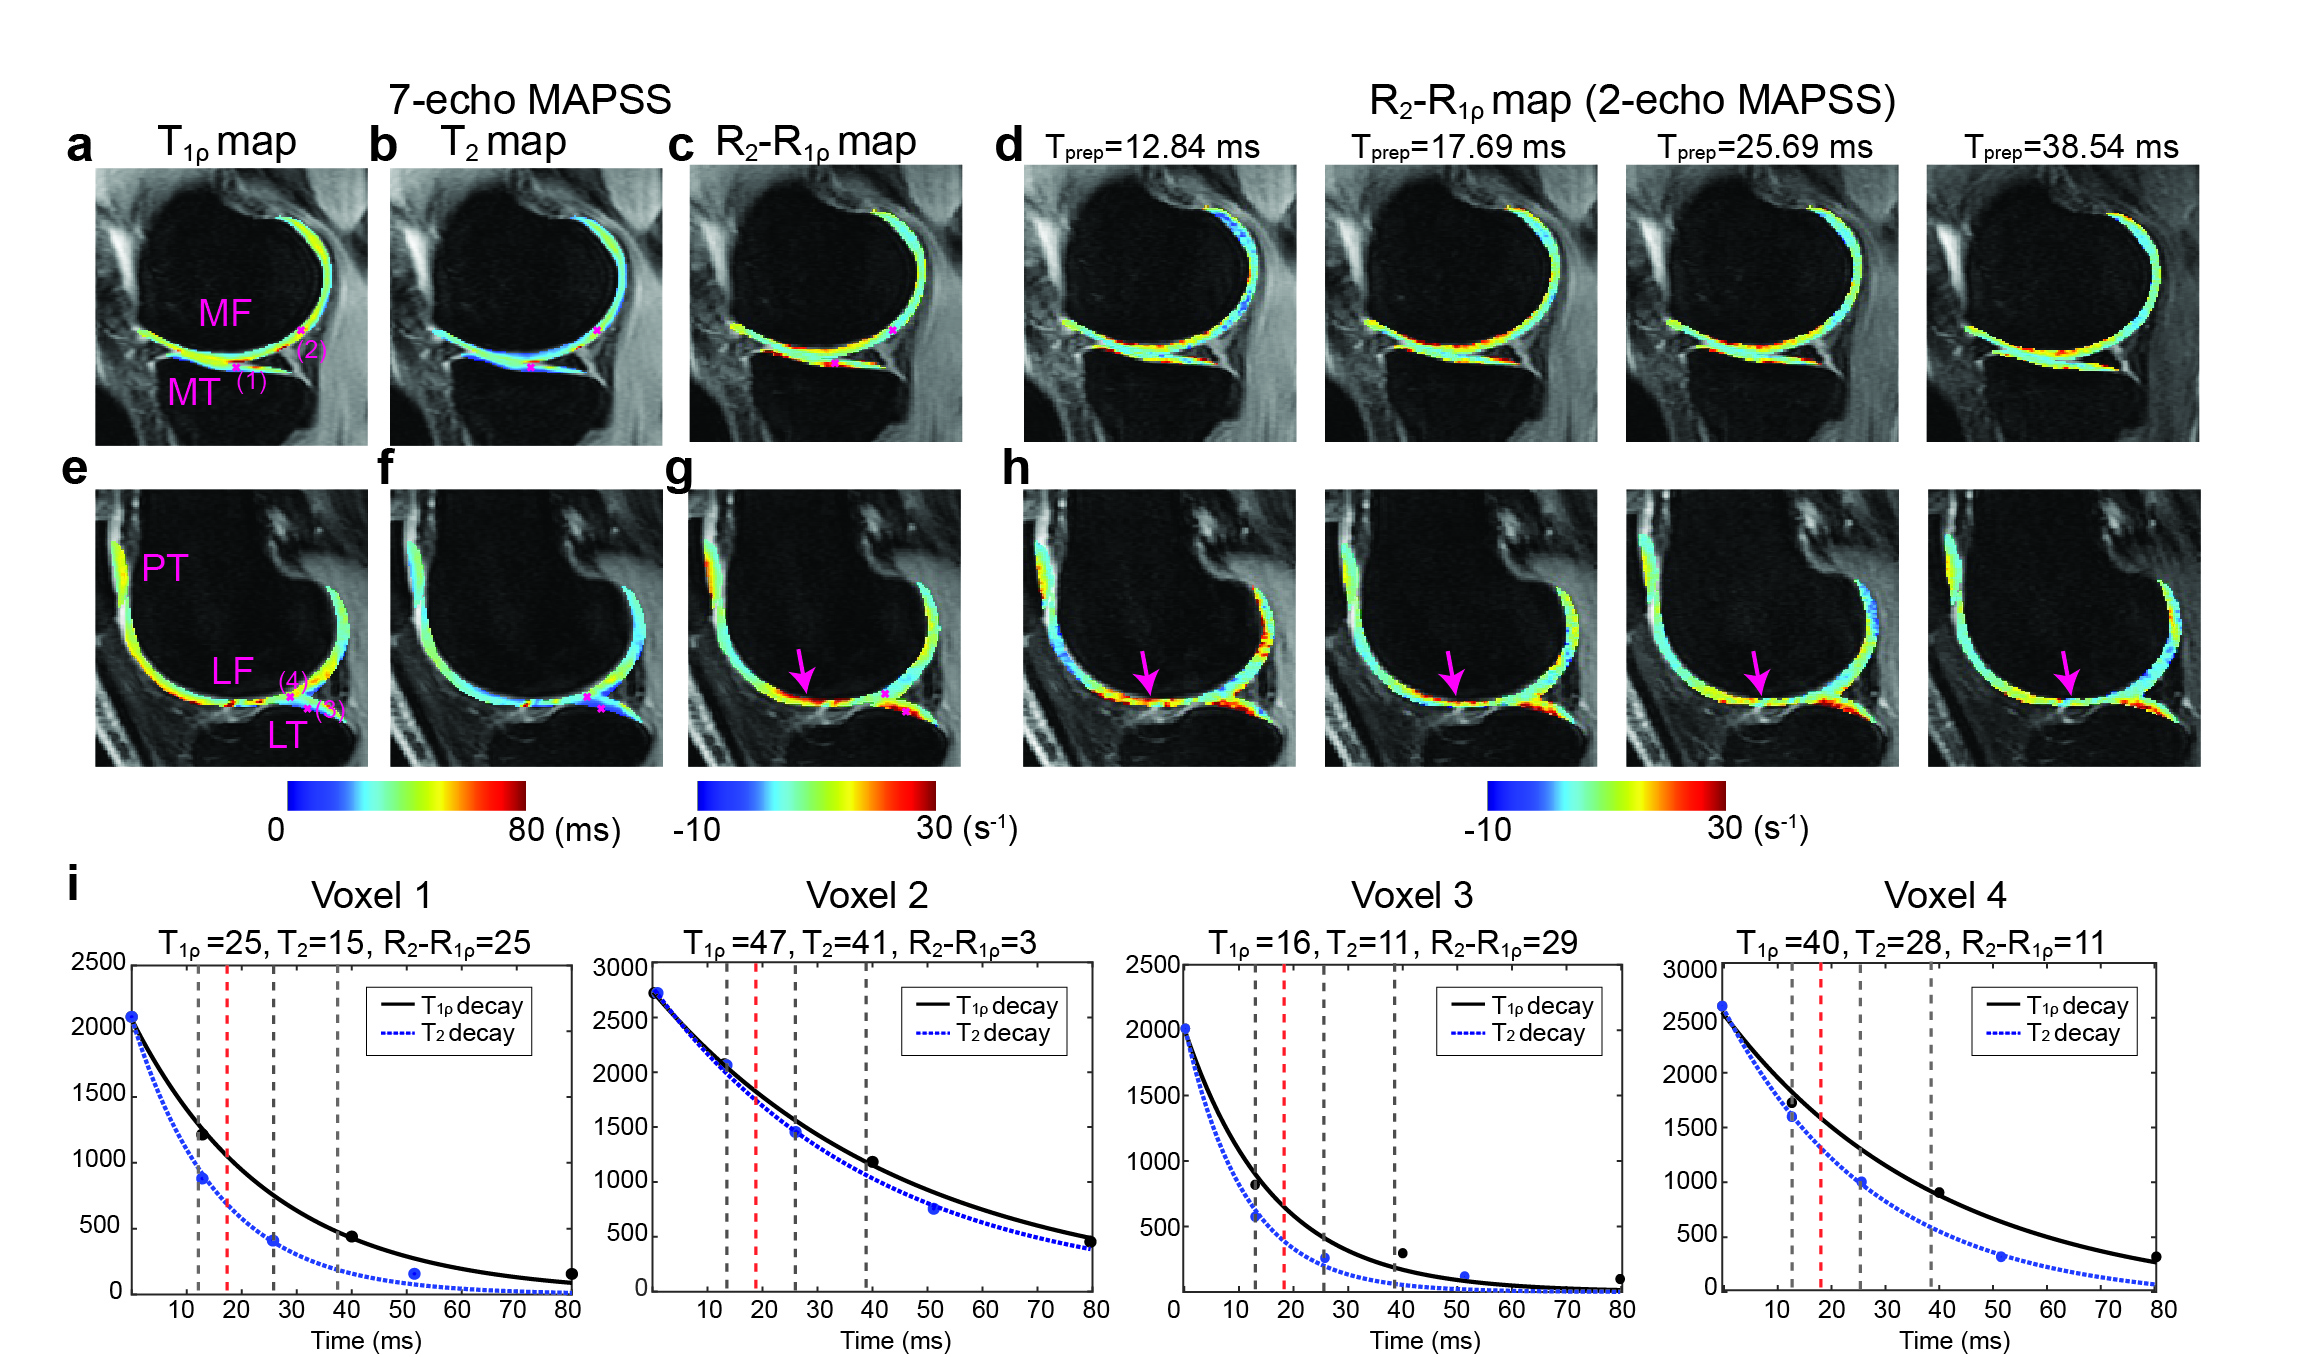
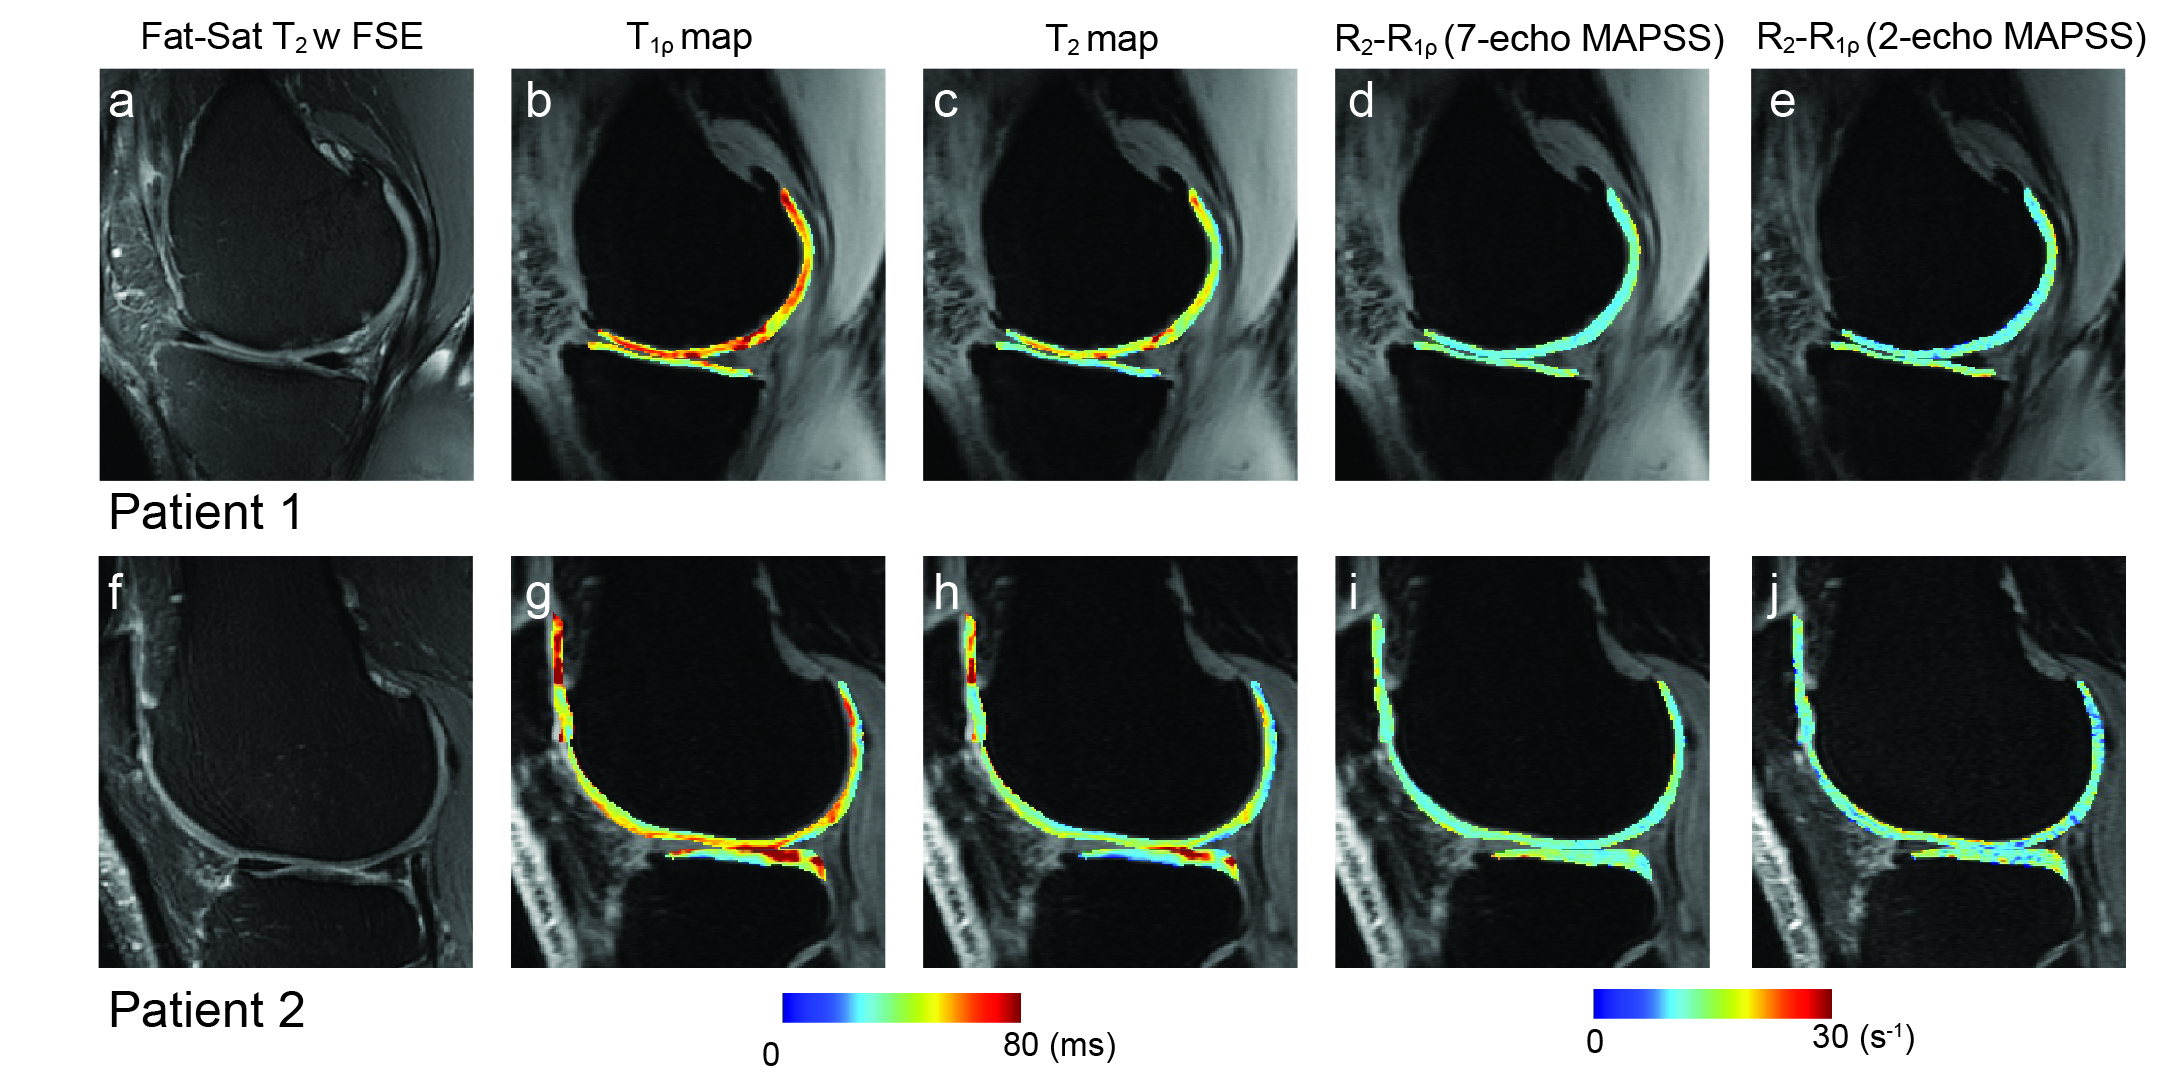
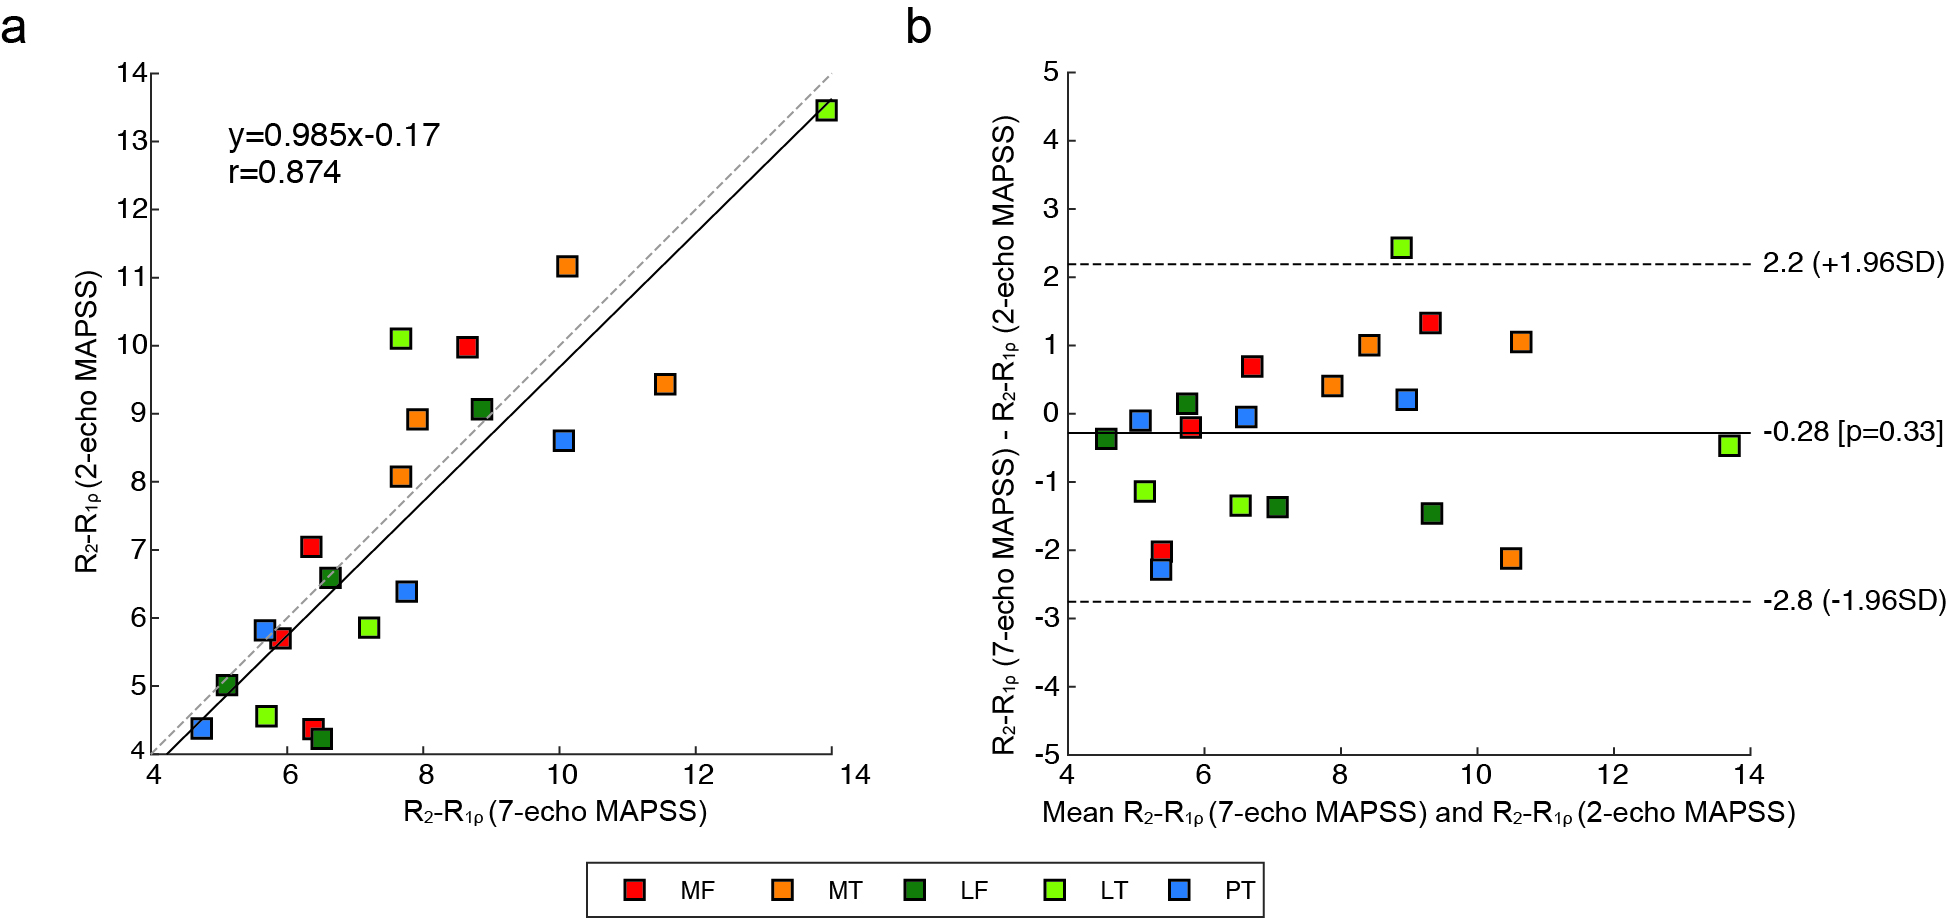
Figure 2 shows results from the healthy subject, where Fig. 2a-c and e-g shows T1ρ, T2, and R2-R1ρ maps at two different slice locations from 7-echo MAPSS, and Fig. 2d and h shows R2-R1ρ maps from 2-echo MAPSS. The deep layers, which consist of highly organized collagen fibers,12 have relatively shorter T1ρ and T2 values and higher R2-R1ρ compared to the superficial layers. We can see Tprep affected R2-R1ρ from 2-echo MAPSS as too small or long Tprep times can yield ln(S1ρ(Tprep))-ln(S2(Tprep)) dominated by image noise. Here, Tprep=17.69 ms provided R2-R1ρ the most similar to reference values. Figure 2i depicts acquired signals from 7-echo MAPSS and fitted T2 and T1ρ decay curves on the four cartilage voxels with various T1ρ/T2 relaxation times. We can see that Tprep=17.69 ms would provide an appropriate signal difference between S1ρ(Tprep) and S2(Tprep) from cartilage. Figure 3 shows patient results, T1ρ, T2, and R2-R1ρ maps from 7-echo MAPSS as well as R2-R1ρ maps from 2-echo MAPPS with Tprep=17.69 ms. Elevated T1ρ and T2 values and lower R2-R1ρ values were observed compared to the healthy subject. Again, R2-R1ρ from 2-echo MAPSS matched well with the reference values. Figure 4 compares the mean R2-R1ρ values of the five different cartilage compartments over the four subjects from 7-echo MAPSS and 2-echo MAPPS with Tprep=17.69 ms. The Pearson correlation coefficient between the two different measurements was 0.87, and the Bland-Altman plot also indicate a good agreement between those.Discussion and Conclusion
We demonstrated R2-R1ρ values measured from 2-echo MAPSS show a good agreement with those from 7-echo MAPSS. T1ρ and T2 preparation incorporating composite RF pulses and phase cycling provides reduced sensitivity to B0 and B1 inhomogeneities, allowing for reliable assessment of R2-R1ρ using the negative logarithms of acquired signals. For two subjects, measured B0 field inhomogeneities were mostly within ±30 Hz and relative B1 variations were 0.93-1.13 in the cartilage regions. TSL/TE times should be carefully determined to yield the difference between the logarithms of the acquired signals is not dominated by image noise. From our data, R2-R1ρ in patients was lower than the healthy subject as previously reported,3-4 indicating reduced anisotropy probably due to breakdown of cartilage collagen network.Acknowledgements
This work was supported by NIH/NIAMS R01AR069006.References
1. Li X, Benjamin Ma C, Link TM, Castillo DD, Blumenkrantz G, Lozano J, Carballido-Gamio J, Ries M, Majumdar S. In vivo T(1rho) and T(2) mapping of articular cartilage in osteoarthritis of the knee using 3 T MRI. Osteoarthritis Cartilage 2007;15(7):789-97.
2. Pang Y, Palmieri-Smith RM, Malyarenko DI, Swanson SD, Chenevert TL. A unique anisotropic R(2) of collagen degeneration (ARCADE) mapping as an efficient alternative to composite relaxation metric (R(2) -R(1) (ρ) ) in human knee cartilage study. Magn Reson Med 2019;81(6):3763-3774.
3. Russell C, Pedoia V, Majumdar S; AF-ACL Consortium. Composite metric R(2)- R(1ρ) (1/T(2) - 1/T(1ρ) ) as a potential MR imaging biomarker associated with changes in pain after ACL reconstruction: A six-month follow-up. J Orthop Res 2017;35(3):718-729.
4. Pedoia V, Haefeli J, Morioka K, Teng HL, Nardo L, Souza RB, Ferguson AR, Majumdar S. MRI and biomechanics multidimensional data analysis reveals R(2) -R(1ρ) as an early predictor of cartilage lesion progression in knee osteoarthritis. J Magn Reson Imaging 2018;47(1):78-90.
5. Li X, Han ET, Busse RF, Majumdar S. In vivo T(1rho) mapping in cartilage using 3D magnetization-prepared angle-modulated partitioned k-space spoiled gradient echo snapshots (3D MAPSS). Magn Reson Med 2008;59(2):298-307
6. Li X, Wyatt C, Rivoire J, Han E, Chen W, Schooler J, Liang F, Shet K, Souza R, Majumdar S. Simultaneous acquisition of T1ρ and T2 quantification in knee cartilage: repeatability and diurnal variation. J Magn Reson Imaging 2014;39(5):1287-93.
7. Dixon WT, Oshinski JN, Trudeau JD, Arnold BC, Pettigrew RI. Myocardial suppression in vivo by spin locking with composite pulses. Magn Reson Med 1996;36(1):90-4.
8. Foltz WD, Stainsby JA, Wright GA. T2 accuracy on a whole-body imager. Magn Reson Med 1997;38(5):759-68.
9. Chen W, Takahashi A, Han E. Quantitative T(1)(ρ) imaging using phase cycling for B0 and B1 field inhomogeneity compensation. Magn Reson Imaging 2011;29(5):608-19.
10. Beatty PJ, Brau AC, Chang S, Joshi SM, Michelich CR, Bayram E, Nelson TE, Herfkens RJ, Brittain JH. A method for autocalibrating 2-D accelerated volumetric parallel imaging with clinically practical reconstruction times. In: Proceedings of the 15th Annual Meeting of ISMRM, Berlin, Germany, 2007. p. 1749.
11. Carballido-Gamio J, Bauer JS, Stahl R, Lee KY, Krause S, Link TM, Majumdar S. Inter-subject comparison of MRI knee cartilage thickness. Med Image Anal 2008;12(2):120-35.
12. Xia Y. Relaxation anisotropy in cartilage by NMR microscopy (muMRI) at 14-microm resolution. Magn Reson Med 1998;39(6):941-9.
Figures