1164
Muscular fat infiltration in FSHD starts with a “fat burst” near the distal tendon and advances towards the proximal tendon1Radiology and Nuclear Medicine, Radboud university medical center, Nijmegen, Netherlands, 2Aix Marseille Univ, Université de Toulon, CNRS, LIS, Marseille, France, 3Aix Marseille Univ, CNRS, CRMBM, Marseille, France
Synopsis
In patients with facioscapulohumeral muscular dystrophy (FSHD) it is known what the genetic origin of the disease is, but unknown how it is initiated and propagates along muscles. In a cross-sectional and longitudinal study we analyzed fat infiltration in lower leg muscles, tendon-to-tendon, with a 3D Dixon method. This revealed that fat infiltration starts with a distal “fat burst” in the first years of its initiation after which fat replacement further proceeds in a slower pace towards the proximal tendons. This indicates that the disease is triggered by an event typical for the distal parts of lower extremity muscles.
Purpose
Facioscapulohumeral muscular dystrophy (FSHD) is a major muscular dystrophy, in which the loss of suppression of the toxic protein DUX4 is the key genetic defect. Unfortunately, it is unknown what initiates the release of this suppression and how the disease then progresses. In FSHD a quasi-linear gradient of distal-to-proximal declining fat content has been discovered in muscles affected by the disease.1 This may indicate that disease initiation is located distally. However, it is not known if this gradient extends up to the tendons and how it advances through muscles towards their complete fatty replacement. Knowledge of this process is thus crucial to understand initiation and disease progress in FSHD.Aims:
1. To determine the tendon-to-tendon pattern of intramuscular fat infiltration in lower extremity muscles of FSHD patients.
2. To assess progression in fat infiltration of muscles in patients after ~4 yrs.
Methods
Subjects: We included 9 adult FSHD patients for a baseline MRI of which 7 underwent a follow-up examination on average 3¾ years later.MR data collection: MRI examinations of both the left and right lower extremity muscles of all patients were performed on a Siemens 3T MR system (TRIO or PRISMA Fit) using a spine/phased array coil combination. MR data was acquired with a 3D 2 point Dixon sequence (TR/TE1/TE2: 10/2.45/3.675 ms, FA: 3°, voxel size: 1x1x5 mm, slices: 32). In the longitudinal study care was taken for reproducible leg positioning.
Post-processing: From the 2pt-Dixon water and fat images we reconstructed fat fraction (FF) maps. For every leg, 12 upper and 10 lower leg muscles were manually segmented on every fifth slice and used to automatically segment the remaining slices.2 In this way, on average 44 slices were semi-automatically segmented per muscle. Subsequently, FF was calculated per slice for every muscle. Each muscle was then divided in five equally spaced proximo-distal segments to test if FF depended on its position along the proximo-distal axis using a linear mixed model. For the longitudinal assessment, we also determined the change in FF per slice and of the whole muscle.
Results
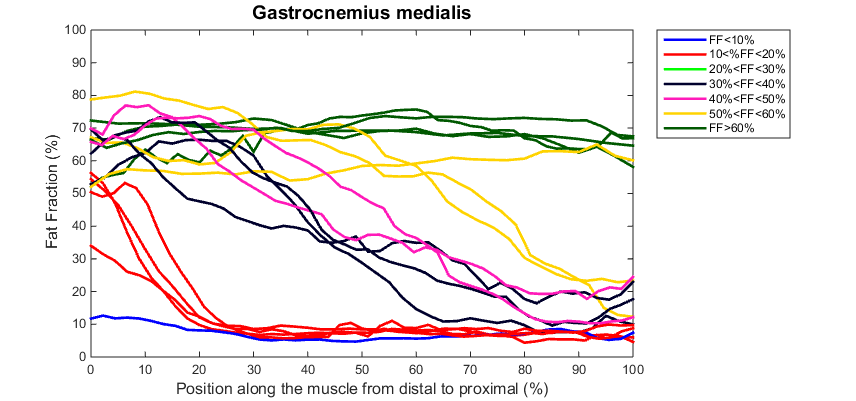
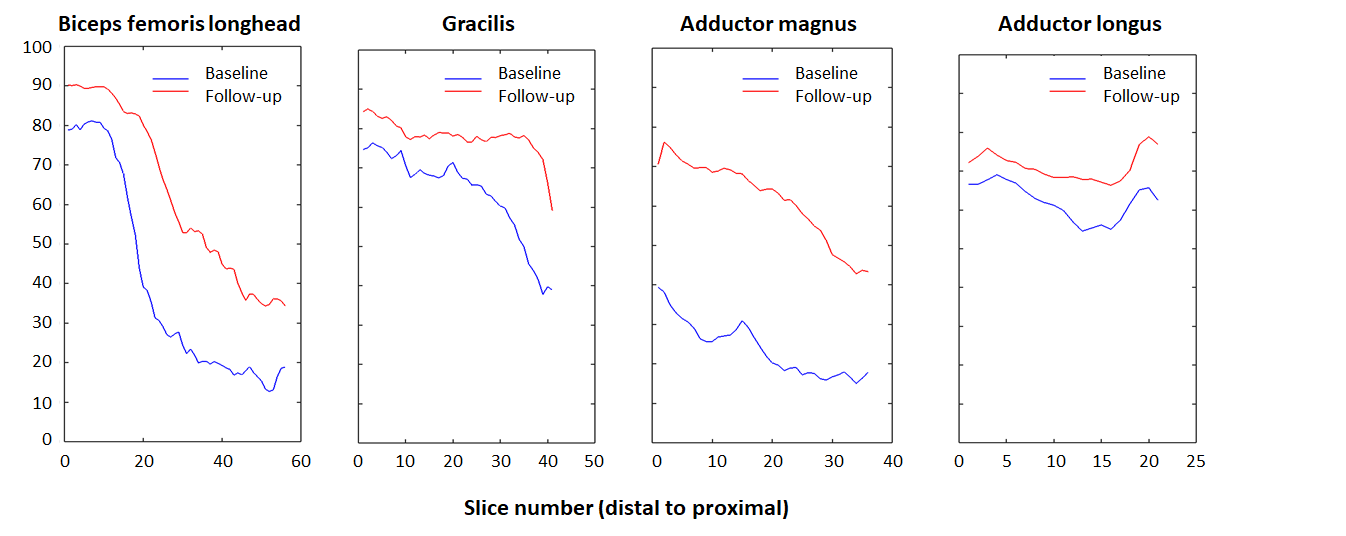
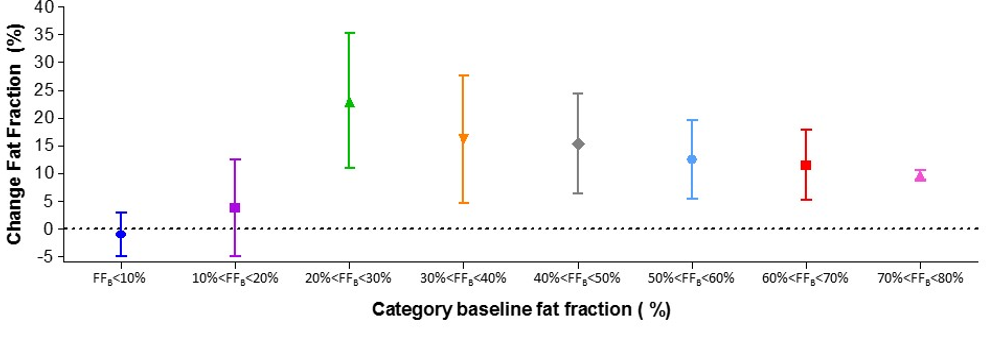
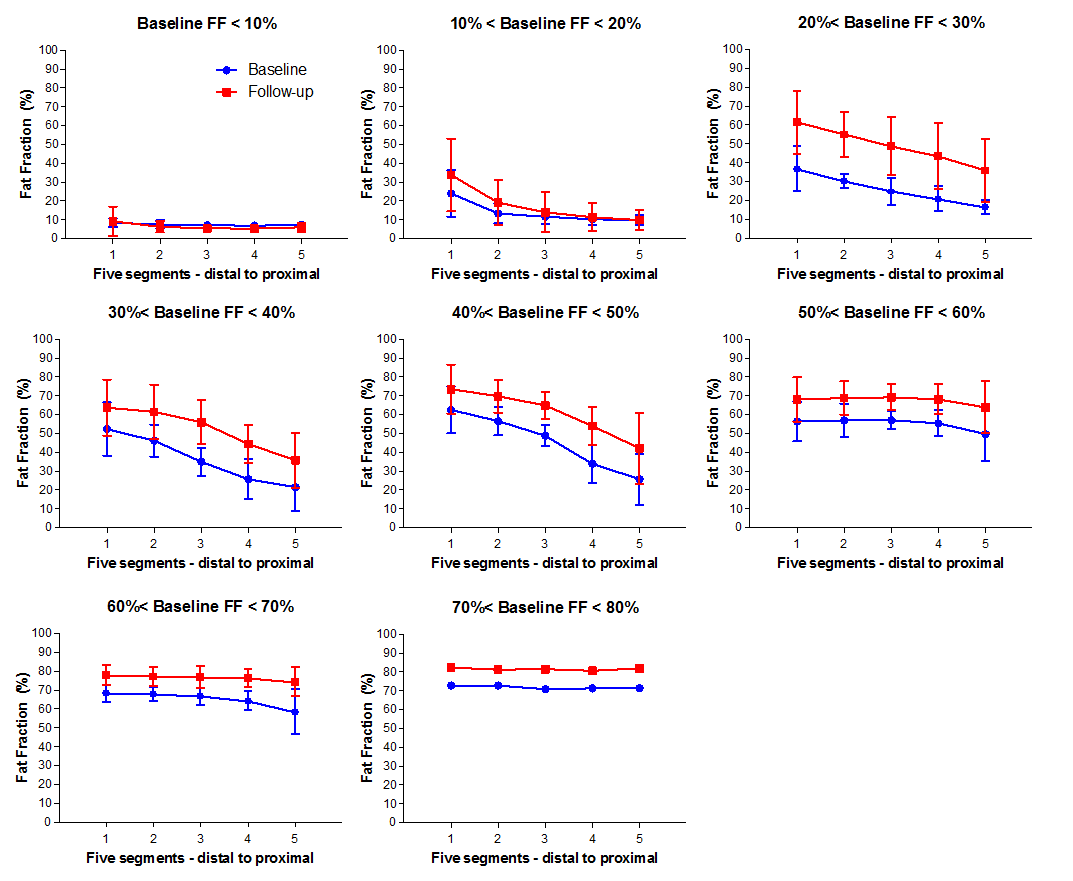
Baseline data: In total about 400 leg muscles were analyzed from tendon-to-tendon. A semi-qualitative evaluation of these muscles revealed that muscles either have on average a normal fat fraction (≤10%), an intermediate fat fraction with a distal-proximal declining fat gradient, or a high fat fraction (>50%) with no obvious fat gradient, as depicted for the gastrocnemius muscle in Figure 1. Muscles with an overall FF between 10% and 20% have a much higher relative FF (~40-50%) at the distal part of the muscles than seen for other muscles (compare red curves with other curves, Figure 1). This fat gradient with a higher FF distally also follows from a quantitative assessment of the 5 segments (Figure 2), FF depended on its location along the proximo-distal axis, with FF decreasing from distal to proximal (linear mixed model, p < 0.001). This effect was most prominent for the intermediately fat infiltrated muscles.Longitudinal data: Of the 7 patients undergoing the follow-up MRI scan, the first 4 patients have been analysed so far. In ~4 years, the fat gradients had moved in the proximal direction and muscles with an apparently homogeneous high FF still had increased their FF (see typical examples in Figure 3). The FF increase averaged over all muscles was 8%, however this average increase was much higher (up to 25%) for muscles with baseline FF of 20 – 30%. At higher baseline FF’s the change in FF steadily declined to about 10% at a baseline FF of 70-80% (Figure 4). An analysis per segment demonstrated similar results; i.e. segments in muscles with low baseline FF (10-20% and 20-30%), have the highest relative change in FF, in particular for the more distal parts of the muscle (Figure 5).
Conclusion and Discussion
In this study we confirmed that fat infiltration in the lower extremity muscles of FSHD patients occurs with a proximo-distal gradient, but in contrast to earlier studies1, we now demonstrate that this gradient extends all the way from tendon to tendon. Furthermore, we assessed both the upper and lower leg muscles, demonstrating that this proximo-distal gradient is also present for lower leg muscles. Together with the results of the longitudinal study this strongly indicates that disease triggering occurs in the muscle area close to the distal tendons and hence questions which potential triggers are typical for this area (e.g. more prone to hypoxia?).A previous estimate from average FF increases for intermediate infiltrated muscles suggested that complete fatty replacement of affected muscles occurs in ~3.5 year, after its initiation, assuming a constant FF increase.1 However, our current data indicate that fat infiltration starts with a distal “fat burst” within the first years of infiltration and then slows down. From the start of fat infiltration to completion would be more in the order of 8 years. Obviously, muscles, partly fat infiltrated at an earlier stage, are likely to have function loss already.
Acknowledgements
This work was supported by a grant from Friends of FSH research to LH and AH. We thank the research assistants of the department of Neurology for help in contacting the patients.References
1B. H. Janssen, N. B. M. Voet, C. I. Nabuurs, et al. Distinct Disease Phases in Muscles of Facioscapulohumeral Dystrophy Patients Identified by MR Detected Fat Infiltration. PLoS ONE 9(1): e85416. (2014)
2A. C. Ogier, L. Heskamp, A. Fouré, et al. A novel segmentation framework dedicated to the follow-up of fat infiltration in individual muscles of patients with neuromuscular disorders. Magnetic Resonance in Medicine (2020, In press)
Figures