1163
Quantitative 3D ultrashort echo time Cones magnetization transfer (3D UTE-Cones-MT) magnetic resonance imaging of knee cartilage degeneration1University of California, San Diego, San Diego, CA, United States, 2Radiology, Beijing Chao-Yang Hospital, Beijing, China, 3VA San Diego Healthcare System, San Diego, CA, United States
Synopsis
Quantitative MRI biomarkers, such as T2, T2*, and T1rho have been used to detect cartilage degeneration. However, these biomarkers are sensitive to the magic angle effect. Magnetization transfer (MT) modeling provides magic angle insensitive parameters such as macromolecular proton fraction (MMF). This study focuses on the clinical evaluation of cartilage degeneration using 3D ultrashort echo time cones MT (3D UTE-Cones-MT) modeling in osteoarthritis (OA) patients. Both MMF and MT ratio (MTR) show significant negative correlations with WORMS grading of knee cartilage. This study highlights the potential of 3D UTE-Cones-MT techniques for detection of early cartilage degeneration in OA.
Introduction
OA of the knee joint is one of the most common forms of arthritis. Various cartilage pathologies, such as the depletion of proteoglycan (PG) or degeneration of the collagen network, are directly associated with the onset and progression of knee OA [1]. Therefore, it is crucial for clinicians to detect structural and functional changes of the cartilage in the early stages of OA using a non-invasive and sensitive method. Many quantitative MRI techniques, such as T2, T2*, and T1rho have been used to detect the early degeneration of cartilage, but these parameters are sensitive to the magic angle effect, which may confound their use in clinical practice [2-3]. Magnetization transfer (MT) modeling provides biomarkers, such as macromolecular proton fraction (MMF) and exchange rates, which are magic angle insensitive [2] and have been shown to be associated with collagen degradation and PG depletion [4]. With recent innovations in MR technology, especially the 3D UTE-Cones sequence, the total scan time has been greatly decreased with more reliable biomarkers such as MMF and MT ratio (MTR) [5-6]. However, until now, clinical evaluation of the 3D UTE-Cones-MT technique on OA patients remains to be investigated. This study aimed to investigate the feasibility of using a two-pool model of 3D UTE-Cones-MT data for in vivo assessment of whole knee cartilage in healthy volunteers and OA patients, and to explore the relationship between 3D UTE-Cones-MT biomarkers and the clinical score of OA patients.Methods
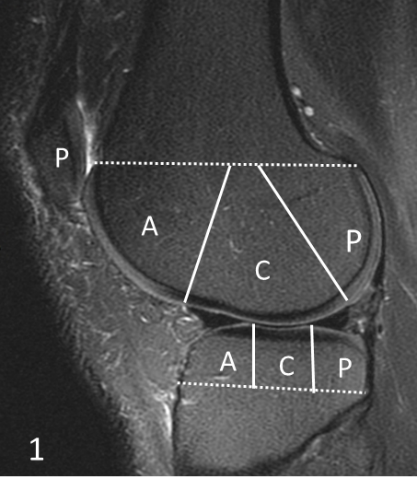
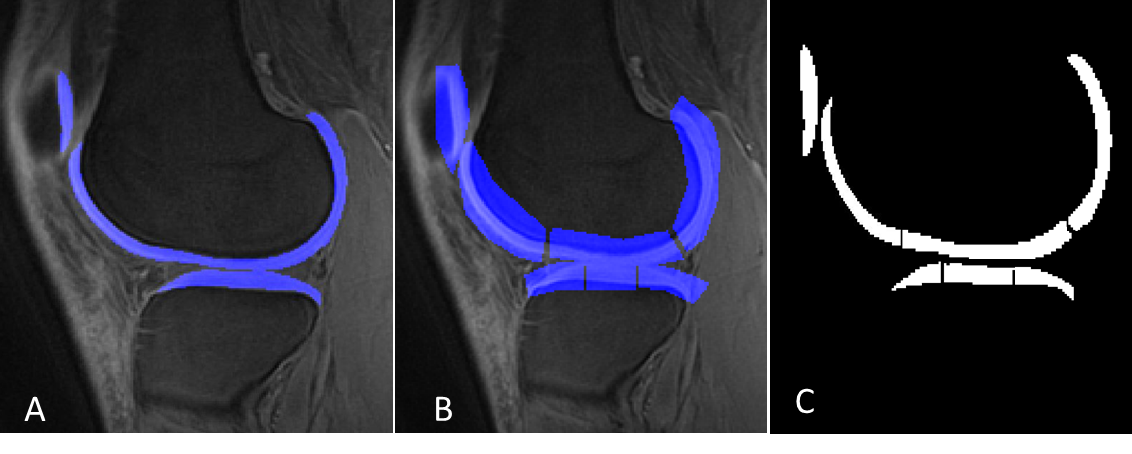
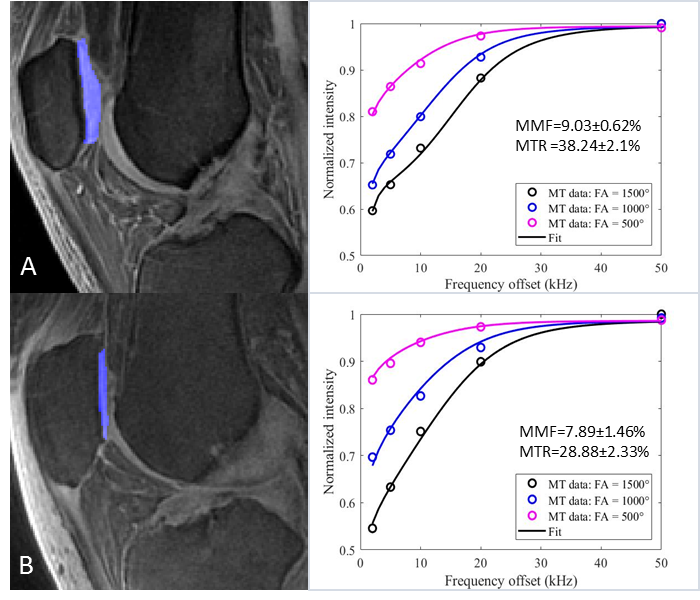
A total of 62 human subjects (aged 23-88 years; 55±17 years; 32 males, 30 females) was recruited for this study. Informed consent was obtained from all subjects in accordance with the guidelines of the Institutional Review Board. The whole knee joint (26 left knees, 36 right knees) was scanned using 3D UTE-Cones sequences on a 3T MR750 scanner (GE Healthcare Technologies, Milwaukee, WI). A series of 3D UTE-Cones-MT sequences (saturation pulse power = 500°, 1000°, 1500°; frequency offset = 2, 5, 10, 20, 50 kHz; flip angle = 7˚) was used to measure the MTR and the MMF. According to clinical exams and Kellgren–Lawrence (KL) scores [7], all subjects were classified into three groups: 18 normal controls (KL = 0), 27 patients with mild osteoarthritis (OA) (KL≤2), and 17 patients with severe OA (KL≥3); then, the whole knee articular cartilage was scored by two experienced musculoskeletal radiologists according to the Whole-Organ Magnetic Resonance Imaging Score (WORMS) [8] using the fat-suppressed T2-weighted FSE images. Furthermore, according to the extent and the depth of the cartilage lesions, all subjects were further subdivided into two groups: the extent groups (WORMS 0 = controls, WORMS 1, 2, 2.5 = regional lesions, WORMS 3, 4, 5 = diffuse lesions) and the depth groups (WORMS 0 = controls, WORMS 1, 2, 3, 4 = partial thickness lesions, WORMS 2.5, 5 = full-thickness lesions). The correlations between MT parameters and WORMS were calculated, and the difference of MT parameters among different KL scores and WORMS groups was evaluated and compared.Results and Discussion
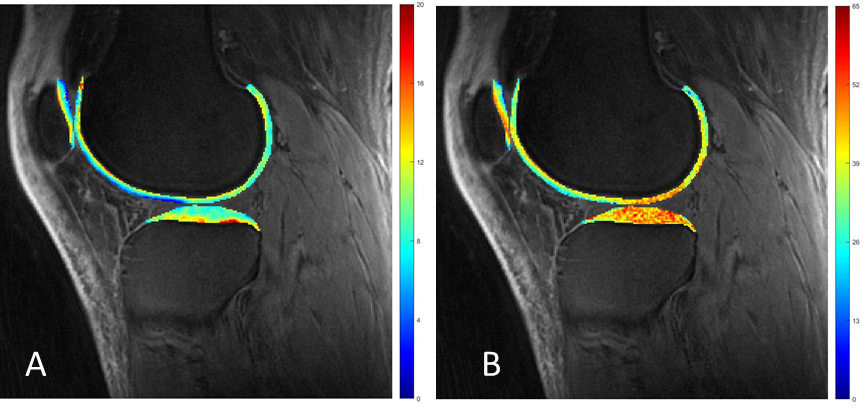
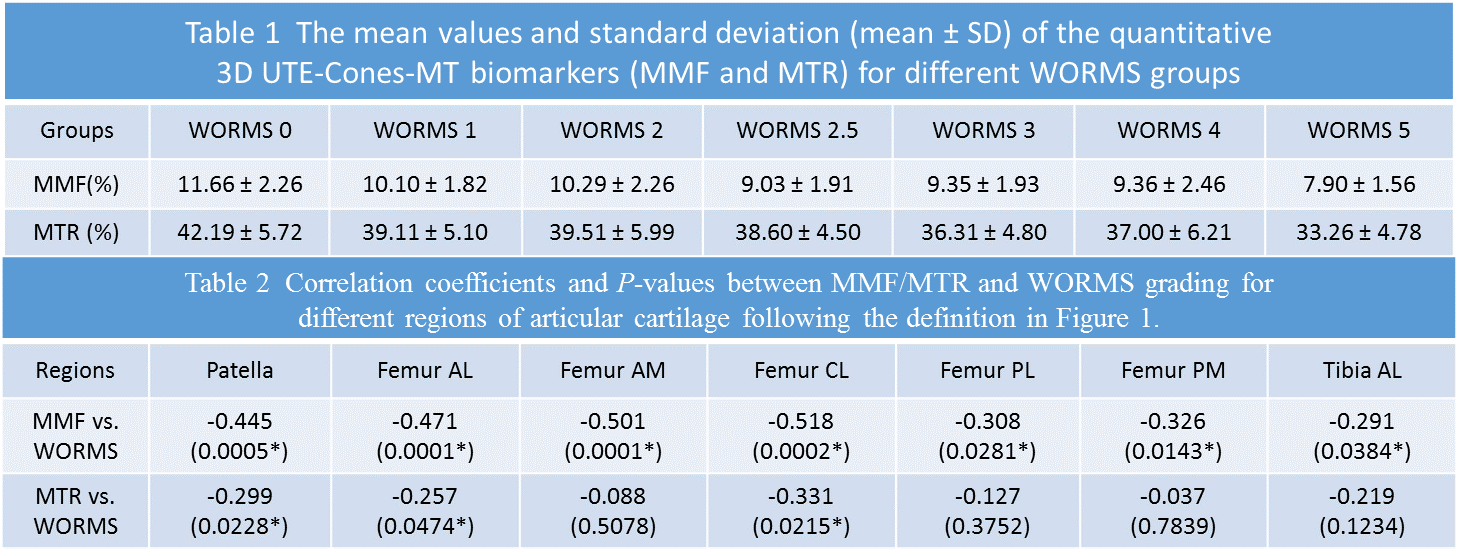
The Spearman’s rho correlation coefficient showed a moderate negative relationship between the MMF/MTR and the corresponding WORMS. MMF decreased from 11.85±1.93% to 10.69±2.10%, while MTR decreased from 42.28±6.01% to 40.05±5.79%, with the increase of KL scores from 0 to 3. There is a similar trend in MMF and MTR with the increase of WORMS (Table 1). The differences in MMF and MTR among different KL groups (i.e. controls vs. mild OA, controls vs. severe OA, and mild OA vs. severe OA) were all statistically significant (P<0.05). The differences for MMF and MTR among different WORMS groups (i.e. controls vs. regional lesions, controls vs. diffuse lesions, regional lesions vs. diffuse lesions; and controls vs. partial thickness lesions, controls vs. full-thickness lesions, partial thickness lesions vs. full-thickness lesions) were all statistically significant (P<0.05). Regional analyses show stronger correlations between 3D UTE-Cones-MT biomarkers and WORMS in patella and femoral condyles, but lower correlations in tibial plateau (Table 2).Conclusion
Both MMF and MTR obtained from the two-pool modeling of 3D UTE-Cones-MT data show negative correlations with WORMS grading of knee cartilage. There is a statistically significant difference among the different KL score groups and the different WORMS groups. Stronger correlations between 3D UTE-Cones-MT biomarkers and WORMS were observed in patella and femoral condyles, with lower correlations in tibial plateau. This study highlights the potential of 3D UTE-Cones-MT techniques for detection of early cartilage degeneration in OA.Acknowledgements
The authors acknowledge grant support from NIH(R01AR075825, 2R01AR062581, 1R01AR068987), and the VA Clinical Science and Rehabilitation R&DAwards(101RX002604).References
1. Hani AF, Kumar D, Malik AS, et al. Non-invasive and in vivo assessment of osteoarthritic articular cartilage: a review on MRI investigations. Rheumatol Int. 2015, 35(1):1-16.
2. Ma YJ, Shao H, Du J, Chang EY. Ultrashort echo time magnetization transfer (UTE-MT) imaging and modeling: magic angle independent biomarkers of tissue properties. NMR Biomed 2016, 29(11):1546–1552.
3. Mlynarik V, Szomolanyi P, Toffanin R, et al. Transverse relaxation mechanisms in articular cartilage. J Magn Reson. 2004, 169(2):300–307.
4. Li W, Hong L, Hu L, Maqin RL. Magnetization transfer imaging provides a quantitative measure of chondrogenic differentiation and tissue development. Tissue Eng Part C Methods. 2010, 16(6):1407–1415.
5. Ma YJ, Chang EY, Carl M, Du J. Quantitative magnetization transfer ultrashort echo time imaging using a time-efficient 3D multispoke Cones sequence. Magn Reson Med. 2018, 79(2):692-700.
6. Jerban S, Ma Y, Wan L, et al. Collagen proton fraction from ultrashort echo time magnetization transfer (UTE-MT) MRI modelling correlates significantly with cortical bone porosity measured with micro-computed tomography (μCT). NMR Biomed. 2019, 32(2):e4045.
7. Kellgren JH, Lawrence JS. Radiological assessment of osteo-arthrosis. Ann Rheum Dis. 1957, 16(4):494-502.
8. Peterfy CG, Guermazi A, Zaim S, et al. Whole-Organ Magnetic Resonance Imaging Score (WORMS) of the knee in osteoarthritis. Osteoarthritis Cartilage. 2004, 12(3):177-190.
Figures