1162
Osteochondral Junction (OCJ) Imaging Using a Fast T1-weighted 3D Ultrashort Echo Time Cones Sequence at 3T1Radiology, Fuwai Hospital Chinese Academy of Medical Sciences, Shenzhen, shenzhen, China, 2Radiology, University of California San Diego, San Diego, CA, United States, 3VA San Diego Healthcare System, San Diego, CA, United States
Synopsis
The osteochondral junction (OCJ) is the region where calcified cartilage meets subchondral bone (SCB), and is likely to be highly related to osteoarthritis (OA). However, it is difficult to image OCJ tissues due to their relatively short transverse relaxation times, which cause little or no signal to appear with conventional imaging sequences. In this study, we developed a 3D T1-weighed fast ultrashort echo time cones sequence with fat saturation (FS-UTE-Cones) to generate a high OCJ contrast image of the human knee on a clinical 3T MRI scanner.
Introduction
Several studies have shown that the region of the osteochondral junction (OCJ), which encompasses the tissues between the uncalcified layers of cartilage and the marrow spaces of the trabecular bone, is highly related to osteoarthritis (OA) (1-4). However, magnetic resonance imaging (MRI) of the OCJ region is difficult due to the tissues’ short transverse relaxation times (i.e. short T2), which result in little or no signal with conventional sequences. Ultrashort echo time (UTE) sequences have been employed to overcome this limitation (5-11). However, most techniques are based on 2D UTE sequences, which are unable to cover the whole knee joint due to strong out-of-slice signal excitation, especially for off-center slices (12). In this study, we developed a fast 3D T1-weighed UTE Cones sequence with fat saturation (FS-UTE-Cones) to highlight OCJ tissues in human knee on a clinical 3T MRI scanner. This study examined an ex vivo patellar cartilage sample, cadaveric whole knee joint, and an in vivo knee joint.Methods
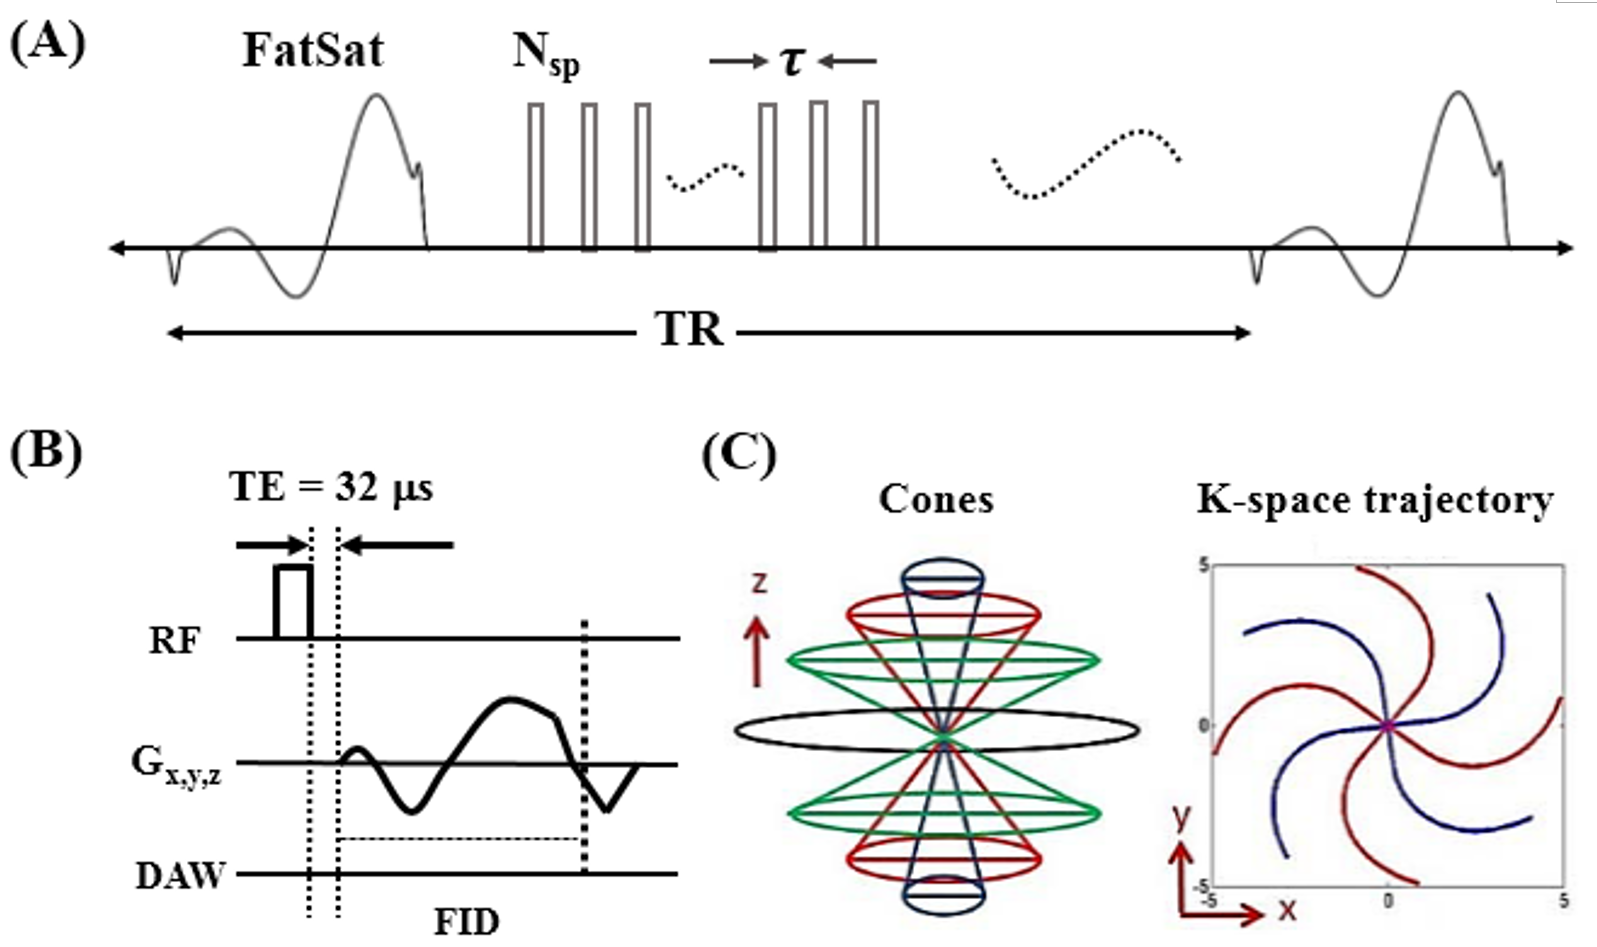
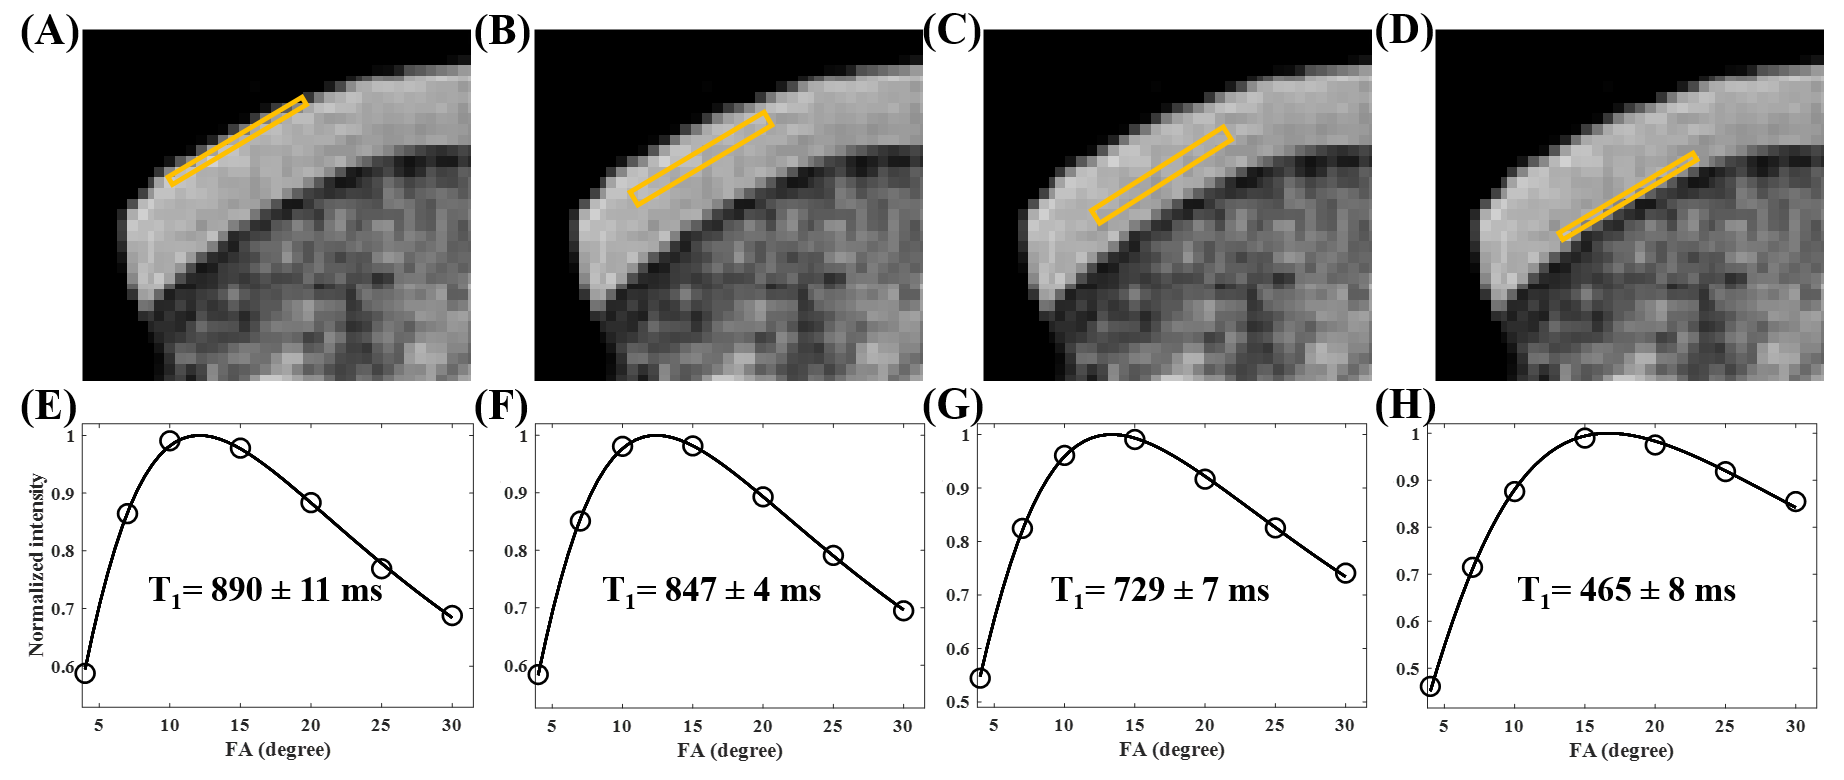
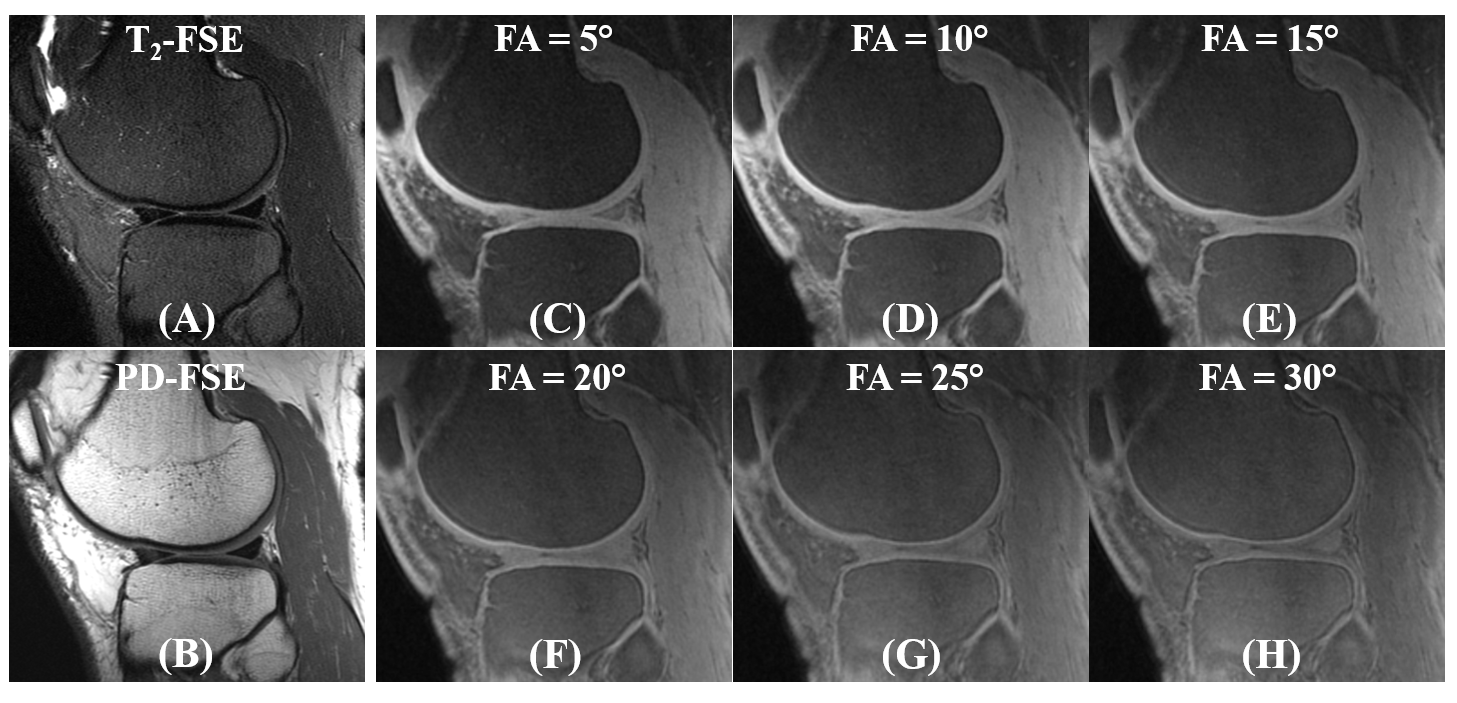
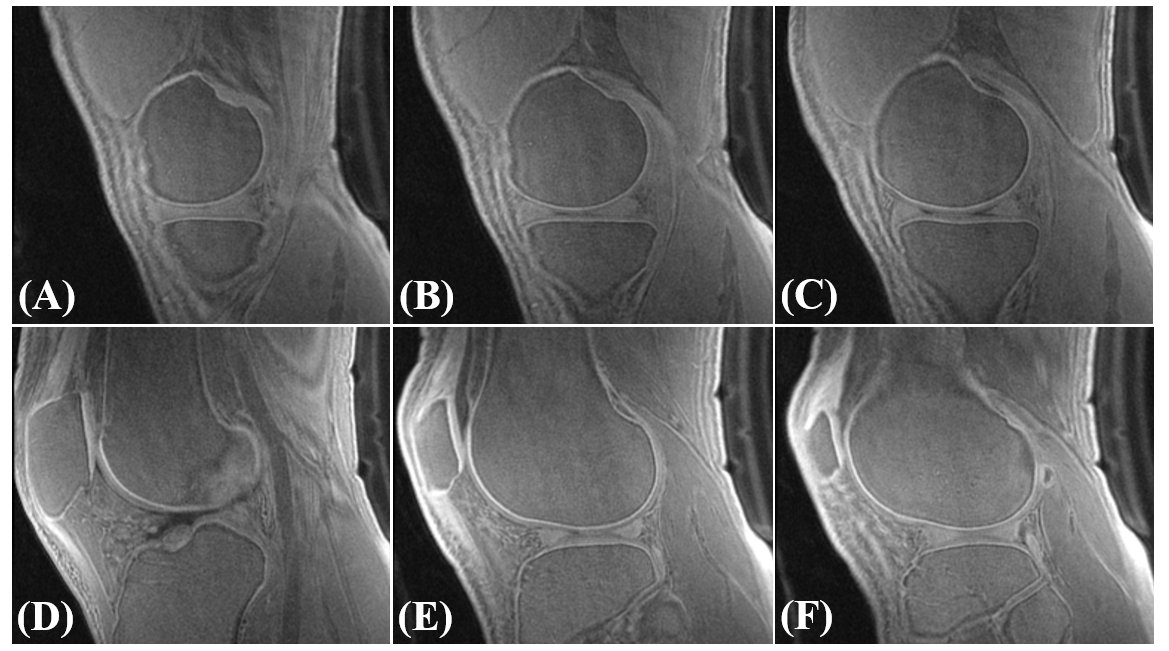
The features of 3D FS-UTE-Cones sequence can be found in Figure 1 (13). A product FatSat module was used to suppress fat. To improve the acquisition efficiency, a series of spokes (Nsp) was acquired after each FatSat pulse (Figure 1A). For each spoke, a short rectangular pulse (e.g., 100µs) was used for non-selective signal excitation (Figure 1B), followed by a Cones data acquisition (Figure 1C). To investigate the T1 values for the different layers of cartilage (i.e. superficial, middle, deep, and calcified layers), a patellar cartilage sample was scanned in a homemade birdcage coil with a 3D UTE-Cones actual flip angle imaging and variable flip angle (3D UTE-Cones AFI-VFA) sequence (14): 1) UTE-Cones AFI: TR=20/100ms, flip angle=45°; 2) UTE-Cones VFA: TR=20ms; flip angle=4°, 7°, 10°, 15°, 20°, 25° and 30°. Other sequence parameters were: FOV=7×7×6.4cm3, acquisition matrix=192×192×64, TE=0.032 ms, receiver bandwidth=100 kHz, and a total scan time of 45.5 min. In vivo knee imaging was performed on five healthy volunteers (29-45 years of age, 3 males and 2 females) and five patients with OA (48-70 years of age, 4 males and 1female). Informed consent was obtained from all subjects in accordance with guidelines of the institutional review board. A healthy knee joint from a 36-year-old volunteer was scanned with the FS-UTE-Cones sequence with different flip angles (i.e. flip angle=5°, 10°, 15°, 20°, 25°, and 30°) to investigate the contrast change of the OCJ tissues. A transmit and receive knee coil was used for RF excitation and signal reception. Other sequence parameters were: FOV=13×13×8.4cm3, acquisition matrix=256×256×42, TR/TE=80/0.032 ms, Nsp=5, τ=6ms, receiver bandwidth=166 kHz, and a total scan time of 3 min. The clinical T2- and PD-weighted sequences were used for comparison. Then, a high contrast image of the OCJ was obtained by scanning a healthy knee joint from a 37-year-old volunteer with the optimized T1-weighted FS-UTE-Cones sequence (flip angle=30°). Six abnormal cadaveric whole knee joints and five OA patients were also scanned with the T1-weighted FS-UTE-Cones sequence and compared with the clinical T2-weighted sequence.Results and Discussion
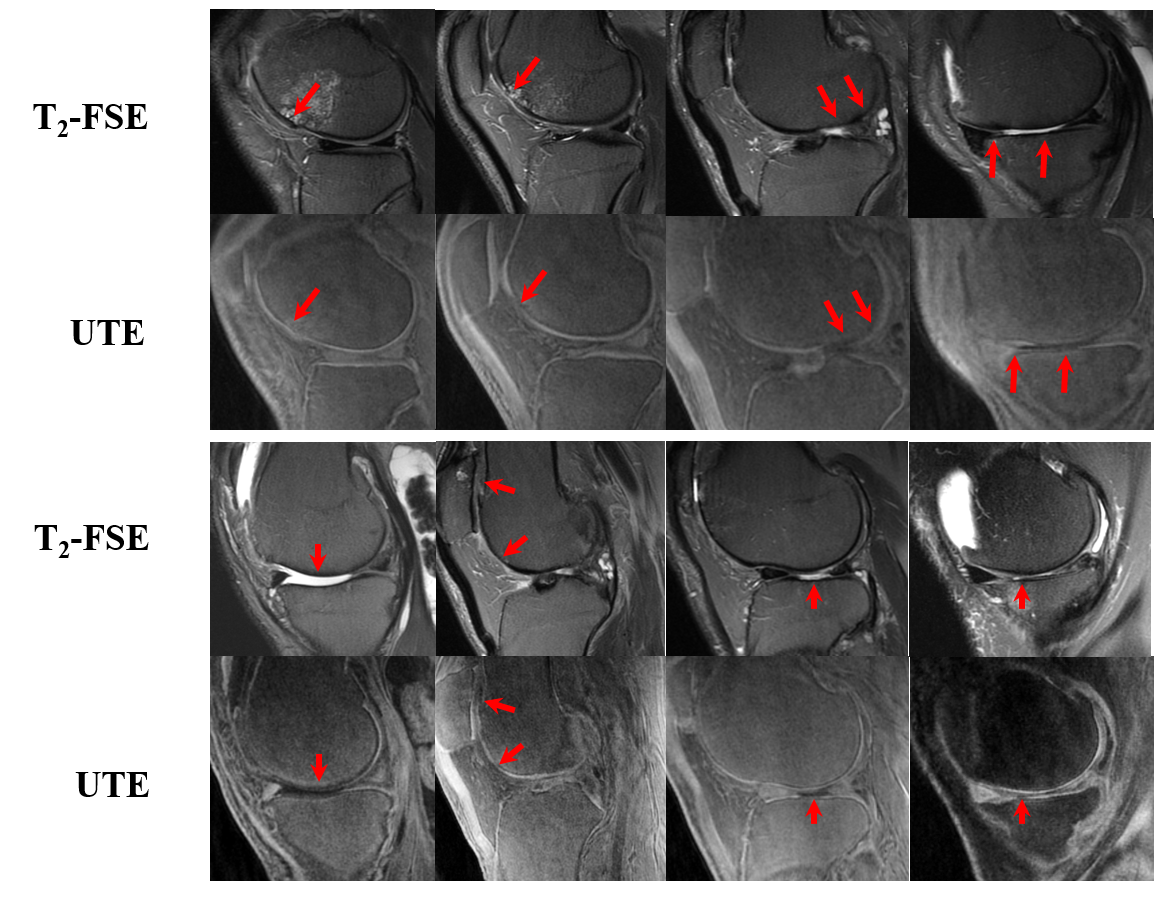
Figure 2 shows a 3D FS-UTE-Cones image of the patellar cartilage sample and corresponding fitting curves and T1 values of different regions of cartilage. The T1 values of uncalcified cartilage decrease from the superficial layer (890±11 ms) to the middle layer (847±4 ms), then the deep layer (729±7 ms). The calcified cartilage has a much lower T1 of 465±8 ms. The significantly lower T1 values of the calcified cartilage make it possible to highlight the OCJ region with a highly T1-weighted UTE sequence. The OCJ tissues appear dark in the clinical T2- and PD-FSE images (Figure 3A and 3B) due to the short T2 relaxation. However, the signals in the OCJ region can be detected with the PD-weighted FS-UTE-Cones sequence with low flip angles (Figure 3C and 3D), but without OCJ contrast. In comparison, the OCJ region was highlighted with the T1-weighed FS-UTE-Cones sequence with high flip angles (e.g. 25° and 30°) as a bright band. Figure 4 demonstrated a high OCJ contrast in whole knee joint imaging with the proposed T1-weighted FS-UTE-Cones sequence. Continuous bright bands can be found in the OCJ region of patellar, femoral, and tibial cartilage. Both the abnormal knee joint specimen and knee joints of the OA patients show morphological changes in the OCJ region (Figure 5), including regions with ill-defined or focal absence of bright band adjacent and parallel to the SCB (arrows).Conclusion
The proposed 3D T1-weighted FS-UTE-Cones sequence is a novel imaging method that can highlight the OCJ region of human knee joint. This fast technique could be used to detect signal changes in OCJ tissues which may be related to OA.Acknowledgements
The authors acknowledge grant support from NIH (R01AR075825, 2R01AR062581, 1R01 AR068987), and the VA Clinical Science and Rehabilitation R&DAwards (I01RX002604)References
1. Mapp PI, Walsh DA. Mechanisms and targets of angiogenesis and nerve growth in osteoarthritis. Nat Rev Rheumatol. 2012;8(7):390-8.
2. Walsh DA, McWilliams DF, Turley MJ, et al. Angiogenesis and nerve growth factor at the osteochondral junction in rheumatoid arthritis and osteoarthritis. Rheumatology. 2010;49(10):1852-61. 3. Suri S, Gill SE, Massena de Camin S, Wilson D, McWilliams DF, Walsh DA. Neurovascular invasion at the osteochondral junction and in osteophytes in osteoarthritis. Ann Rheum Dis. 2007;66(11):1423-8. 4. Findlay DM, Atkins GJ. Osteoblast-chondrocyte interactions in osteoarthritis. Curr Osteoporos Rep. 2014;12(1):127-34.
5. Won C.Bae, Reni Biswas, Karen Chen, Eric Y.Chang, Christine B. Chung. UTE MRI of the Osteochondral Junction Curr Radiol Rep. 2014 February 1; 2(2): 35–. doi:10.1007/s40134-013-0035-7. 6. Chang EY, Du J, Chung CB. UTE imaging in the musculoskeletal system. J Magn Reson Imaging. 2015;41(4):870-83.
7. Bae WC, Dwek JR, Znamirowski R, et al. Ultrashort echo time MR imaging of osteochondral junction of the knee at 3 T: identification of anatomic structures contributing to signal intensity. Radiology. 2010;254(3):837-45.
8. Du J, Takahashi A, Bae WC, Chung CB, Bydder GM. Dual inversion recovery ultrashort echo time imaging: Creating high contrast for short T2 species. Magn Reson Med 2010; 63:447-455.
9. Du J, Carl M, Bae WC, Statum S, Chang EY, Bydder GM, Chung CB. Dual inversion recovery ultrashort echo time (DIR-UTE) imaging and quantification of the zone of calcified cartilage. Osteoarthritis Cartilage 2013; 21:77-85.
10. Mackay JW, Low SB, Houston GC, Toms AP. Ultrashort TE evaluation of the osteochondral junction in vivo: a feasibility study. Br J Radiol. 2016;89(1059):20150493.
11. Ma Y‐J, Jerban S, Carl M, et al. Imaging of the region of the osteochondral junction (OCJ) using a 3D adiabatic inversion recovery prepared ultrashort echo time cones (3D IR‐UTE‐cones) sequence at 3 T. NMR in Biomedicine. 2019;32:e4080.
12. Lu A, Daniel BL, Pauly JM, Pauly KB. Improved slice selection for R2* mapping during cryoablation with eddy current compensation. J Magn Reson Imaging 2008; 28:190-198.
13. Carl M, Bydder GM, Du J. UTE imaging with simultaneous water and fat signal suppression using a time-efficient multi-spoke inversion recovery pulse sequence. Magn Reson Med 2016; 76:577-582.
14. Ma YJ, Zhao W, Wan L, Guo T, Searleman A, Jang H, Chang EY, Du J. Whole knee joint T1 values measured in vivo at 3T by combined 3D ultrashort echo time cones actual flip angle and variable flip angle methods. Magn Reson Med 2019;81 (3), 1634-1644.
Figures