1161
A new Trabecular BV/TV Estimation Method using Single-Sided NMR Devices through the Separation between Intra- and Inter-trabecular 1H Signals1Physics and Astronomy, University of Bologna, Bologna, Italy, 2IRCCS Istituto Ortopedico Rizzoli, Bologna, Italy
Synopsis
Methods to improve the early detection of diseases associated with an increased bone fragility are objects of investigation. Single-sided NMR is an appealing approach for medical applications. In this work we propose a new methodology to assess the bone volume fraction (BV/TV) of trabecular bone (TB), without the need of using a reference sample, exploiting the separation between intra- and inter-trabecular 1H signals from quasi-continuous T2 distributions. BV/TV of TB samples estimated using NMR were found in strong agreement with micro-CT estimations. This is promising for the application of single-sided NMR scanners to in-vivo assessing of bone micro-structure.
Introduction
Diseases associated with an increase of bone fragility and susceptibility to fractures, like osteoporosis, are a major public health concern, with a high impact on the quality of human health1-3, and on the associated costs for medical care. Methods to improve the early detection of these diseases are objects of investigation. Wide campaigns of screening of the population at risk are desirable to study diseases evolution and, ideally, to prevent the worsening of the bone conditions. Portable NMR, based on low-field single-sided NMR scanners, is a promising and appealing approach, due to its associated low costs and easy protocols to assess MR properties of biological tissues with the aim of medical applications4-10. Recently we proposed a method to assess the bone volume fraction (BV/TV), also called bone-volume-to-total-volume ratio, an important parameter to evaluate the micro-structure of the trabecular bone (TB), through single-sided NMR scanners11. The procedure exploited the ratio between the signals obtained from the TB and the signal obtained from a reference sample of bulk marrow. The goal of this work is to improve the previous methodology by proposing a new procedure, to be able to assess BV/TV of trabecular bones without the need of using a reference sample.Theory
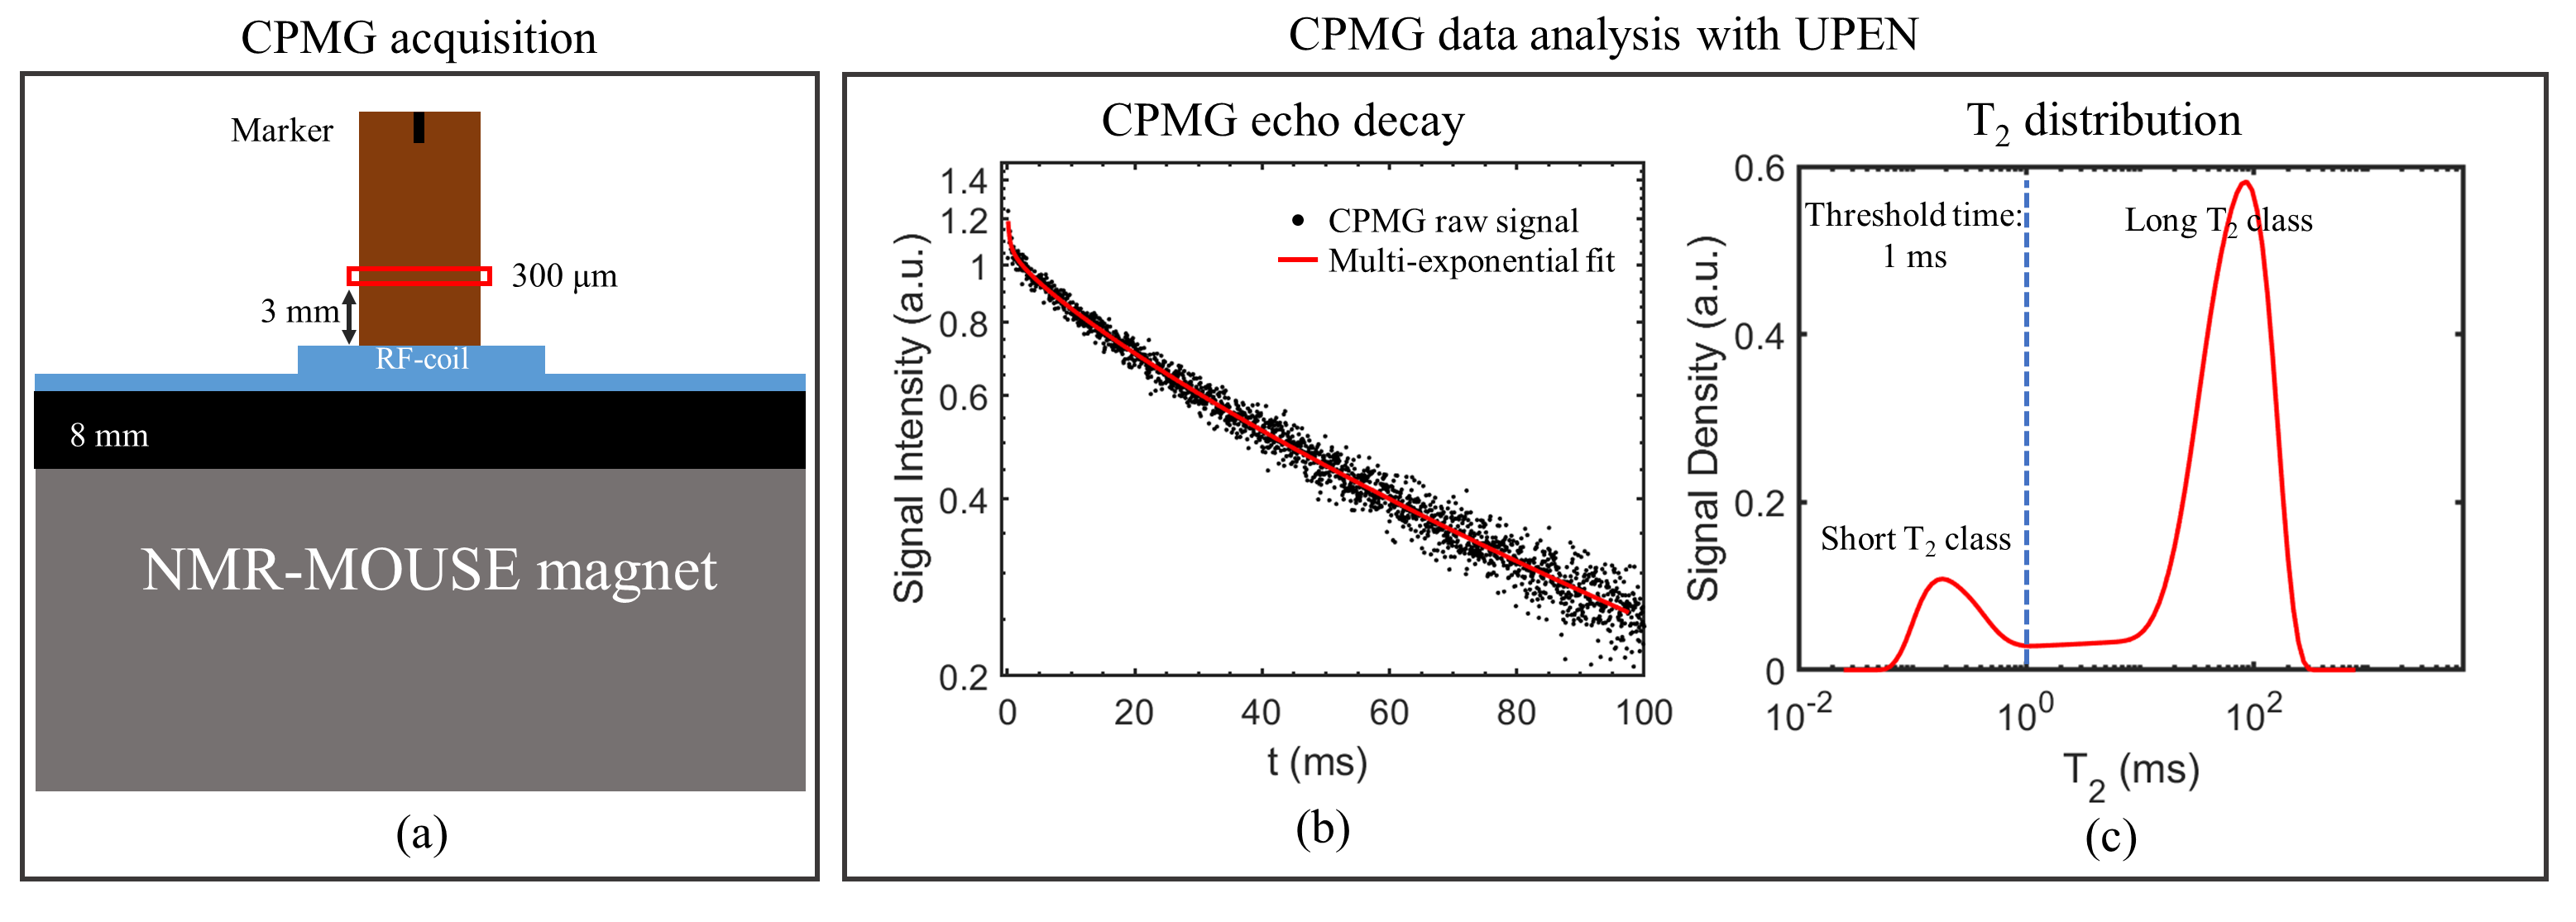
The idea behind the new methodology is to take advantage of the fact that NMR signals coming from 1H nuclei of fluids are expected to be approximately proportional to the corresponding volumes, and that the T2 relaxation times of 1H within the trabeculae have been reported to be shorter than those of fluids in the inter-trabecular spaces12,13. From the separation between short and long T2 values, Eq. 1 can be used to compute the T2-short-intensity-fraction,$$ \text{$T_2$-short-intensity-fraction} = \frac{S_{\text{short $T_2$}}}{S_{\text{total}}} \quad (\%) \quad$$
where Sshort T2 and Slong T2 are the signals associated to the intra- and inter-trabecular volumes, respectively. This fraction is expected to be related to BV/TV.
To evaluate the BV/TV an esteem of the trabecular volume is needed. This is possible by considering that the trabecular volume is given by the intra-trabecular volume divided by the porosity that characterizes the trabeculae ( ∅trabecula).
Methods
Ten cylindrical TB samples, of approximate diameter 1 cm and height 1.5 cm, where cored from different sites of pig shoulders.Figure 1 summarizes the NMR measurement pipeline. CPMG pulse sequence was used to acquire the NMR signal using the NMR-MOUSE PM10 scanner (Magritek, New Zealand). The quasi-continuous T2 distributions were obtained using the software UPENWin14,15. Based on the literature12,16,17 a threshold time of 1 ms was used to separate long and short T2 classes and to estimate Sshort T2 and Slong T2, and consequently the T2-short-intensity-fraction. BV/TV was then evaluated and, to avoid the use of a reference sample, the mean ∅trabecula value reported in Ref.13 was used. Then we evaluated ∅trabecula with the methodology introduced by Fantazzini et al13 for our TB samples. The t-test was performed to assess whether the ∅trabecula values for the TB samples found in this study were consistent with those found in Ref.13.
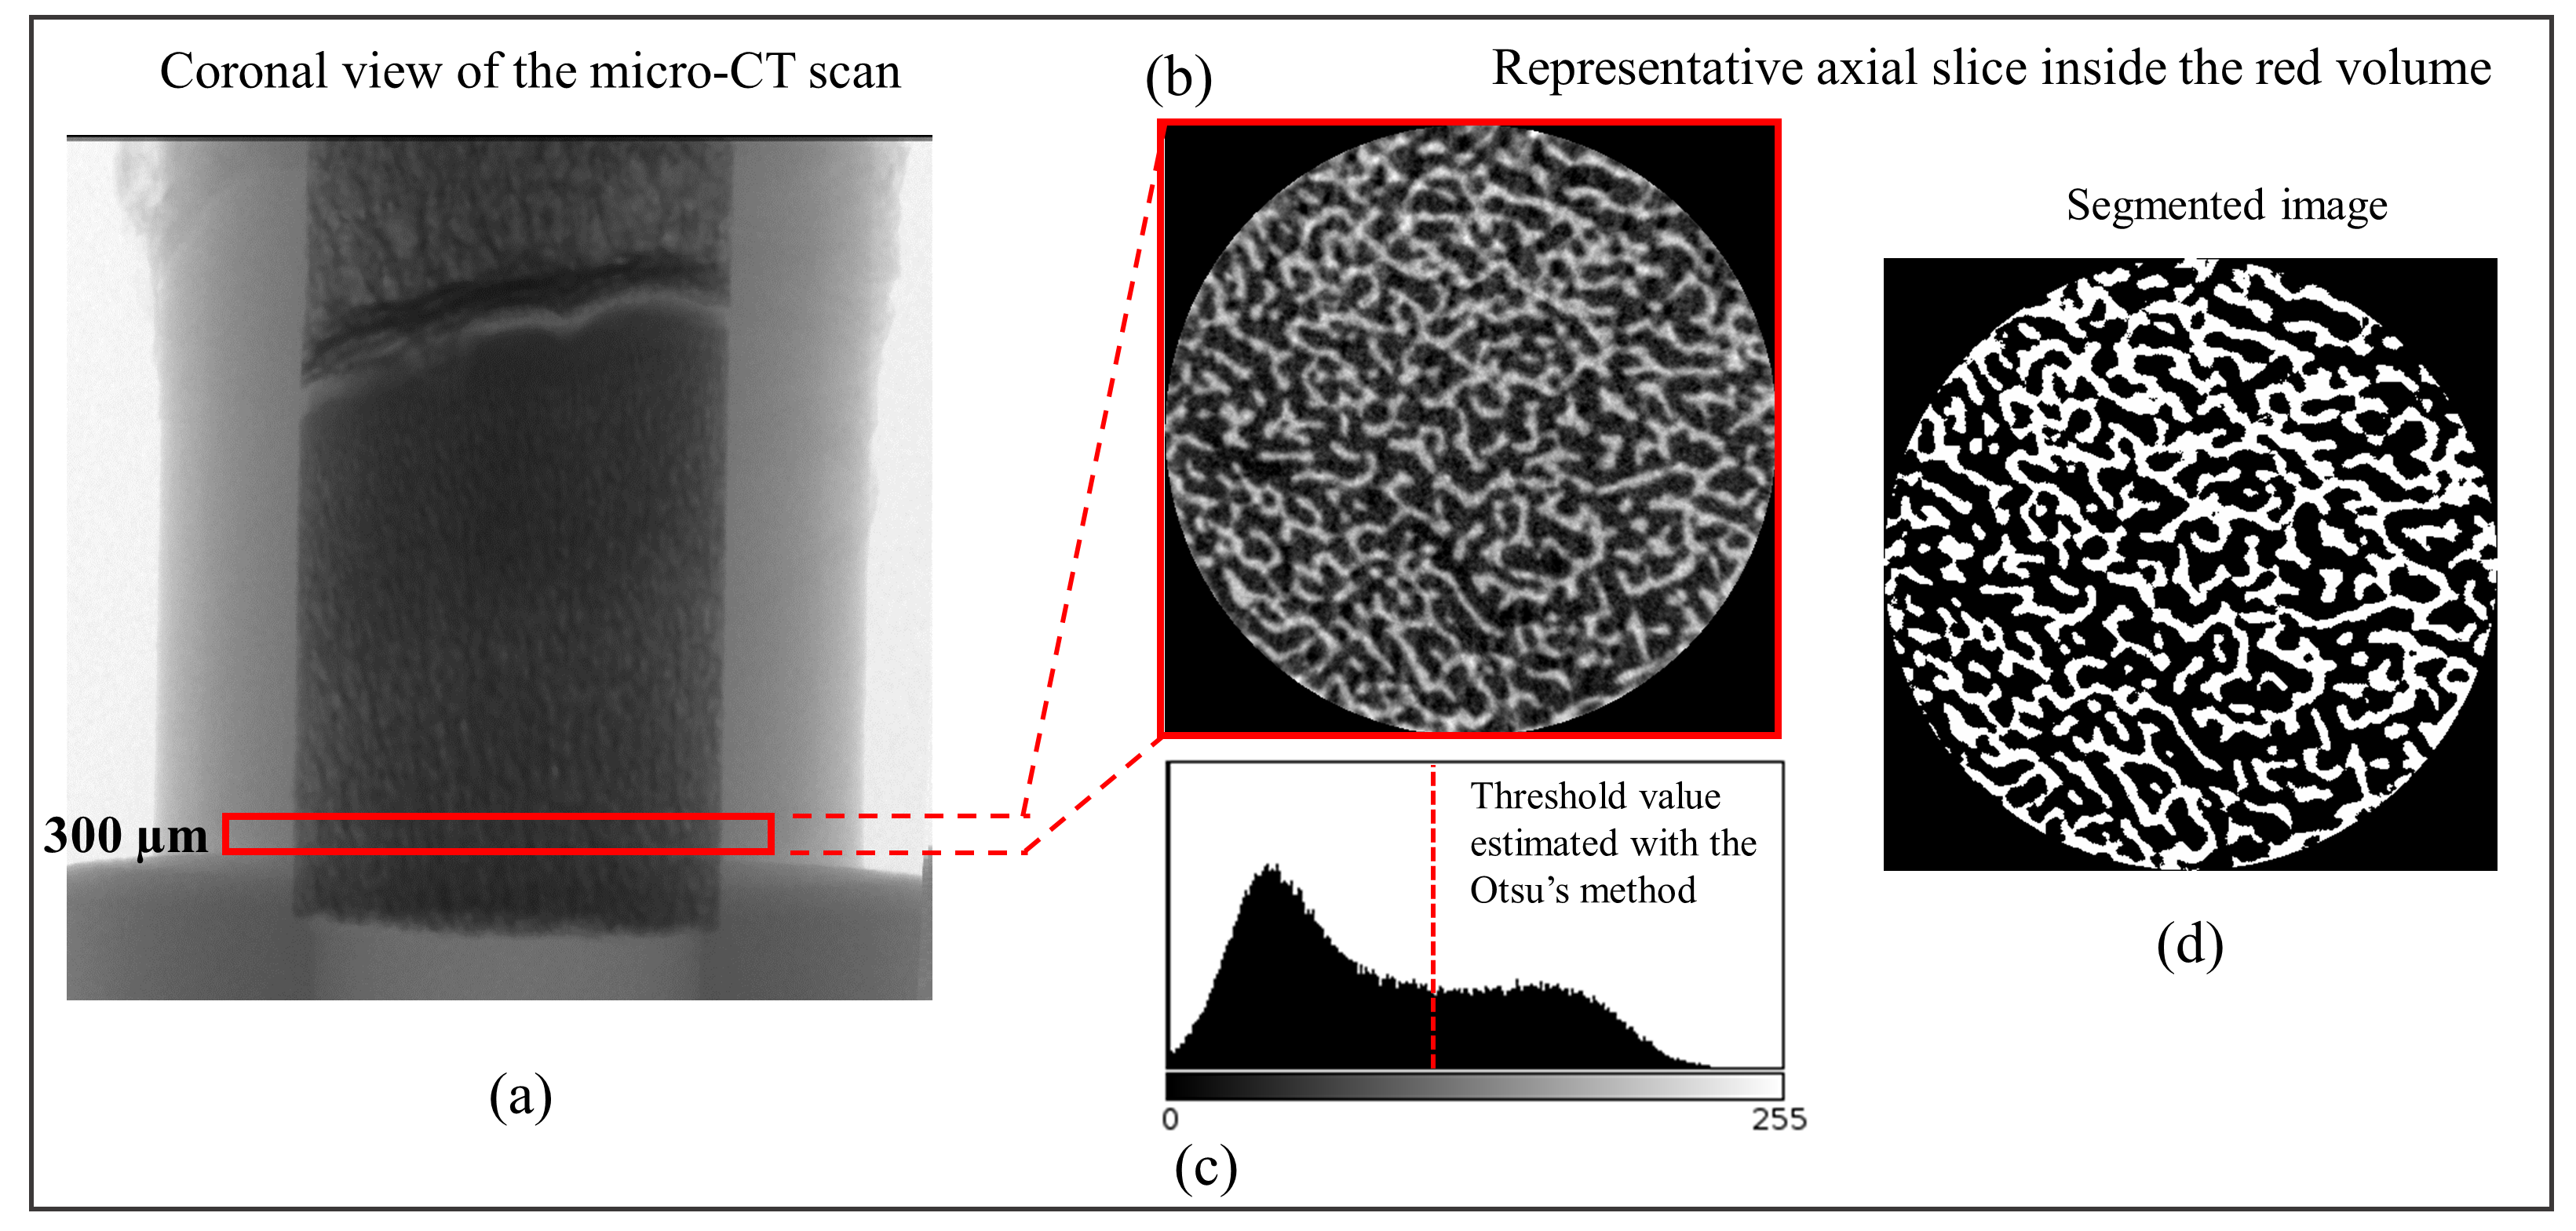
Micro computed tomography (micro-CT) was used to evaluate the ground truth BV/TV ratios. Correlation with T2-short-intensity-fraction was assessed using the Pearson’s coefficient, r. Figure 2 summarizes the acquisition and analysis pipeline.
The comparison between NMR and micro-CT computed BV/TV ratios was performed based on a linear fit and the Lin’s correlation coefficient, rc.
Results
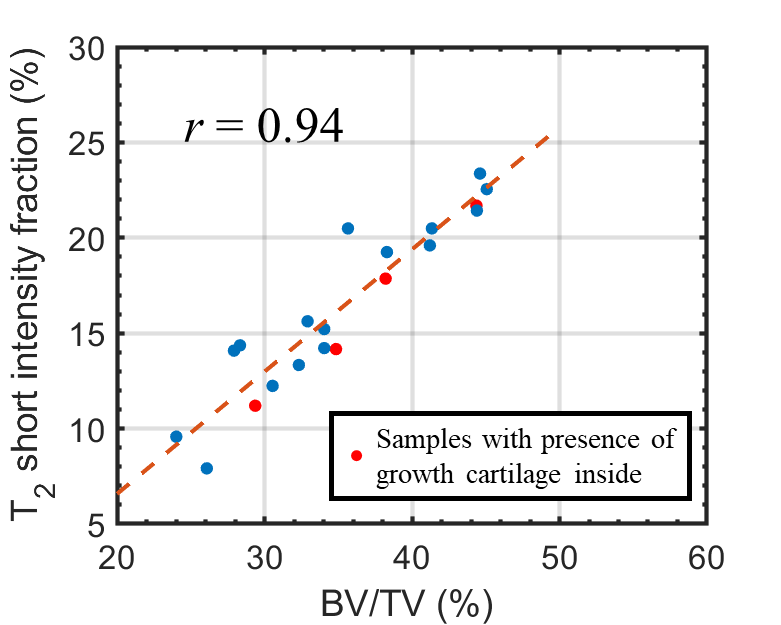
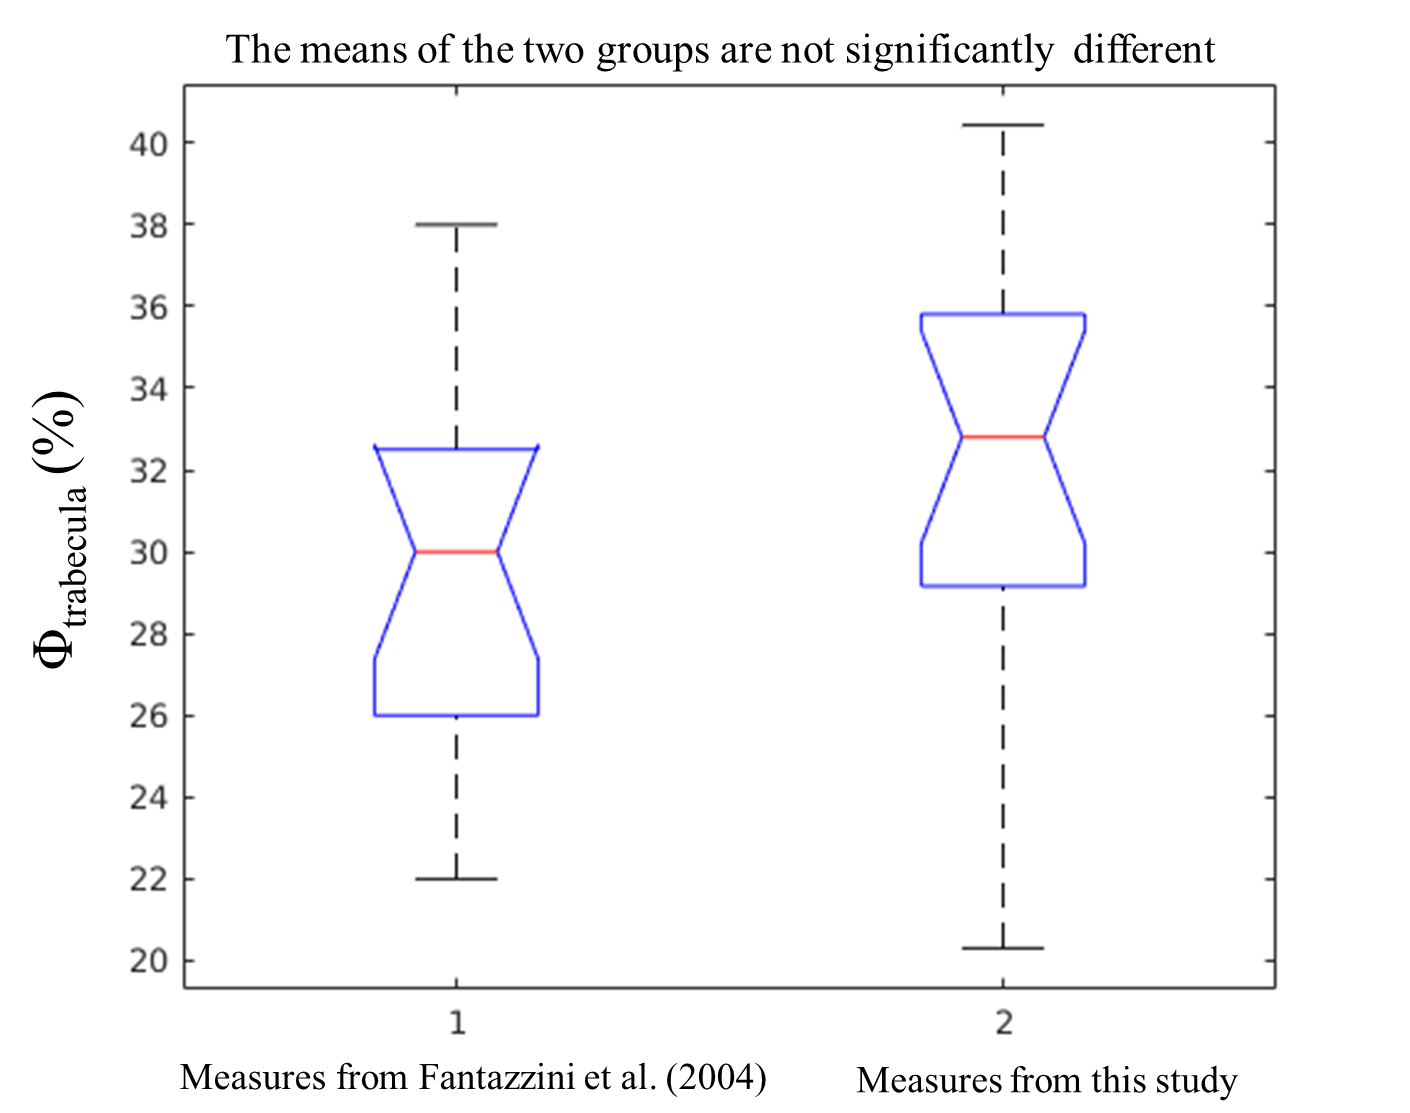
Figure 3 reports the T2-short-intensity-fraction as a function of the micro-CT computed BV/TV for all the TB samples. T2-short-intensity-fraction resulted to be strongly correlated with BV/TV (r = 0.94).Figure 4 reports the comparison between the distribution of the ∅trabecula values evaluated in this study and those reported in Fantazzini et al13. Based on a t-test the two means were not significantly different (p =0.12).
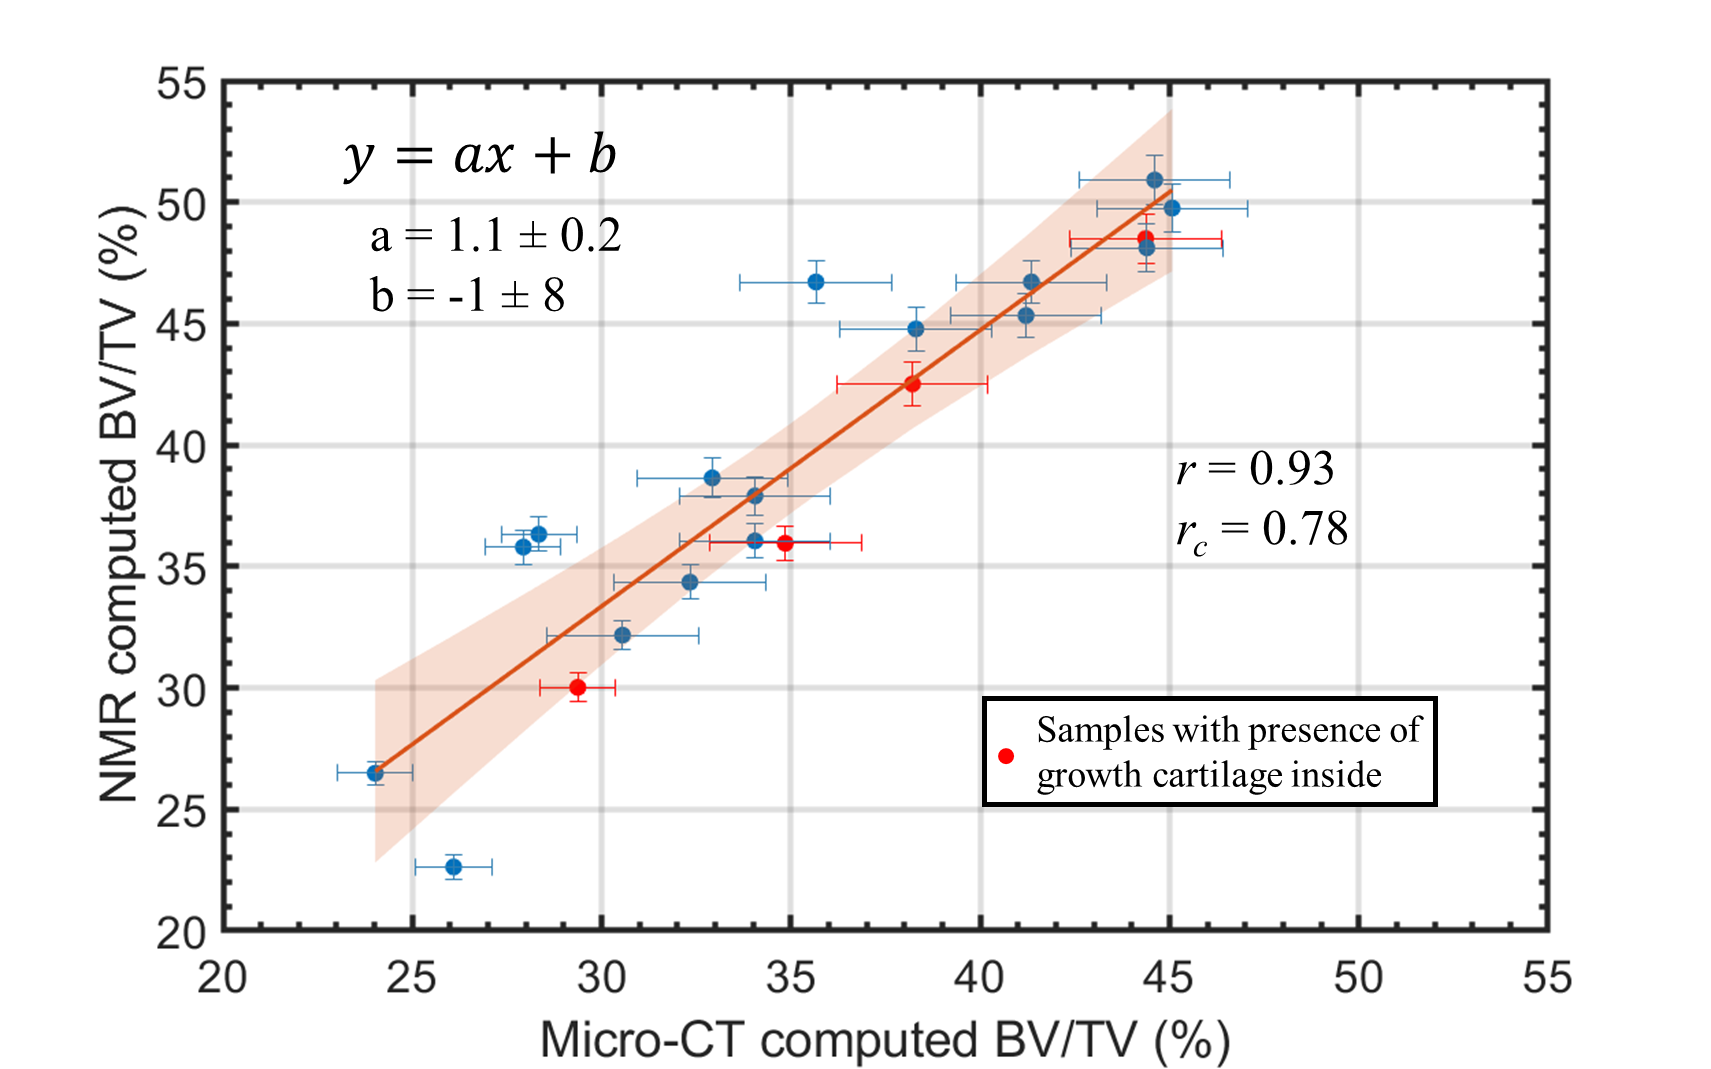
Figure 5 reports the comparison between the NMR and micro-CT computed BV/TV ratios. Strong correlation and agreement between NMR and micro-CT were obtained (r =0.93 and rc =0.78). The linear fit reports a slope of 1.1 ± 0.2, and a bias term of (-1 ± 8) percentage units.
Discussion
The BV/TVs estimated using a single-sided NMR scanner, without the need of a reference sample, strongly agree with the values obtained using the gold standard micro-CT analysis. The new methodology does not use a reference sample, which makes it more versatile and suitable for in-vivo applications than the method proposed in Ref.11.Intra-trabecular porosity values found in this work were significantly consistent with values found in Ref.13. Therefore, we are confident in using a of ~ 30 % for BV/TV estimation even for new TB samples. However, this confidence holds for healthy TB samples. Literature has not clearly established at what extent diseases affecting the bone tissue, such as osteoporosis, modifies the structure (in particular the porosity) at the trabecular level.
Conclusion
A substantial improvment of the methodology introduced by Brizi et al11 was proposed. The results validated the new methodology, which does not need a reference sample to estimate BV/TV of TB samples. This is a step forward the application of single-sided NMR scanners for in-vivo assessing of bone micro-structure, which could be used for widespread screening campaigns of the population at risk of bone related diseases, such as osteoporosis.Acknowledgements
No acknowledgement found.References
[1] L. V. Avioli, “Significance of osteoporosis: A growing international health care problem,” Calcif. Tissue Int., vol. 49, pp. S5–S7, jan 1991.
[2] R. Krug, A. J. Burghardt, S. Majumdar, and T. M. Link, “High-Resolution Imaging Techniques for the Assessment of Osteoporosis,” Radiol. Clin. North Am., vol. 48, pp. 601–621, may 2010.
[3] M. Granke, A. J. Makowski, S. Uppuganti, M. D. Does, and J. S. Nyman, “Identifying Novel Clinical Surrogates to Assess Human Bone Fracture Toughness,” J. Bone Miner. Res., vol. 30, no. 7, pp. 1290– 1300, 2015.
[4] M. Kru¨ger, A. Schwarz, and B. Blümich, “Investigations of silicone breast implants with the NMRMOUSE,” Magn. Reson. Imaging, vol. 25, pp. 215–218, feb 2007.
[5] G. Navon, U. Eliav, D. E. Demco, and B. Blümich, “Study of order and dynamic processes in tendon by NMR and MRI,” J. Magn. Reson. Imaging, vol. 25, no. 2, pp. 362–380, 2007.
[6] E. Rössler, C. Mattea, and S. Stapf, “Feasibility of high-resolution one-dimensional relaxation imaging at low magnetic field using a single-sided NMR scanner applied to articular cartilage,” J. Magn. Reson., vol. 251, pp. 43–51, feb 2015.
[7] E. Rössler, C. Mattea, S. Saarakkala, P. Lehenkari, M. Finnilä, L. Rieppo, S. Karhula, M. T. Nieminen, and S. Stapf, “Correlations of low-field NMR and variable-field NMR parameters with osteoarthritis in human articular cartilage under load,” NMR Biomed., vol. 30, no. 8, pp. 1–14, 2017.
[8] M. V. Landeghem, E. Danieli, J. Perlo, B. Blümich, and F. Casanova, “Low-gradient single-sided NMR sensor for one-shot profiling of human skin,” J. Magn. Reson., vol. 215, pp. 74–84, feb 2012.
[9] E. Bergman, Y. Sarda, N. Ritz, E. Sabo, G. Navon, R. Bergman, and U. Nevo, “In vivo assessment of aged human skin with a unilateral NMR scanner,” NMR Biomed., vol. 28, no. 6, pp. 656–666, 2015.
[10] T. S. Ali, M. C. Tourell, H. J. Hugo, C. Pyke, S. Yang, T. Lloyd, E. W. Thompson, and K. I. Momot, “Transverse relaxation-based assessment of mammographic density and breast tissue composition by single-sided portable NMR,” Magn. Reson. Med., vol. 82, no. 3, pp. 1199–1213, 2019.
[11] L. Brizi, M. Barbieri, F. Baruffaldi, V. Bortolotti, C. Fersini, H. Liu, M. Nogueira d’Eurydice, S. Obruchkov, F. Zong, P. Galvosas, and P. Fantazzini, “Bone volume–to–total volume ratio measured in trabecular bone by single-sided NMR devices,” Magn. Reson. Med., vol. 79, no. 1, pp. 501–510, 2018.
[12] P. Fantazzini, R. J. S. Brown, and G. C. Borgia, “Bone tissue and porous media: Common features and differences studied by NMR relaxation,” Magn. Reson. Imaging, vol. 21, no. 3-4, pp. 227–234, 2003.
[13] P. Fantazzini, V. Bortolotti, R. J. Brown, M. Camaiti, C. Garavaglia, R. Viola, and G. Giavaresi, “Two 1 H-nuclear magnetic resonance methods to measure internal porosity of bone trabeculae: By solid-liquid signal separation and by longitudinal relaxation,” J. Appl. Phys., vol. 95, pp. 339–343, jan 2004.
[14] G. Borgia, R. Brown, and P. Fantazzini, “Uniform-penalty inversion of multiexponential decay data,” Journal of Magnetic Resonance, vol. 132, no. 1, pp. 65 – 77, 1998.
[15] G. Borgia, R. Brown, and P. Fantazzini, “Uniform-penalty inversion of multiexponential decay data: II data spacing, t2 data, systematic data errors, and diagnostics,” Journal of Magnetic Resonance, vol. 147, no. 2, pp. 273 – 285, 2000.
[16] R. A. Horch, J. S. Nyman, D. F. Gochberg, R. D. Dortch, and M. D. Does, “Characterization of1H NMR signal in human cortical bone for magnetic resonance imaging,” Magn. Reson. Med., vol. 64, pp. 680–687, sep 2010.
[17] A. C. Seifert, S. L. Wehrli, and F. W. Wehrli, “Bi-component T2* analysis of bound and pore bone water fractions fails at high field strengths,” NMR Biomed., vol. 28, no. 7, pp. 861–872, 2015.
Figures