1159
Radiologic evaluation of MSDE-CUBE-FLEX for imaging brachial plexus1Radiology, Stanford university, Stanford, CA, United States
Synopsis
The conventional MRI examination of brachial plexus using 2D fast spin-echo sequences suffers from 1) long scan time due to a large field of view, 2) insufficient fat suppression due to strong off-resonance, 3) confusion between nerves and blood vessels. We recently presented a novel MSDE-CUBE-FLEX sequence addressing these issues by combining 1) outer volume suppression, 2) fast triple-echo Dixon technique, 3) magnitude-preparation to suppress blood signal. In this work, we compared the MSDE-CUBE-FLEX and 2D FSE sequences for imaging brachial plexus, which shows clear improvements in brachial plexus visualization with the MSDE-CUBE-FLEX sequence.
Introduction
2D T1-weighted fast spin echo (T1w-FSE) and 2D T2-weighted fast spin echo with fat saturation (T2wFS-FSE) have been widely used for the MRI protocol for imaging peripheral nerves1. The bright fat signal in T1w-FSE helps identifying major anatomic structures and secondary muscular changes from denervation1. The T2-weighted water-only image from T2wFS-FSE allows detecting abnormal signal increase on the pathologic nerve2,3. However, robust imaging of brachial plexus is difficult due to 1) the large field-of-view causing long scan time, 2) strong off-resonance causing incomplete fat suppression, and 3) T2-hypointense blood signal causing confusion with nerves1.Our group recently presented a novel 3D fast spin-echo sequence (CUBE) combined with the following three techniques to resolve the above issues, respectively4: 1) outer volume suppression5, 2) fast triple-echo Dixon (FLEX)6, 3) magnitude preparation by motion-sensitized driven equilibrium (MSDE)7. In this work, we conducted the radiologic comparison of water-only images from the MSDE-CUBE-FLEX and 2D T2w-FSE-FLEX sequences regarding the visualization of peripheral nerves in brachial plexus. We also compared the in-phase image of the MSDE-CUBE-FLEX and 2D T1w-FSE images to determine the equivalence of clinical utilities between them.
Methods
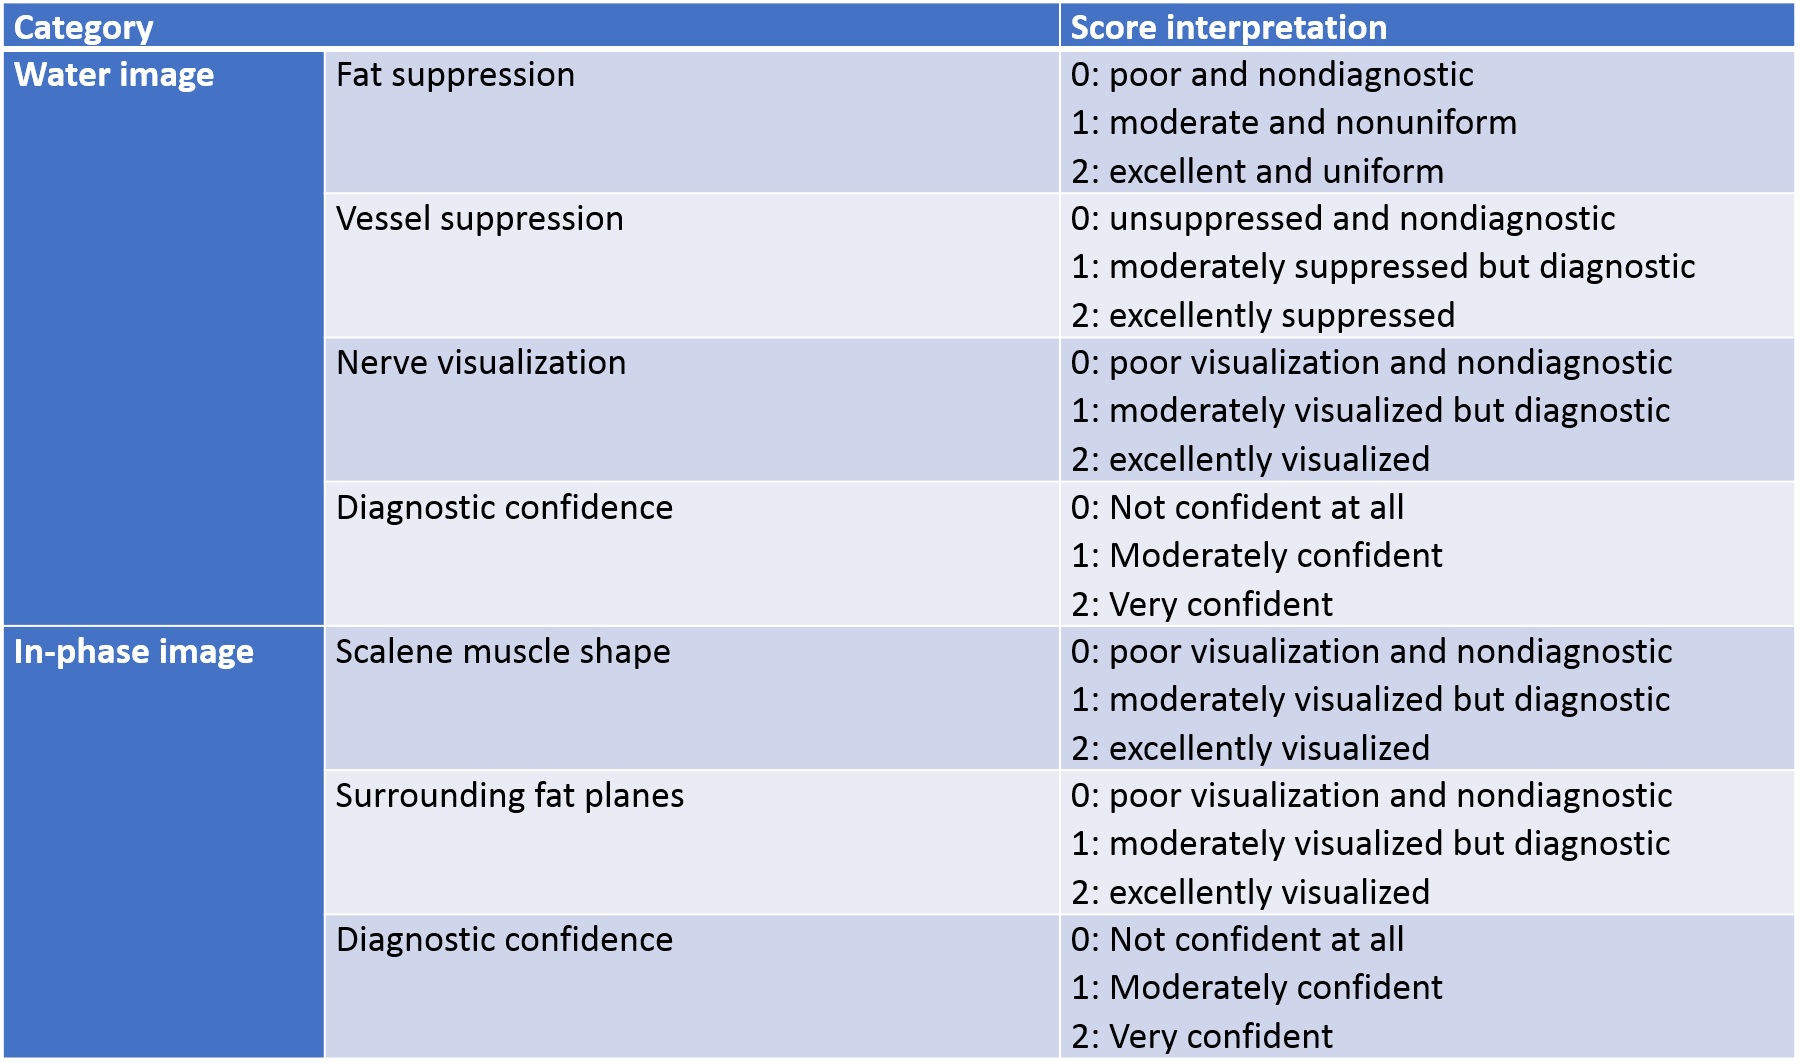
All human subjects signed an informed consent form approved by the institutional review board before the scan. 14 symptomatic patients participated in our study, and all scans were conducted on 3T GE MRI scanners of the same model (Discovery MR750, GE Healthcare, Waukesha, U.S.) using an HNS head/neck/chest phased coil array was used for signal reception. The brachial plexus protocol included 3D coronal MSDE-CUBE-FLEX, 2D coronal T2w-FSE-FLEX, 2D sagittal T1w-FSE sequences. The pulse sequence parameters of each sequence are as follows. MSDE-CUBE-FLEX / T2w-FSE-FLEX / T1w-FSE: TR = 2.5s/7.6s/0.83s, TE = 60ms/54ms/14.4ms, ETL = 64/14/4, FOV = 36x32.4cm/22x22cm/18x18cm , Matrix = 288x288/384x224/512x224, Slice thickness = 2mm/3mm/4mm, Bandwidth = ±250KHz/±50KHz/±35.71KHz, Undersampling factor (phase x slice) = 2x2/2x1/1x1, NEX = 1/2/2 . 1.7cm/s VENC was used for the MSDE preparation pulse.Two musculoskeletal radiologists scored the water images from the MSDE-CUBE-FLEX and T2w-FSE-FLEX sequences for 4 categories (fat suppression, vessel suppression, nerve visualization, and diagnostic confidence) on a 3-point scale. They also scored the in-phase images of the MSDE-CUBE-FLEX and T1w-FSE images for 3 categories (scalene muscle shape, surrounding fat planes, diagnostic confidence) on a 3-point scale. The interpretation of each score for each category is summarized in Figure 1. The review scores were compared using the two-tailed Wilcoxon signed rank test to determine the significance of the difference of the scores between two compared image groups. The inter-rater agreement on the review scores was assessed using Gwet’s agreement coefficient.
Results
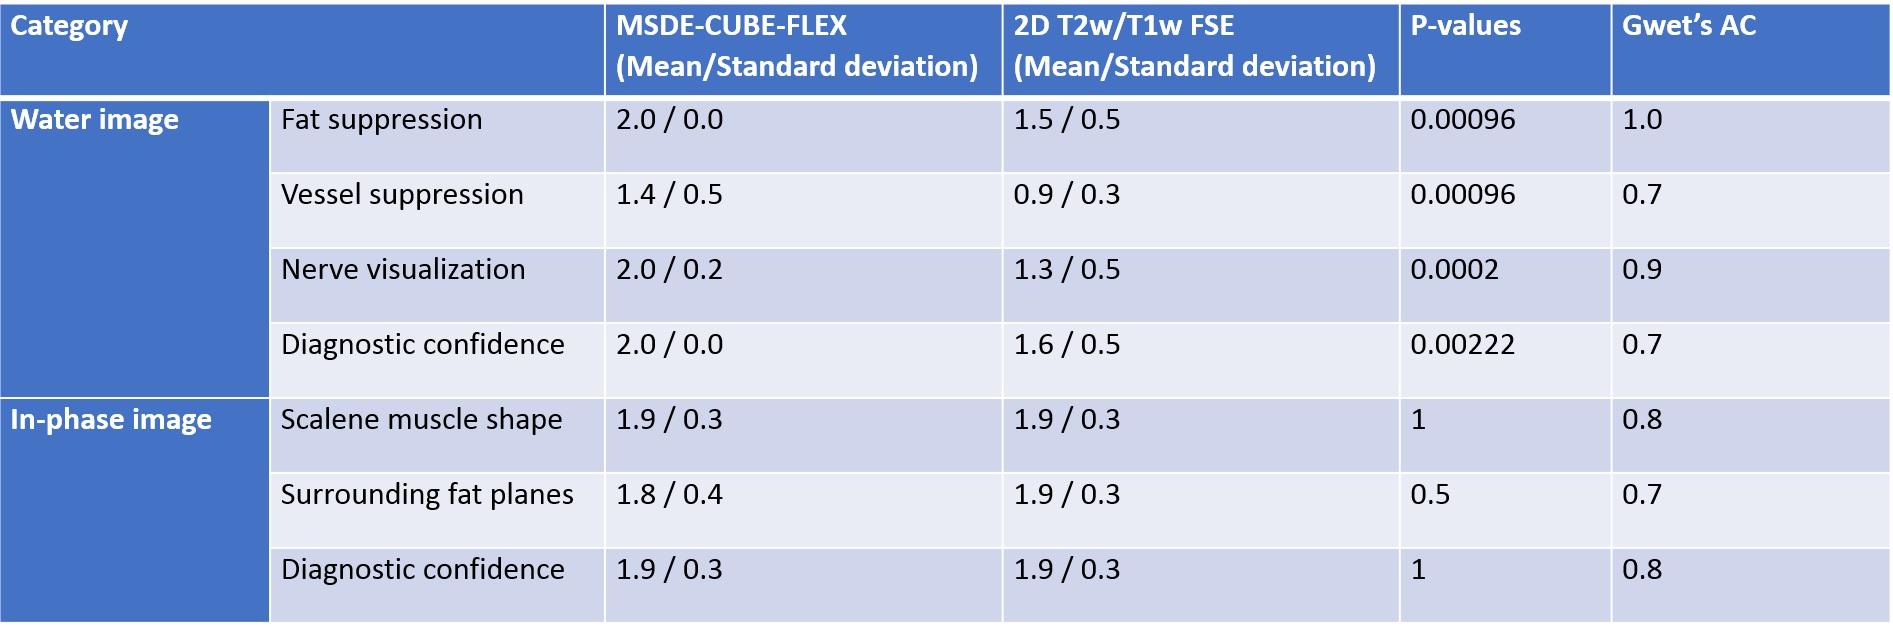
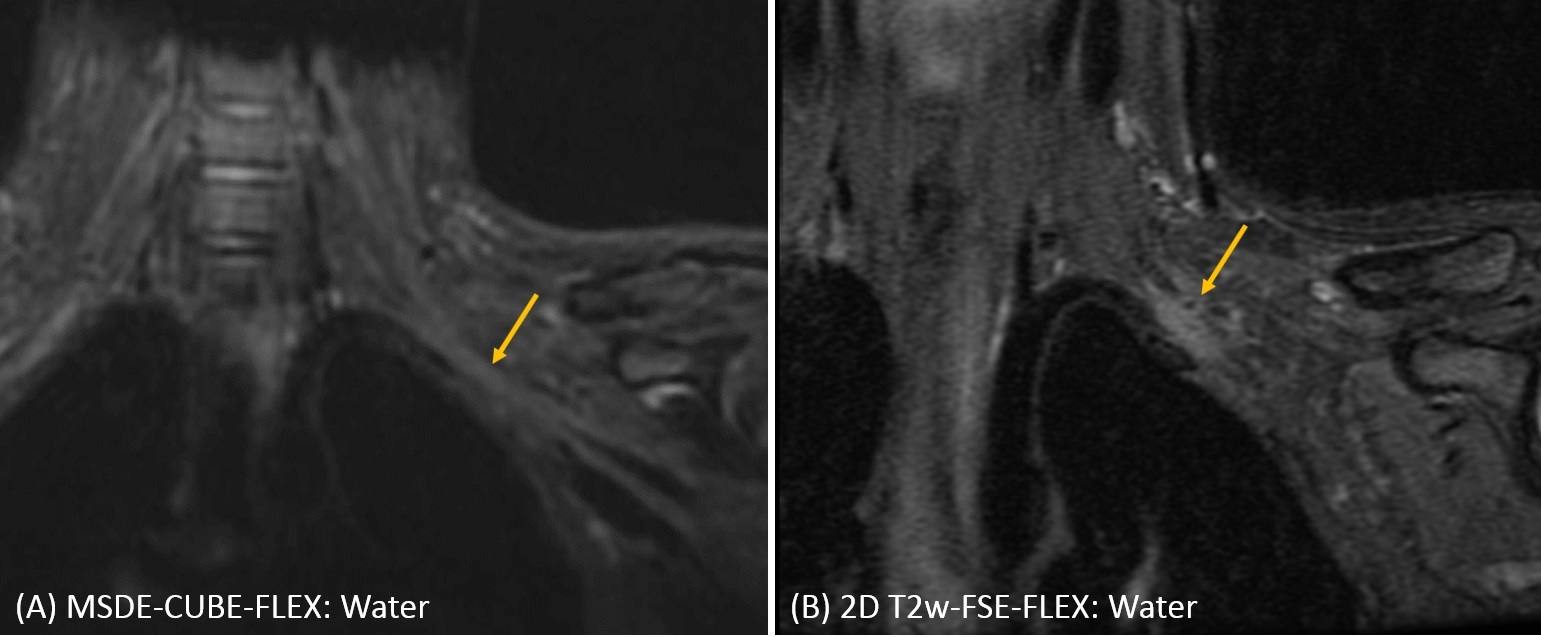
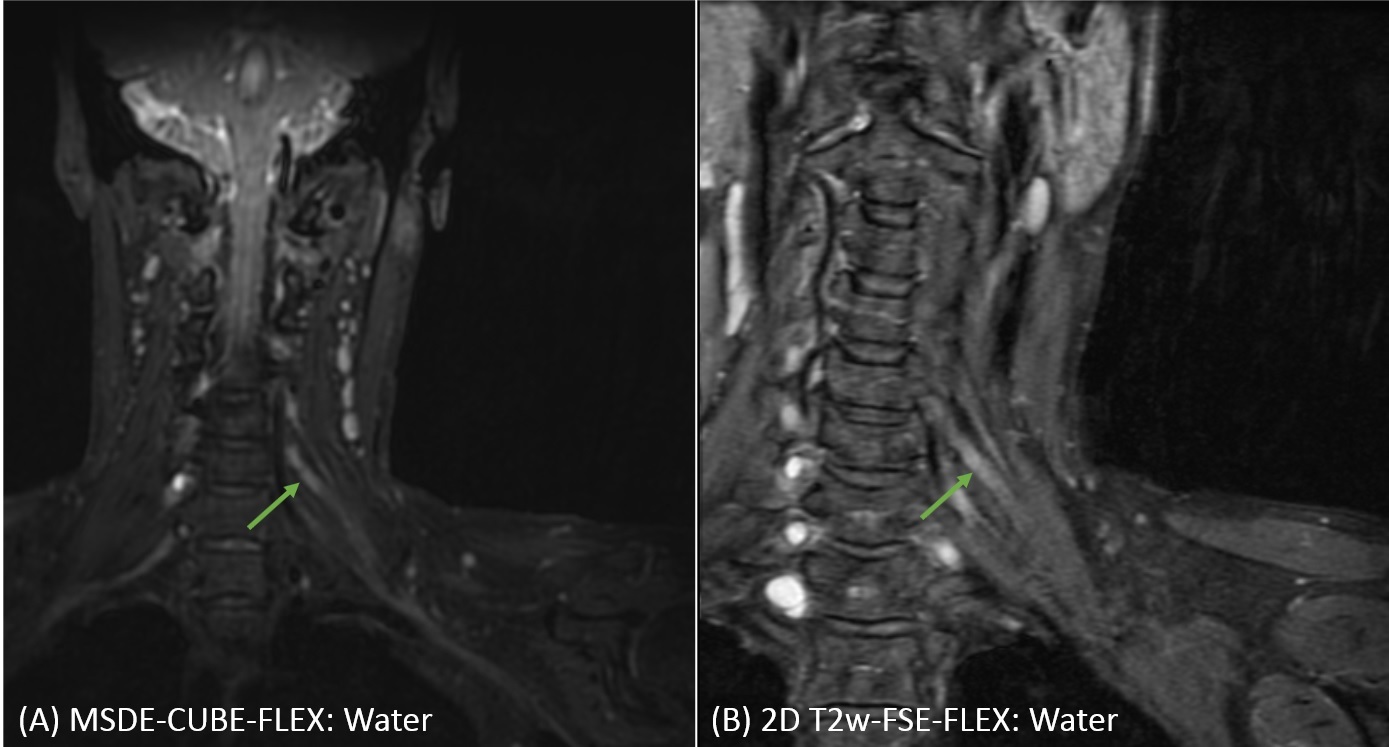
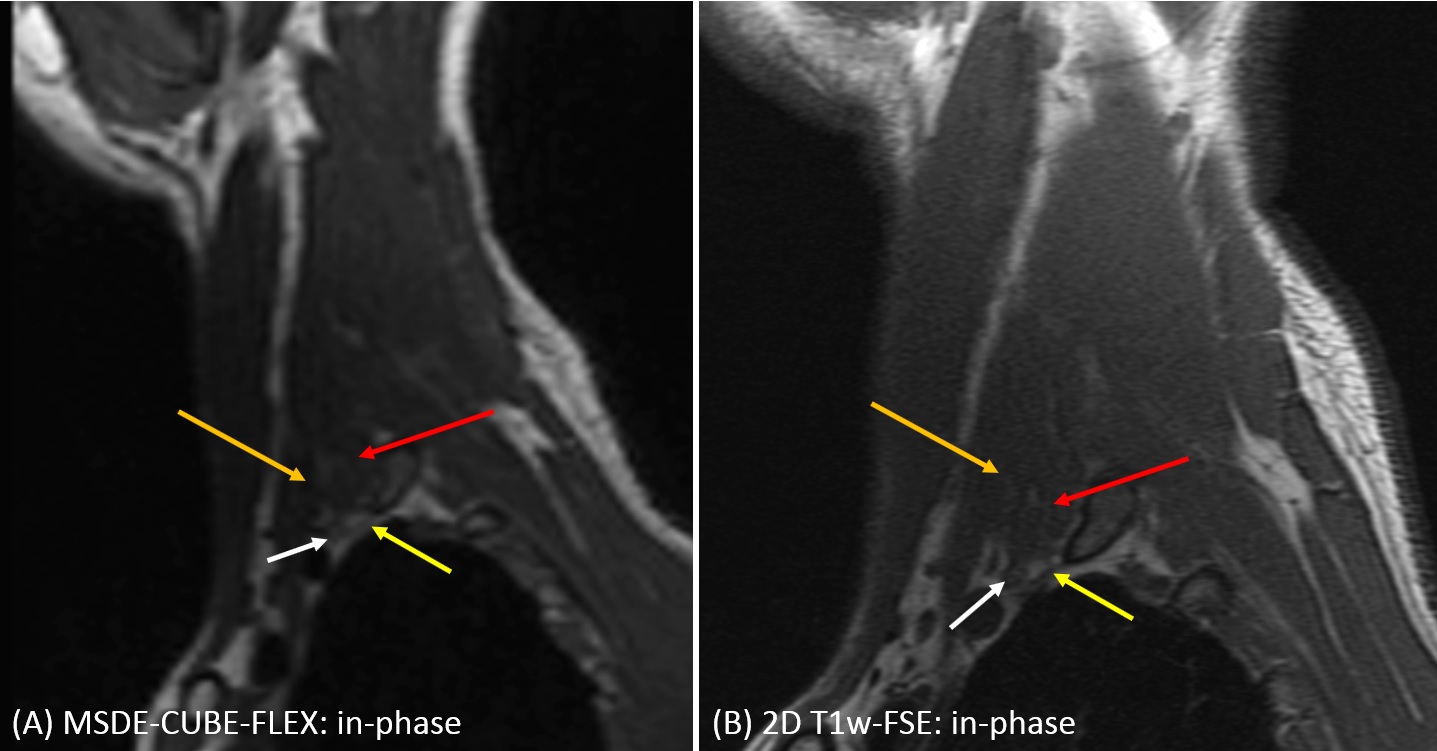
The MSDE-CUBE-FLEX sequence scored higher than T2w-FSE-FLEX in all evaluation categories for the quality of water images as summarized in Figure 2. All the associated p-values from the two tailed Wilcoxon signed rank test were smaller than 0.01, indicating the statistical significance in the difference between the scores of the compared two sequences. Figure 3 shows an example of the improved vessel suppression by the MSDE-CUBE-FLEX where vessels adjacent to the brachial plexus trunk was much better suppressed in the MSDE-CUBE-FLEX images. Figure 4 presents a case demonstrating an improved visualization of nerves by MSDE-CUBE-FLEX. The contrast between the C6 nerve and the surrounding background structures is more striking on the MSDE-CUBE-FLEX image than T2w-FSE-FLEX image.The MSDE-CUBE-FLEX scored similar to T1w-FSE in all evaluation categories for the quality of in-phase images (Figure 2). P-values for each category is all larger than 0.5, suggesting no significant difference in the quality of in-phase images. Figure 5 compare an example of in-phase images from the two sequences where the information mainly derived from the fat contrast is similar to each other. For example, on both images, the identification of anterior and middle scalene muscles was possible, and the perineural fat contrast was sufficient to locate the C8 nerves. Gwet’s agreement coefficient values ranged from 0.7 to 1 for evaluation categories, indicating that the agreement between the two readers was consistently substantial.
Discussion
The conventional MRI approach of examining the brachial plexus requires the separate acquisition of T1 and T2 weighted FSE sequences. In-phase and water-only images from the proposed MSDE-CUBE-FLEX sequence demonstrated functional equivalence or even improvements compared to T1 and T2 weighted 2D FSE images, respectively. Higher nerve visualization contrast in the water images from the MSDE-CUBE-FLEX sequence can be attributed to the improved blood signal suppression from the MSDE magnitude preparation, and possibly thinner slice resolution that became feasible by the 3D acquisition. Evaluation with a larger cohort of patients would be necessary to fully support the replacement of two 2D FSE acquisitions compared here with a single acquisition of the proposed MSD-CUBE-FLEX.Conclusion
In summary, we have conducted radiologic comparison of MSDE-CUBE-FLEX and 2D FSE with T1 and T2 weighted sequences. Our results showed improved and equivalent visualization of peripheral nerves and surrounding structures compared to T2 and T1 weighted FSE sequences, respectively.Acknowledgements
GE Healthcare, NIH P41 EB015891.References
1. Aagaard BD, Maravilla KR, Kliot M. MR neurography. MR imaging of peripheral nerves. Magn Reson Imaging Clin N Am. 1998;6:179-194.
2. Dailey AT, Tsuruda JS, Filler AG, et al. Magnetic resonance neurography of peripheral nerve degeneration and regeneration. Lancet 1997;350:1221-1222
3. Du R, Auguste KI, Chin CT, et al. Magnetic resonance neurography for the evaluation of peripheral nerve, brachial plexus, and nerve root disorders. J Neurosurg. 2010;112:362-371
4. Taviani V, Mitsuharu M, Wang K, et al. A Flexible Technique for Flow-Sensitive Fat-Suppressed High-Resolution Peripheral Nerve Imaging. Proceedings of International Society of Magnetic Resonance in Medicine 2017, p.96
5. Banerjee S et al. Isotropic volumetric imaging of lumbar and brachial plexus using outer volume suppression CUBE MSDE. Proceedings of International Society of Magnetic Resonance in Medicine 2015, p.2309.
6. Ma J, Son J, Zhou Y, Le-Petross H, Choi H. Fast spin-echo triple-echo Dixon (fTED) technique for efficient T2-weighted water and fat imaging. Mag Reson Med. 2007;58(1):103-109.
7. Brittain JH et al, Coronary angiography with magnetization-prepared T2 contrast. Mag Reson Med. 1995;33(5): 689-696.
Figures