1158
About the origin of decreased 1H NMRS-based water T2 in highly fatty infiltrated skeletal muscles of subjects with neuromuscular disorders1NMR Laboratory, Neuromuscular Investigation Center, Institute of Myology, Paris, France, 2NMR Laboratory, CEA/DRF/IBFJ/MIRCen, Paris, France, 3Consultants for Research in Imaging and Spectroscopy, Tournai, Belgium
Synopsis
1H NMRS-based water T2 (T2w) has shown to be decreasing when muscle fat fraction levels are elevated (>60%). Here, two myopathy patient groups with similar fat fraction levels (>60%) emerged, being a group with T2w>30 ms and a group with T2w<30 ms, which seemed to be correlated to the respective water resonance linewidths. Interpretation of these reduced T2w values at high fat fractions needs to be handled cautiously. The larger linewidths observed in the spectra characterized by shorter T2w may be due to the local B0 gradients induced by susceptibility differences between muscle and fat.
Introduction
Many studies in the field of neuromuscular disorders use quantitative NMRI (qNMRI) as an outcome measure for evaluating the disease status in skeletal muscle1. qNMRI techniques based on the separation of water and fat signal are used to determine the amount of muscle fat replacement, which corresponds to the degree of ‘disease progression’1. Skeletal muscle water T2 is, however, a sensitive, yet non-specific qNMRI marker of ‘disease activity’ in neuromuscular diseases2-4. Although quantitative water T2 mapping is usually performed, disentangling of water and lipid contributions remains a non-trivial issue, leading to possibly biased values in highly fatty infiltrated muscles5. For this reason, 1H NMRS is still perceived as the ‘gold standard’ for determining the water T2 (T2w) value in skeletal muscle due to the frequency-based separation between water and lipids6. Recent 1H NMRS data in skeletal muscle of patients with neuromuscular disorders also demonstrated, though, decreased T2w values at high muscle fat levels7. We wanted to further investigate this behavior of 1H NMRS-based T2w in a large data set of subjects with fat fraction values varying between 0% and 80% and confront these results with corresponding qNMRI data.Methods
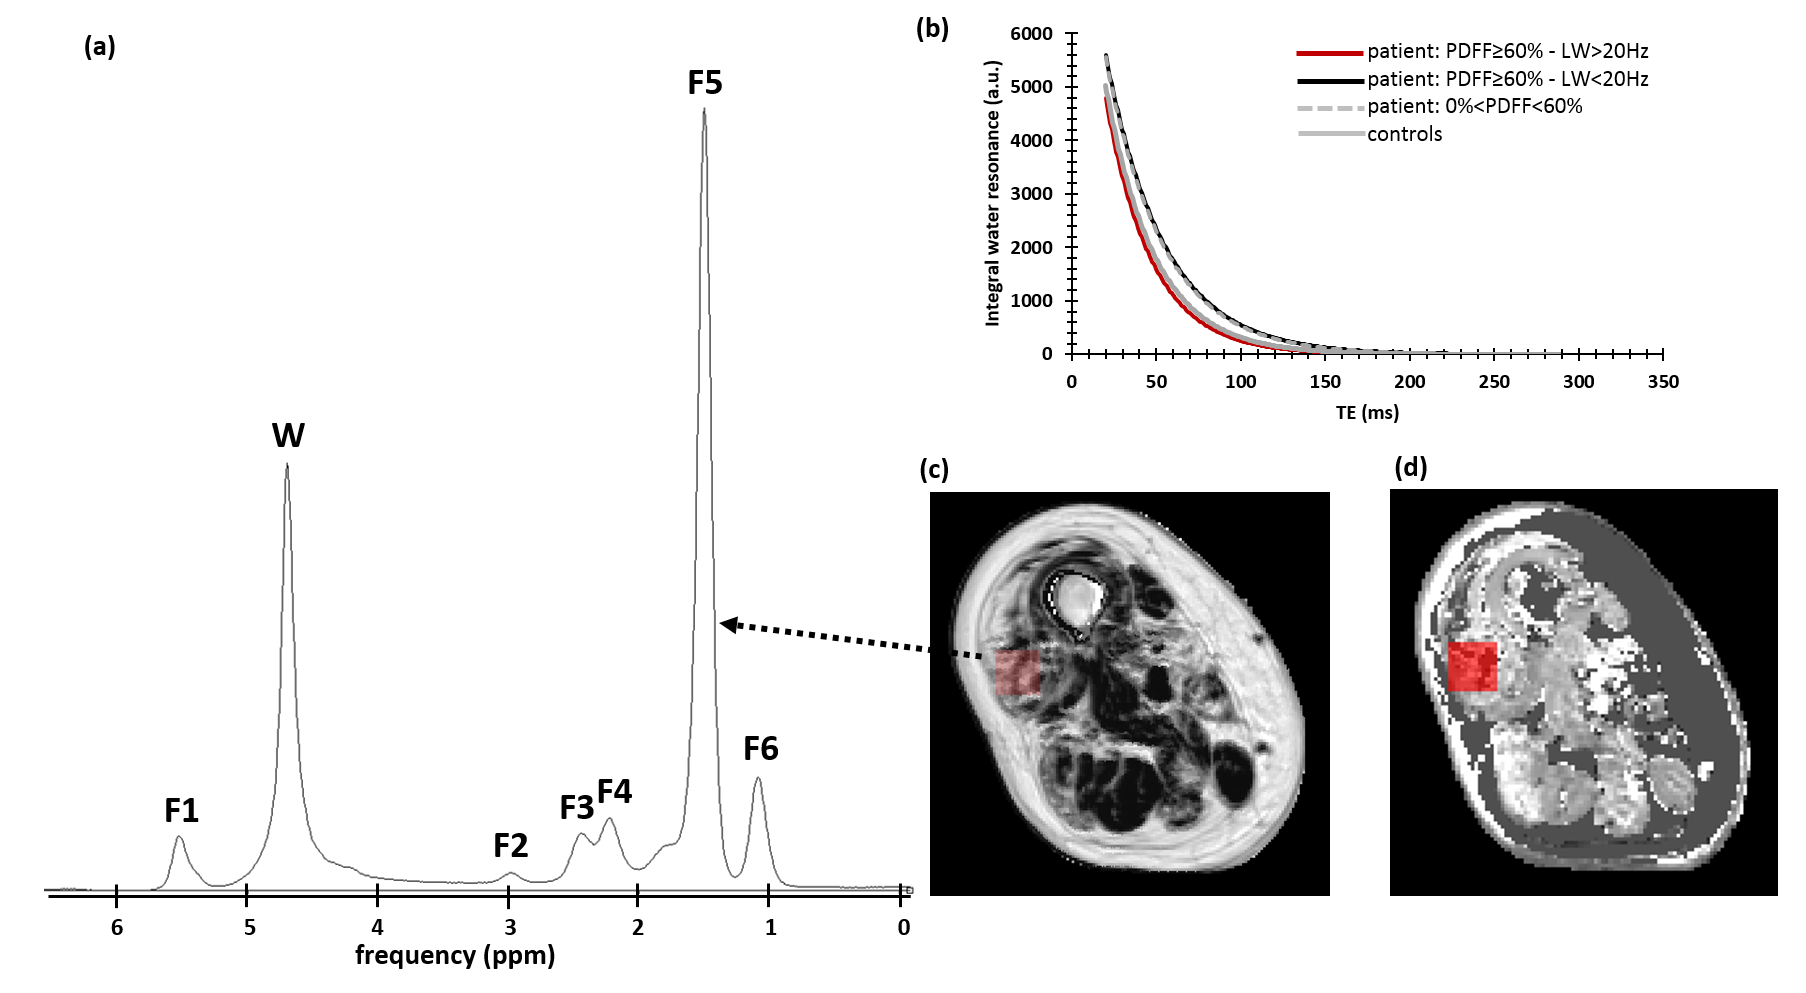
NMR data were obtained using a 3-T Trio or Prisma Siemens clinical scanner, and were acquired in both 214 patients suffering from various neuromuscular disorders (including mostly Duchenne muscular dystrophy, inclusion body myositis and unclassified myopathy patients) and 46 healthy controls. Non-water suppressed single voxel 1H NMR spectra, using STEAM for localization, were obtained at 14 different TEs (TE=20/27/36/45/54/63/81/90/108/135/162/198/243/288) with the frequency centered to the water resonance (4.7 ppm), a TR of 6500 ms, a TM of 10 ms, 4 averages, a volume of interest (VOI) between 15x15x15 mm3 and 20x20x20 mm3. The VOI was predominantly localized in vastus lateralis, vastus medialis, gastrocnemius medialis, soleus or tibialis anterior muscles, at different fat fraction levels (Fig. 1). To ensure high spectral quality, shimming was performed including the automatic three-dimensional map shim and further interactive adjustments. In the spectroscopic VOI, also water T2 mapping was performed, using a multi-slice multi-echo (MSME) sequence, consisting of 17 equidistant TEs (TE=9.5-161.5 ms), a TR of 3000 ms, as well as Fat% mapping using 3-point Dixon qNMRI (Fig. 1). 1H NMR spectra were processed in jMRUI. All spectra were aligned with the water frequency at 4.7 ppm, followed by Lorentzian apodization and zero-order. Using the AMARES algorithm, the water and up to six lipid resonances were fitted. Then, T2 of all resonances were calculated using a mono-exponential fit (S=S0*e-TE/T2) of the peak amplitudes obtained at the 14 different TEs (Fig. 1). Proton density fat fraction (PDFF) was determined based on the peak amplitudes of the T2-corrected lipid and the water resonances. Also the linewidth (LW) of the water resonance was assessed at TE=20ms (full-width-at-half-maximum). From the MSME and Dixon images, the water T2 value was extracted using the tri-exponential fitting procedure and the Fat% value, respectively, within the spectroscopic VOI (5). Besides the computation of the mean value of water T2, also heterogeneity indices were assessed such as the standard deviation (SD) and coefficient of variation (CV) of water T2. Spearman correlation analysis (ρ) was performed as well as Kruskall-wallis tests for comparing groups (P<0.05).Results
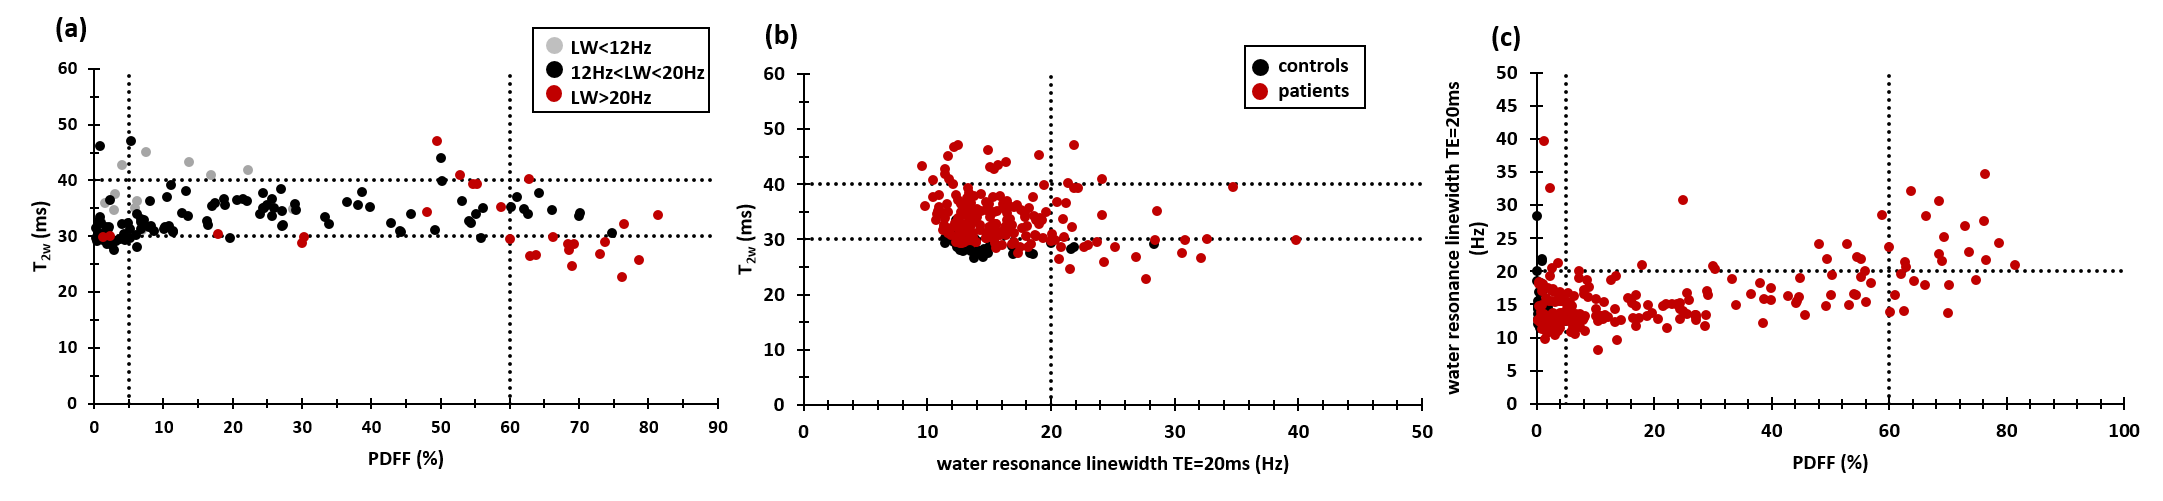
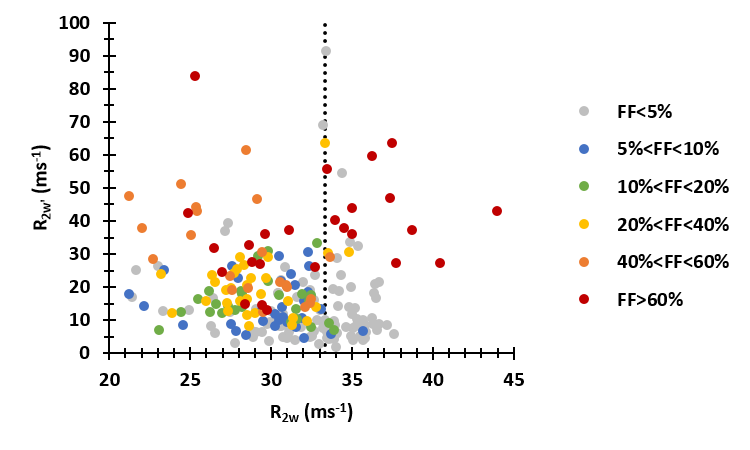
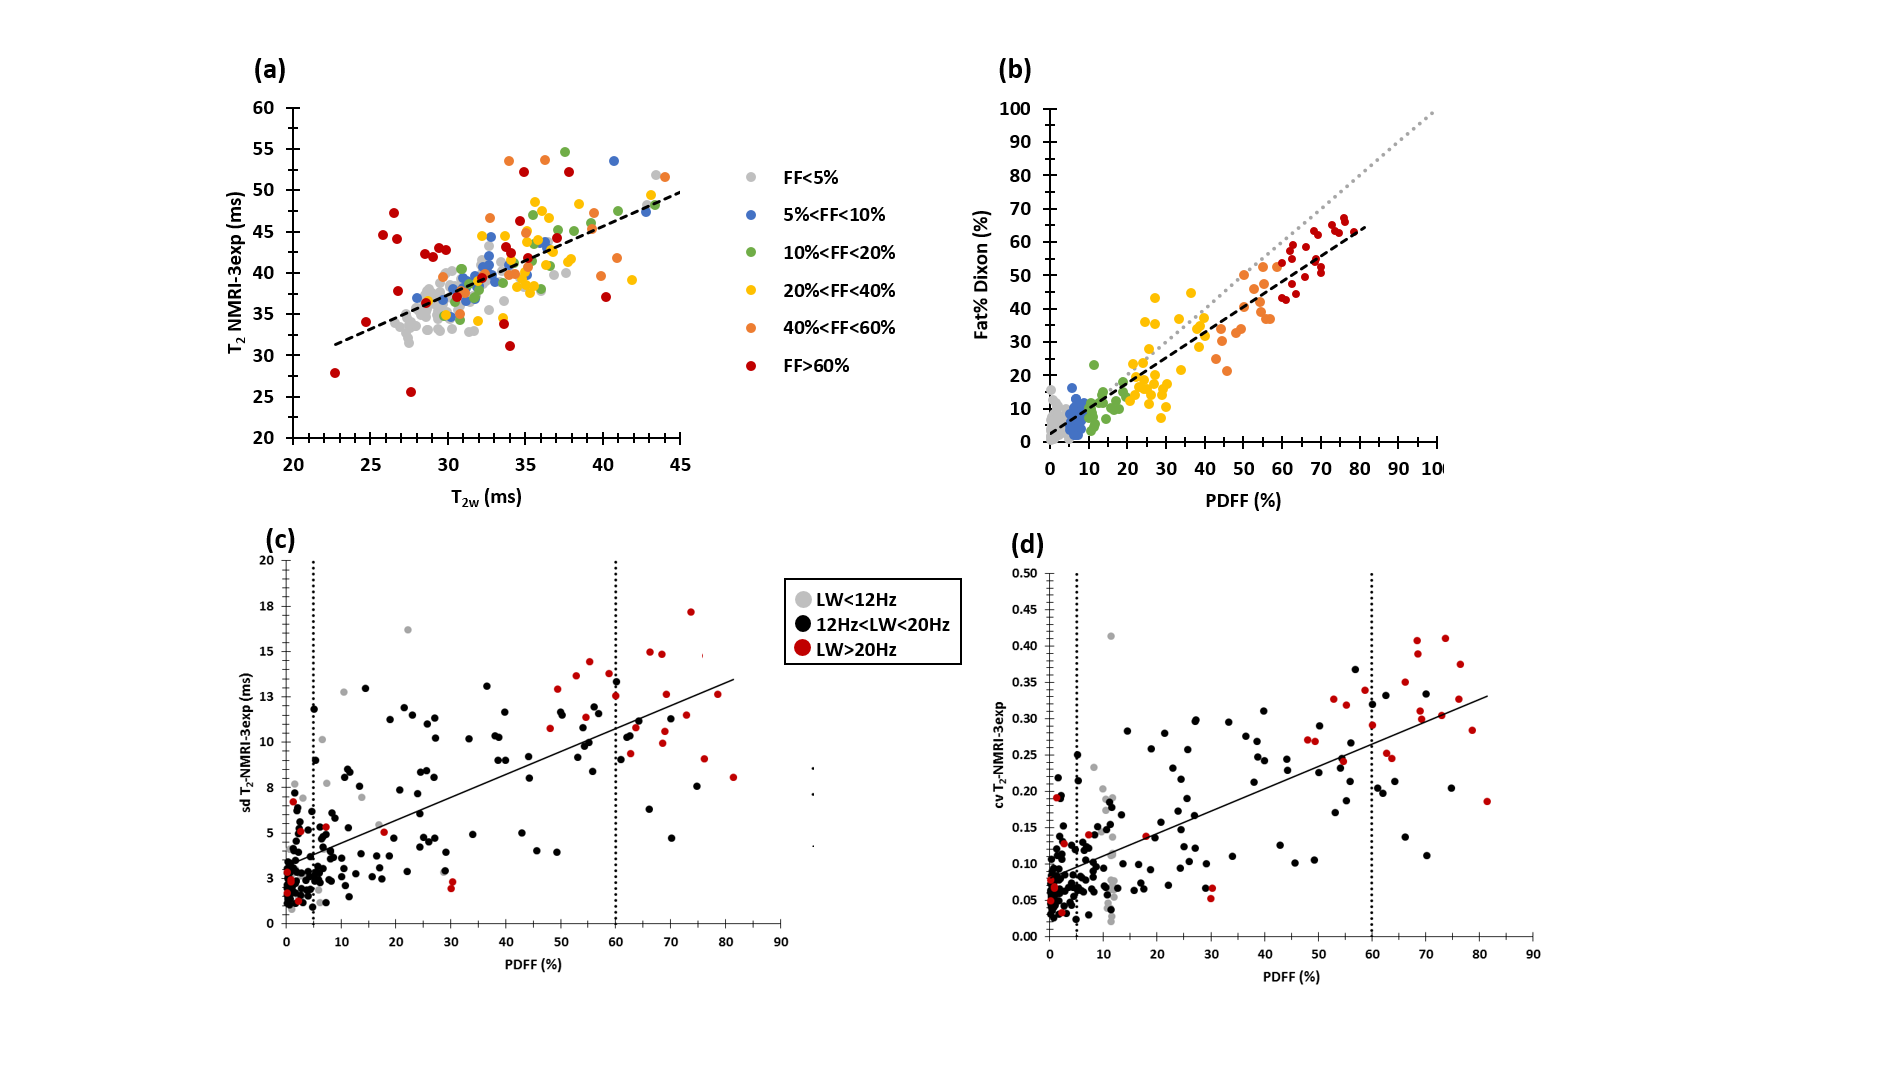
T2w was weakly correlated with PDFF (Fig. 2a). From the data, it was evident that this T2w was clearly decreased in subjects with FF≥60%. T2w correlated negatively with the water resonance LW (Fig. 2b). When looking more closely to these heavily affected patients, we found that in the subjects with lower T2w values (T2w=27.2±2.1 ms) spectra presented larger water resonance LW (LW=25.6±3.6 Hz) than in subjects with higher T2w values (T2w=34.5±2.5 ms, LW=18.3±3.3 Hz, P<0.001). Correlating 1/T2w (R2w) and R2w’, reflecting the B0 inhomogeneity in the voxel, we observed that in subjects with high PDFF and elevated R2w’, R2w was also elevated, whereas in subjects with lower PDFF and elevated R2w’ R2w was not elevated (Fig. 3). We also found a strong correlation between PDFF and SD and CV of the water T2 value as determined using T2 mapping (Fig. 4c/d). Moreover, when assessing the cases with PDFF≥60%, CV (but not SD) was found to be significantly lower in those patients with water LW<20 Hz than in patients with water LW>20 Hz (P=0.009) (Table 1). 1H NMRI-based T2 (which correlated well with 1H NMRS-based T2w) and 1H NMRI-based Fat% (which correlated well with 1H NMRS-based PDFF,) were also not significantly different between PDFF≥60%/LW<20Hz and PDFF≥60%/LW>20Hz (Fig. 4 a/b, Table 1).Discussion/Conclusion
Lower T2w values at high PDFF values is not a new finding (either with NMRI or NMRS)5,7-8. We merely want to illustrate that interpretation of 1H NMRS-based T2w values at high fat fractions needs to be done with caution, for example when therapeutic intervention show significant decreases in T2w. The larger LWs observed in the spectra characterized by shorter T2w may be explained by the local B0 gradients induced by susceptibility differences between muscle and fat. The water diffusion through these susceptibility-induced field gradients might negatively bias the apparent T2w in those regions with specific fatty infiltration patterns8.Acknowledgements
No acknowledgement found.References
1Carlier PG, Marty B, Scheidegger O, Loureiro de Sousa P, Baudin P-Y, Snezhko E, et al. Skeletal muscle quantitative nuclear magnetic resonance imaging and spectroscopy as an outcome measure for clinical trials. J Neuromuscul Dis. 2016;3(1):1–28.
2Carlier PG, Azzabou N, de Sousa PL, Hicks A, Boisserie JM, Amadon A, et al. Skeletal muscle quantitative nuclear magnetic resonance imaging follow-up of adult Pompe patients. J Inherit Metab Dis. 2015;38(3):565–72.
3Wary C, Azzabou N, Giraudeau C, Le Louër J, Montus M, Voit T, et al. Quantitative NMRI and NMRS identify augmented disease progression after loss of ambulation in forearms of boys with Duchenne muscular dystrophy. NMR Biomed. 2015;28(9):1150–62.
4Hooijmans MT, Niks EH, Burakiewicz J, Verschuuren JJGM, Webb AG, Kan HE. Elevated phosphodiester and T2 levels can be measured in the absence of fat infiltration in Duchenne muscular dystrophy patients. NMR Biomed. 2017;30(1):e3667.
5Azzabou N, de Sousa PL, Araujo EC, Carlier PG. Validation of a generic approach to muscle water T2 determination at 3T in fat-infiltrated skeletal muscle. J Magn Reson Imaging. 2015;41(3):645–53.
6Arpan I, Willcocks RJ, Forbes SC, Finkel RS, Lott DJ, Rooney WD, et al. Examination of effects of corticosteroids on skeletal muscles of boys with DMD using MRI and MRS. Neurology. 2014;83(11):974–80.
7Schlaeger S, Deschauer M, Zimmer C, Weidlich D, Schoser B, Klupp E, et al. Decreased water T2 in fatty infiltrated skeletal muscles of patients with neuromuscular diseases. NMR Biomed. 2019;32(8):e4111.
8Loughran T, Higgins DM, McCallum M, Coombs A, Straub V, Hollingsworth KG. Improving highly accelerated fat fraction measurements for clinical trials in muscular dystrophy: origin and quantitative effect of R2* changes. Radiology. 2015;275(2):570–8.
Figures