1157
Quantitative 1H and 23Na NMR imaging in the skeletal muscles of patients with fascioscapulohumeral muscular dystrophy1NMR Laboratory, Neuromuscular Investigation Center, Institute of Myology, Paris, France, 2NMR Laboratory, CEA/DRF/IBFJ/MIRCen, Paris, France, 3Institute of Radiology, University Hospital, FAU, Erlangen, Germany, 4Institute of Neurology, FAU, Erlangen, Germany, 5Department of Neuropathology, University Hospital Erlangen, FAU, Erlangen, Germany, 6Division of Medical Physics in Radiology, DKFZ, Heidelberg, Germany, 7Institute of Medical Physics, FAU, Erlangen, Germany
Synopsis
Facioscapulohumeral muscular dystrophy (FSHD) is a neuromuscular disorder characterized by structural changes affecting skeletal muscle tissues, resulting in muscle wasting and dysfunction. Here, we determined the value of quantitative 1H and 23Na muscle MRI approaches for providing variables related to disease severity (fat fraction) and disease activity (water T2, water T1, total sodium content and inversion-recovery 23Na) in patients with FSHD. We found that MRI variables related to water mobility and ion homeostasis were increased at an early stage of the degeneration process in several muscles of FSHD patients and represent potential candidates for assessing treatment response in clinical trials.
INTRODUCTION
Facioscapulohumeral muscular dystrophy (FSHD) is a severe neuromuscular disorder characterized by structural changes affecting skeletal muscle tissues (inflammation, necrosis and fat infiltrations), resulting in progressive muscle wasting and dysfunction. Qualitative T1-weighted imaging is often used in this condition to evaluate the pattern of muscles affected by fatty infiltrations. Fat suppressed T2-weighted imaging has also been suggested to detect edema, as an early indicator of disease progression1. Because innovative therapeutic approaches are about to be evaluated in clinical trials2, quantitative imaging biomarkers reflecting the different pathological processes are needed to objectively assess treatment efficacy. It is well accepted that intramuscular fat fraction (FF), measured by Dixon sequences, represents a robust biomarker of disease severity in neuromuscular diseases (NMDs). Water T2 has been considered for decades as an efficient biomarker of disease activity3. Tissue sodium concentration (TSC), as measured by 23Na MRI, has also been shown to be a sensitive marker of cell integrity and energy metabolism, for example in DMD4 and in myotonic dystrophy patients5. Very recently, water T1, as measured by MR fingerprinting with water and fat separation (MRF T1-FF)6, has also been proposed for monitoring disease activity in NMDs. The aim of our study was to determine the value of these quantitative state of the art 1H and 23Na MRI to provide imaging biomarkers of disease activity and disease severity in patients with FSHD.METHODS
Sixteen patients (33 - 67 years, 13 men) with genetically confirmed FSHD, and 9 age-matched volunteers (30 - 70 years, 8 men) were recruited for this prospective study. Images were acquired in the dominant leg with a 3T scanner (Magnetom Skyra, Siemens Healthcare).A 15-channel quadrature knee coil (Siemens Healthcare) was used for 1H imaging. FF was measured using a 3D 3-point Dixon method (3 TEs = 2.75/ 3.95/ 5.15 ms, TR = 10 ms, FA = 3°, 64 slices, 5 mm, Tacq = 3 min 12 s). Fat-suppressed T2 weighted (STIR T2w) images were acquired to qualitatively detect muscle edema (TI = 220 ms, TE = 69 ms, TR = 6.9s, FA = 145°, 23 slices, 5 mm, Tacq = 3 min 29 s). A multi- spin-echo (MSE) sequence was acquired (32 echoes: TEs ranging from 9.5 ms to 304 ms, TR = 3 s, 5 slices, 10 mm, Tacq = 3 min 41 s) from which T2H2O values were calculated based on a tri-exponential fitting procedure7. A MRF T1-FF sequence was acquired (train of 1400 spokes, varying TE, TR and FA, 3 slices, 10mm, Tacq = 30s) to generate T1H2O maps using a bi-component model5.
Sodium imaging was performed using a 23Na birdcage knee coil (Stark Contrast). All 23Na images were acquired using a density-adapted 3D-radial readout scheme8. For TSC, the following parameters were used: TE = 0.3 ms, TR = 120 ms, 5384 projections, Tacq = 10 min 46 s. Inversion recovery (IR-23Na) images were acquired with a TI of 34 ms to reduce the signal originating from free 23Na9 (TE = 0.3 ms, TR = 124 ms, 4760 projections, Tacq = 9 min 50 s). TSC and IR-23Na signals were calibrated using reference phantoms and corrected for the non-negligible sodium signal of fat4.
The different 1H and 23Na indices were estimated in the following muscles of the leg: gastrocnemius medialis, soleus, tibialis anterior, and tibialis posterior.
RESULTS
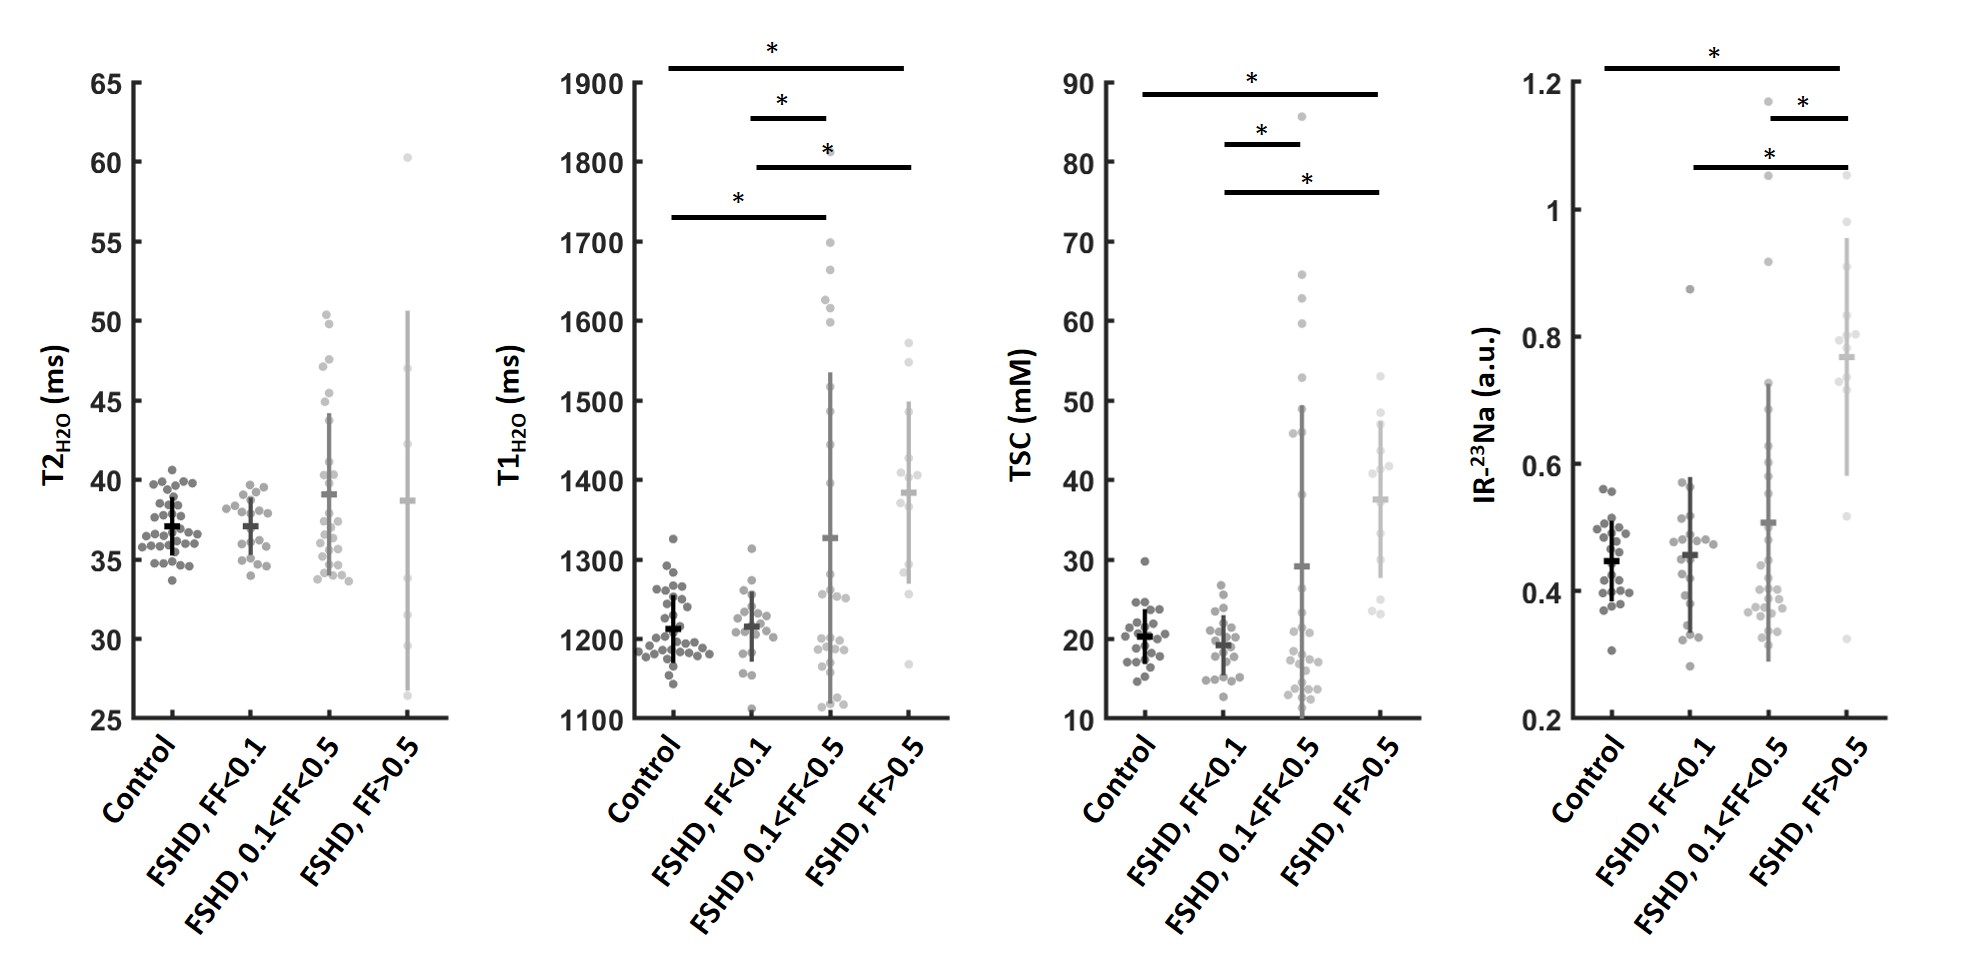
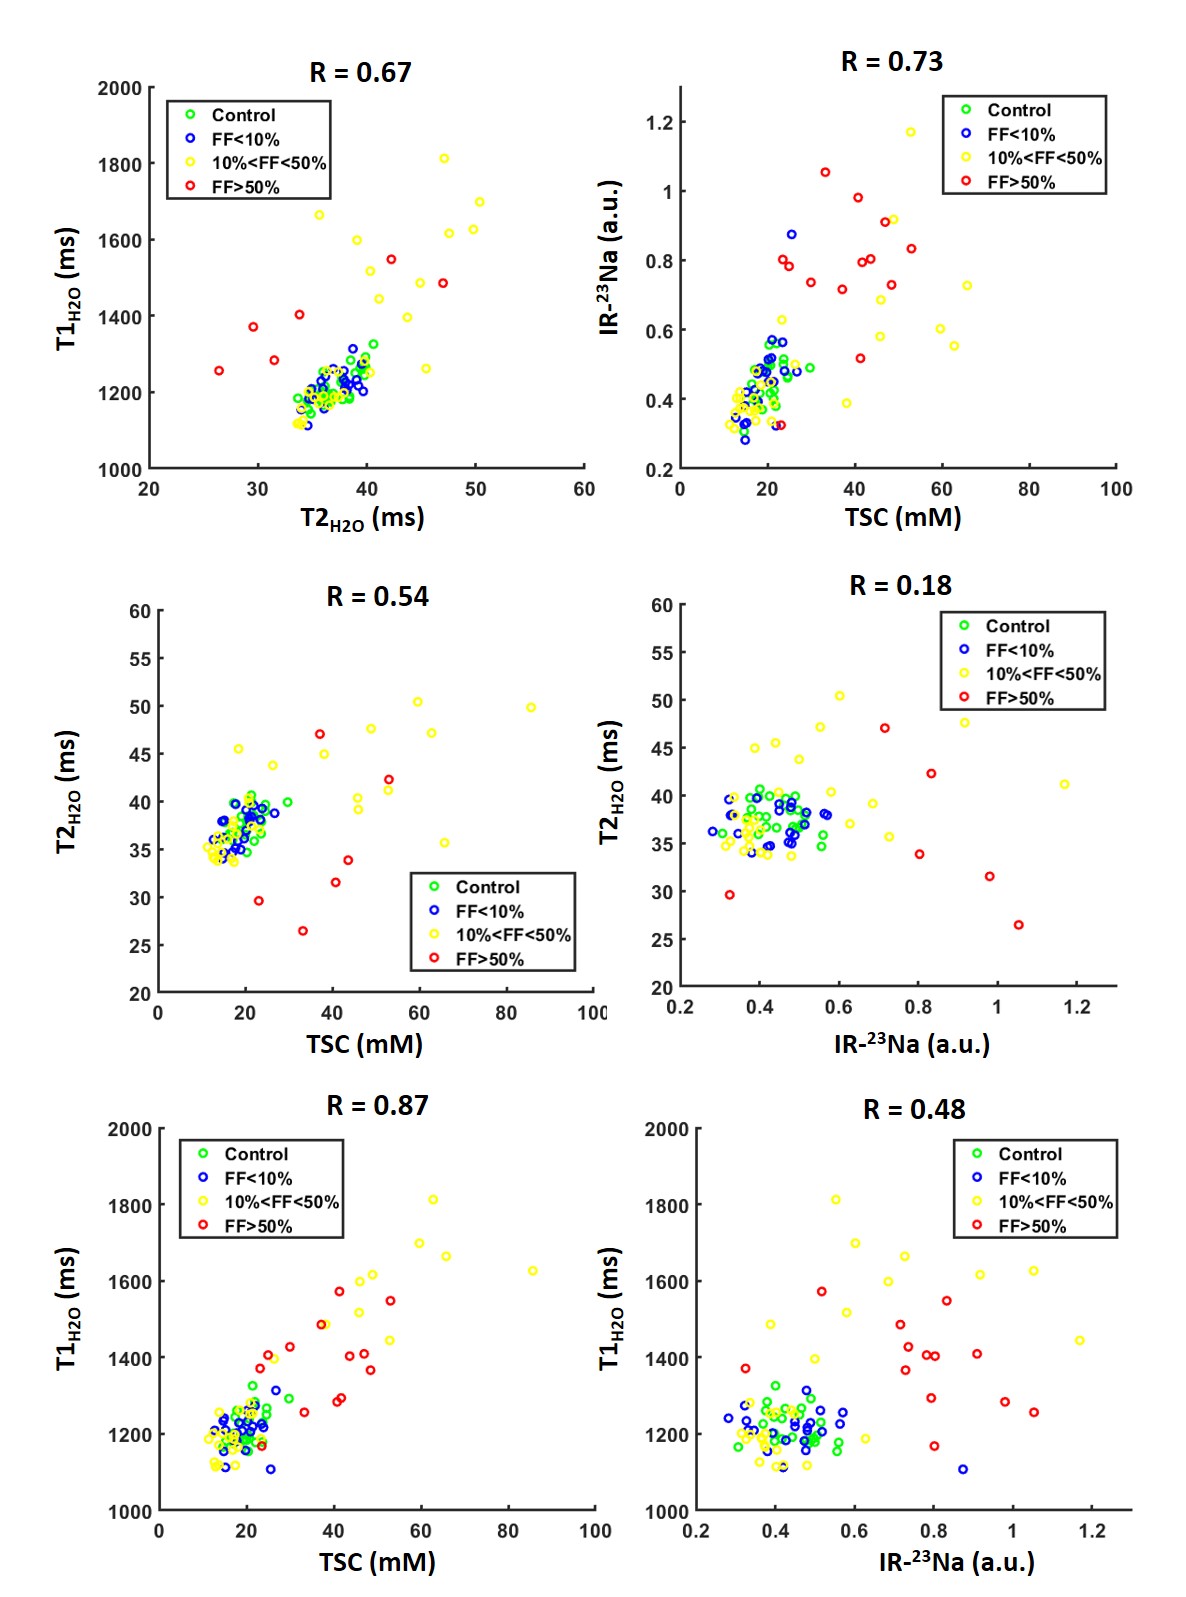
Figure 1 represents examples of FF maps, STIR T2w images, and corresponding T2H2O, T1H2O, TSC and IR-23Na maps in a 30-year old healthy volunteer and a 47-year old FSHD patients. Fatty infiltrations as well as edema-like changes, increased T2H2O, T1H2O, TSC and IR-23Na signals were present in the FSHD patient compared to the control. Muscles of FSHD patients were gathered in 3 groups according to their intramuscular fat fraction (FF < 0.1, 0.1<FF<0.5 and FF>0.5). Muscles with FF < 0.1 were not different than healthy muscles for all disease activity indices. Both groups with FF > 0.1 had higher T1H2O and TSC values than muscles with FF < 0.1. IR-23Na values were statistically increased in the group with FF > 0.5 compared to other groups. Interestingly, even if increased T2H2O values were observed in some muscles of FSHD patients, T2H2O was not significantly different between the different FF groups. The most important changes of the different variables were observed for a subgroup of muscles with intermediate FF (Figure 2). Significant correlations were measured between the different indices (Figure 3): the tightest being observed between the two 23Na variables (R = 0.73) and between T1H2O and TSC (R = 0.87).DISCUSSION AND CONCLUSION
Here, we evaluated different state of the art 1H and 23Na MRI approaches for providing quantitative indices related to disease severity (FF) and disease activity (T2H2O, T1H2O, TSC and IR-23Na) in patients with FSHD. We determined that most of these variables can differentiate patients from healthy controls. From these data, it seems that T2H2O values were more influenced than the others by fatty infiltrations. Imaging variables related to water mobility (T1H2O) and ion homeostasis (TSC) were increased at an early stage of the tissue degeneration process in several muscles and represent potential candidates for assessing early treatment response in clinical trials related to FSHD.Acknowledgements
No acknowledgement found.References
1- Friedman et al, Muscle Nerve (2012); 45(4):500-506.
2- Hamel et al., Neurotherapeutics (2018); 15(4) : 863-871
3- Carlier et al., J Neuromuscul Dis (2016); 3(1):1-28.
4- Gerhalter et al., J Magn Reson Imaging (2019); 50(4):1103-1113.
5- Constantinides et al., Radiology (2000); 216(2):559-68
6- Marty et al., Magn Reson Med (2019); doi: 10.1002/mrm.27960.
7- Azzabou et al., J Magn Reson Imaging (2015); 41(3):645-53.
8- Nagel et al., Magn Reson Med (2009); 62:1565-1573.
9- Nagel et al, Invest Radiol (2011); 46(12):759-766.
Figures