1155
3D Internal dynamic strains in the intervertebral disc (IVD) of the lumbar spine with GRASP-MRI under mechanical loading1Center for Biomedical Imaging, Department of Radiology, New York University Langone Health, New York, NY, United States
Synopsis
The goal of this study was to develop a non-invasive MRI technique to measure 3D dynamic internal strains in the intervertebral discs (IVDs) of lumbar spine during loading and recovery phases. For this purpose, a combination of static mechanical loading of the IVD using MR-compatible ergometer and continuous MRI-acquisition with a 3D-GRASP acquisition was used. Data was acquired on five healthy volunteers, and dynamic strains under loading and recovery conditions were calculated in 5-IVD segments from L1/L2 to L5/S1. By measuring temporal evolution of strain during rest, loading and recovery phases, dynamic strain information in the IVD may be investigated.
INTRODUCTION
Human intervertebral discs (IVD) consist of fibrocartilage pads that provide flexibility to the spine. Mechanical properties of the IVD are important because they are load bearing and are susceptible to a number of degenerative processes[1,2]. Measurement of 3D-dynamic internal IVD strains under loading and recovery schemes are challenging due to simultaneous tissue loading, MRI-data acquisition, and the need for high spatial and temporal resolution. The goal of this study was to develop a technique to quantify internal dynamic strains in the IVDs using a combination of static mechanical loading of the lumbar spine using an MRI-compatible ergometer, and using a continuous 3D,golden angle radial sparse parallel (GRASP)[3] based MR acquisition.METHODS
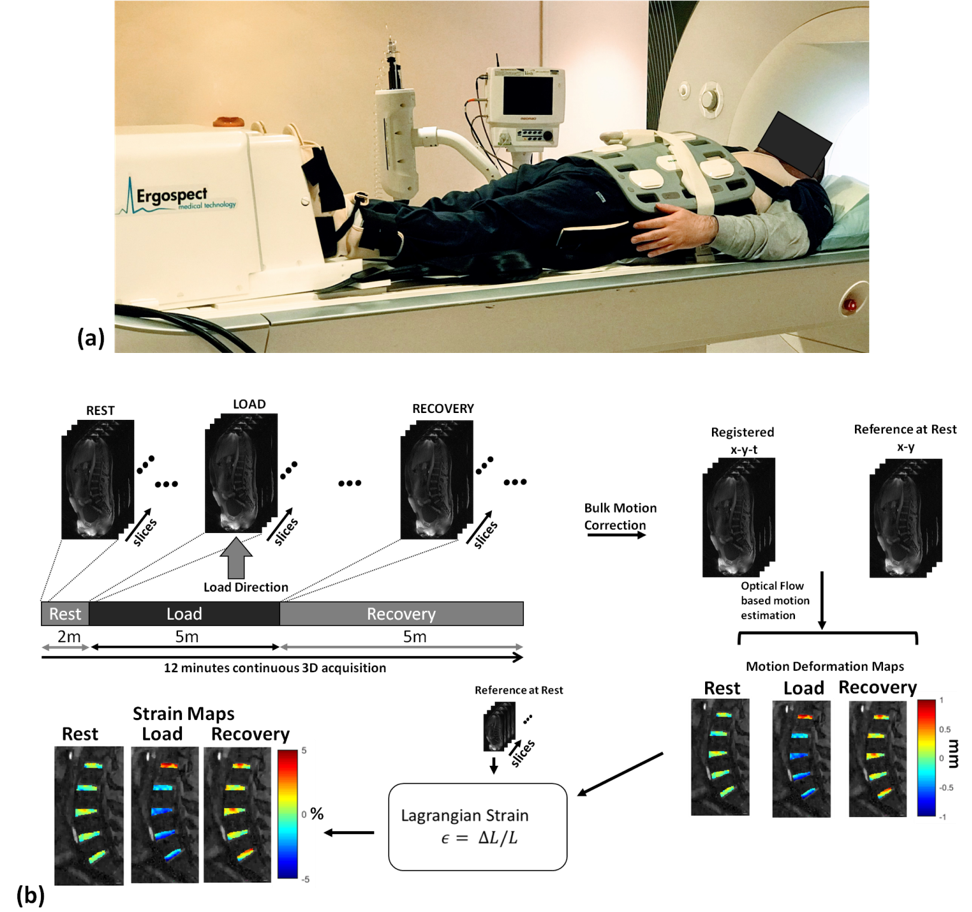
In this study, strain was measured by static mechanical loading of the lumbar spine. Loading of the spine was achieved using an MRI-compatible ergometer (Ergospect, Innsbruck, Austria)(figure 1(a)). The experiment followed a rest-loading-recovery paradigm with continuous MR-scanning done during rest (2 min), loading (5 min) and recovery (5 min). A total force of 400 N was applied to each subject (~50% body weight). Five volunteers (4 male, 1 female, 30±5 years) underwent the lumbar loading MRI, following informed consent. All imaging was done on 3T-MRI scanner (Prisma, Siemens Healthcare, Germany). The imaging sequence consisted of a continuous acquisition using a 3D golden angle stack-of-stars trajectory that acquires in-plane radial spokes (Kx-Ky), and Cartesian sampling in the through-plane dimension. The MR imaging parameters were: repetition time (TR)=5ms, echo time(TE)=2.5ms, flip angle=12⁰, field of view (FOV)=250x250mm2, slab thickness=80mm, matrix size=256x256x40, voxel resolution=0.98x0.98x2mm3, in-plane orientation was along the sagittal direction, receiver bandwidth=590Hz/pixel, radial spokes=3000 spokes. The total scan time was 12 minutes.Image post-processing (Fig.2) was done in MATLAB (MathWorks, Natick, MA). Raw data from the scanner was used for offline reconstruction. Coil sensitivity maps were calculated using the central k-space data using ESPIRiT[4]. The continuously acquired radial spokes were regrouped to form a sparse dataset consisting of 250 spokes per time frame giving a temporal resolution of one 3D dataset/minute. The iterative GRASP reconstruction was formulated as:
$$\widehat{\mathbf{x}} = \arg\min_\mathbf{x} ||\mathbf{y}- \mathbf{SFCx}||_2^2+λ ||\mathbf{Tx}||_1$$
where $$$\widehat{\mathbf{x}}$$$ represents the reconstructed image, $$$\mathbf{y}$$$is the captured k-data, $$$\mathbf{S}$$$ is the sampling pattern of the data, $$$\mathbf{F}$$$ is the Fourier transform, and $$$\mathbf{C}$$$ represents the coil sensitivity. The regularization parameter is $$$λ$$$and for the sparsifying transform $$$\mathbf{T}$$$, spatio-temporal finite differences (STFD) with spatial and temporal order set to 1 was used. Monotone fast iterative shrinkage threshold algorithm with variable acceleration (MFISTA-VA)[5] was used for cost-function minimization.
Following CS reconstruction, bulk motion occurring from transition to loading and recovery conditions were corrected using translation based rigid body motion correction using the first image as reference (Fig.1b). An optical flow tracking algorithm[6] was used to determine the sub-voxel shifts in the IVD segments as a result of loading and recovery. The optical flow algorithm estimates voxel image intensity based velocity fields under the assumption that gray level intensities are preserved during displacement, and any other variation is attributable to motion. Five regions of interest (ROIs) were manually segmented (L1/L2, L2/L3, L3/L4, L4/L5, L5/S1) in the lumbar spine and 3D-motion deformation between each time-point and the reference frame were estimated. The Lagrangian strain (SL)[7] for each ROI was calculated from the deformation fields and the reference:
$$S_x=dL/L_0 $$
where dL is the change in length from deformation, and $$$L_0$$$ is the reference length.
RESULTS
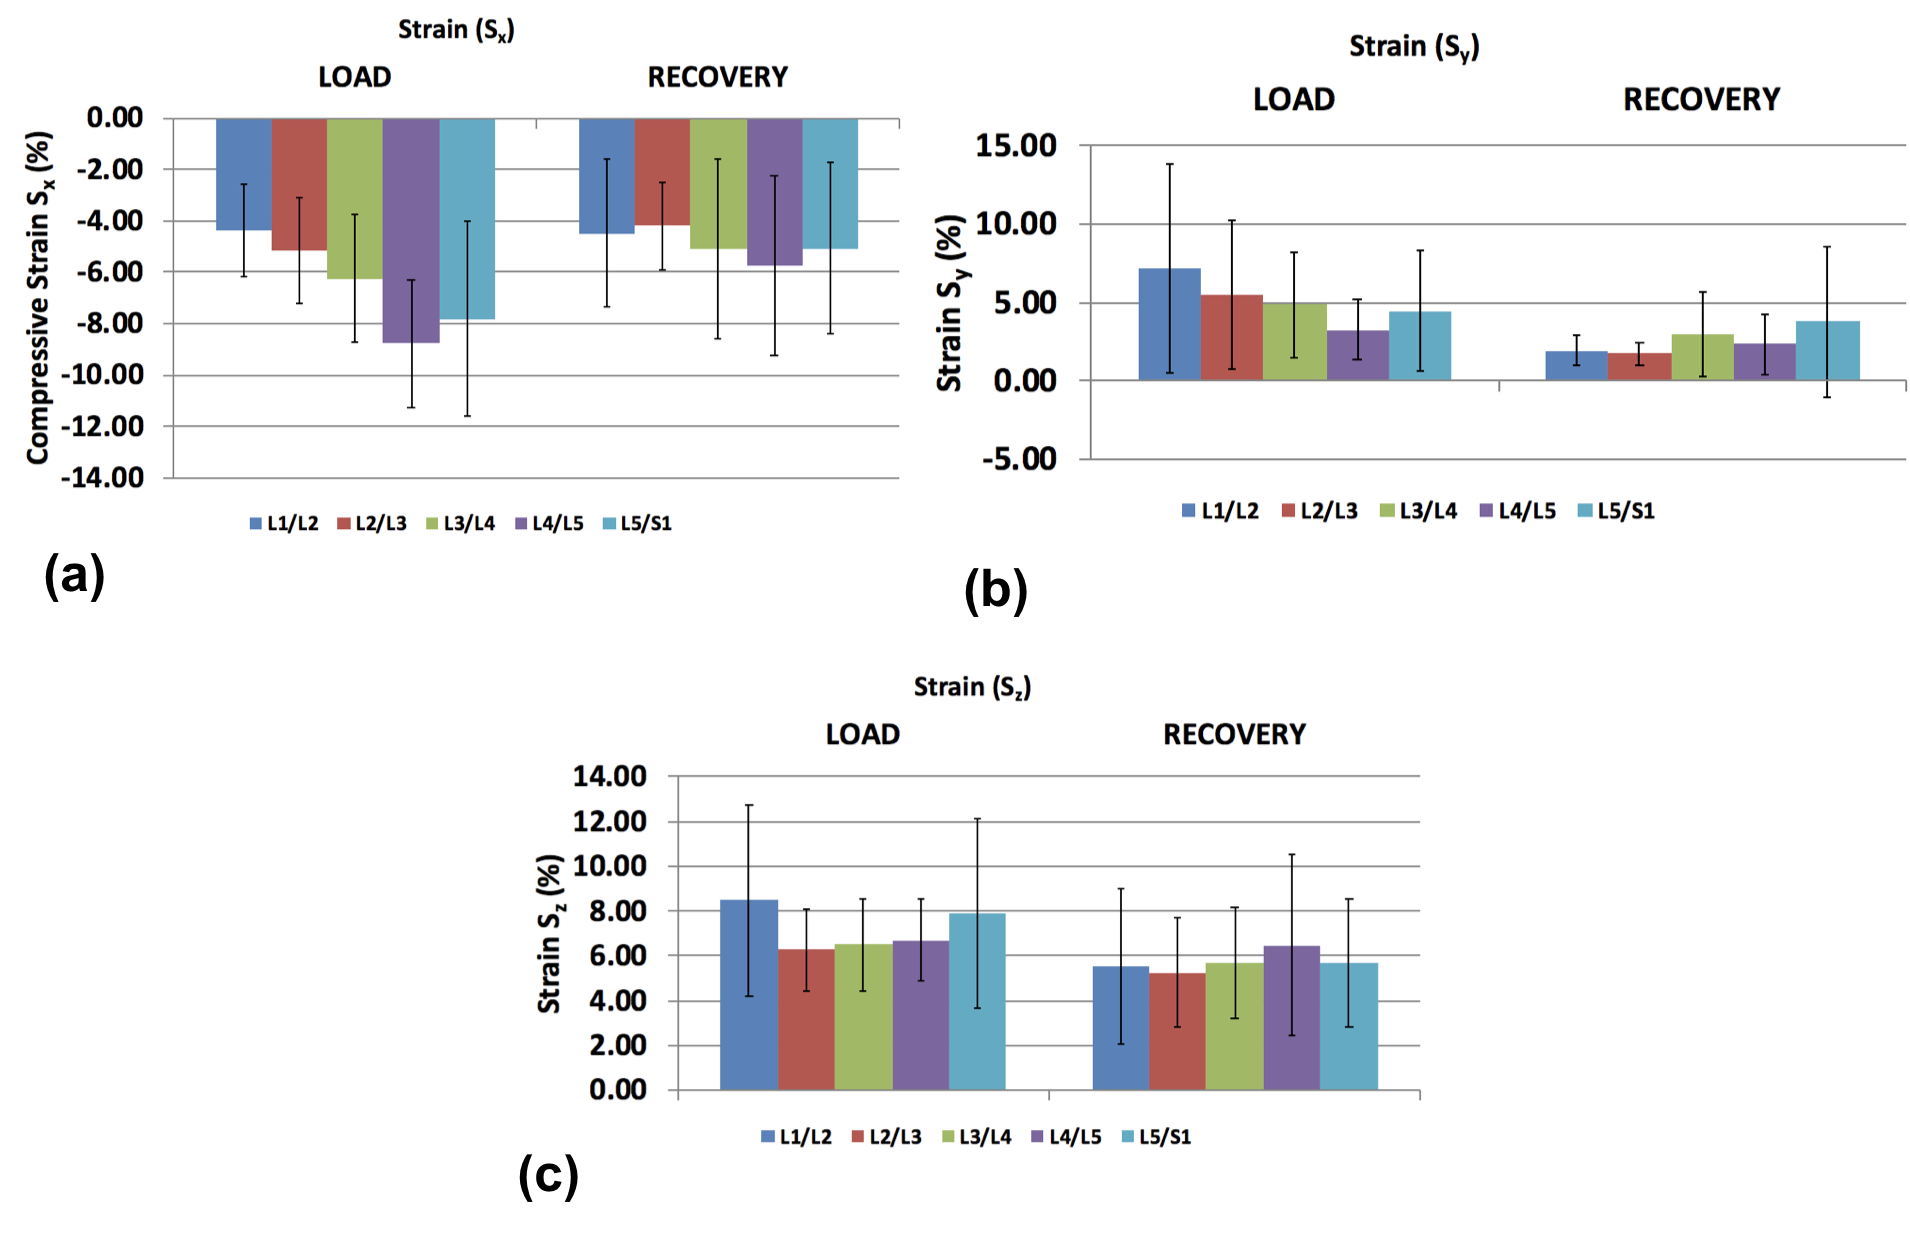
Figures 3(a) and 3(b) shows the locations of the ROIs and anatomical reference, respectively. Figure 3(c) and 3(d) shows the motion deformation maps (dx, dy, dz), and strain maps (Sx, Sy, Sz) along the three directions during rest, mechanical loading, and recovery. In the loading direction (X) during static mechanical loading and during recovery, the L4/L5 segment shows the maximum variation due to compressive strain from the loading condition. During the loading condition, the range of mean minimum strain to mean maximum strain was -8.78±2.49% to 6.79±2.85%. During recovery condition, the range of mean minimum strain to mean maximum strain was -5.73±3.5% to 3.59±2.11% (Figure 4a). Along the Y-direction, the maximum variation of strain is seen in the L1/L2 segment. During the loading condition, the range of mean minimum strain to mean maximum strain was -3.44±1.88% to 7.22±6.63%. During the recovery condition, the range of mean minimum strain to mean maximum strain in L1/L2 segment was -2.75±2.15% to 1.95±0.99% (Figure 4b). Along the Z-direction, the maximum variation of strain is seen in the L1/L2 segment. During the loading condition, the range of mean minimum strain to mean maximum strain was -6.96±3.22% to 8.48±4.28%. During the recovery condition, the range of mean minimum strain to mean maximum strain in the L1/L2 segment was -5.22±2.8% to 5.54±3.45% (Figure 4c). Table 1 summarizes the strain values calculated across the five subjects.DISCUSSION AND CONCLUSION
In this study, we demonstrated the use of static mechanical loading with continuous GRASP MRI acquisition through rest, loading, and recovery conditions to measure 3D internal dynamic strains in the human IVD in-vivo in 12 minutes. This study shows that by measuring the temporal evolution of strain during rest, loading and recovery phases, dynamic strain information in the human spine IVD may be investigated.Acknowledgements
This study was supported by NIH grants R01 AR067156, and R01 AR068966, and was performed under the rubric of the Center of Advanced Imaging Innovation and Research (CAI2R), a NIBIB Biomedical Technology Resource Center (NIH P41 EB017183).References
[1] Adams, M.A. and P.J. Roughley, What is intervertebral disc degeneration, and what causes it?Spine (Phila Pa 1976), 2006. 31(18): p. 2151-61.
[2] Burr, D.B. and E.L. Radin, Microfractures and microcracks in subchondral bone: are they relevant to osteoarthrosis?Rheum Dis Clin North Am, 2003. 29(4): p. 675-85.
[3] Feng, L., et al., Golden-angle radial sparse parallel MRI: combination of compressed sensing, parallel imaging, and golden-angle radial sampling for fast and flexible dynamic volumetric MRI.Magn Reson Med, 2014. 72(3): p. 707-17.
[4] Uecker, M., et al.,ESPIRiT--an eigenvalue approach to autocalibrating parallel MRI: where SENSE meets GRAPPA.Magn Reson Med, 2014. 71(3): p. 990-1001.
[5] Zibetti, M.V.W., et al., Monotone FISTA with Variable Acceleration for Compressed Sensing Magnetic Resonance Imaging.IEEE Trans Comput Imaging, 2019. 5(1): p. 109-119.
[6] Zachiu, C., et al.,A framework for continuous target tracking during MR-guided high intensity focused ultrasound thermal ablations in the abdomen.J Ther Ultrasound, 2017. 5: p. 27
[7] Chitiboi T, Axel L.Magnetic resonance imaging of myocardial strain: A review of current approaches. J Magn Reson Imaging 2017;46(5):1263-1280.
Figures