1154
To the point: deep learning on dense T2 point clouds for improved feature extraction1Radiology and Biomedical Imaging, University of California, San Francisco, San Francisco, CA, United States, 2University of California, San Francisco, San Francisco, CA, United States
Synopsis
To-the-point (TTP) is a novel approach for analyzing compositional MR imaging data. By representing tibial and femoral cartilage T2 values as a dense point cloud, our approach can leverage the data's inherent sparsity while maintaining local geometric properties, leading to improved feature extraction and faster image processing times. Experiments on the whole OAI T2 dataset show strong performance in an OA diagnosis task 82.44% sens, 82.59% spec, with extracted features even identifying patients who would become diagnosed with OA 1 to 2 years in the future.
Introduction
Compositional MR sequences, such as T1ρ and T2 mapping, have been widely investigated for their potential to identify early degenerative changes in musculoskeletal tissues. Although promising, the power of these studies is limited by ineffective feature representation and computationally intensive image processing. Handcrafted features, such as global or region-of-interest averaging, laminar analysis, and texture analysis are limited in their expressive capabilities. This work, to-the-point (TTP), proposes a fast, deep learning based approach for analysis of compositional MR data. By representing cartilage T2 maps as dense point clouds instead of a voxel grid or mesh, TTP can preserve the sparsity inherent in the tissue while leveraging its local geometric information. TTP’s rich feature extraction capabilities are demonstrated using 22481 images from the Osteoarthritis Initiative dataset, where the method achieves a test-time sensitivity of 82.44% and specificity of 82.59% in a binary OA diagnosis task.Methods
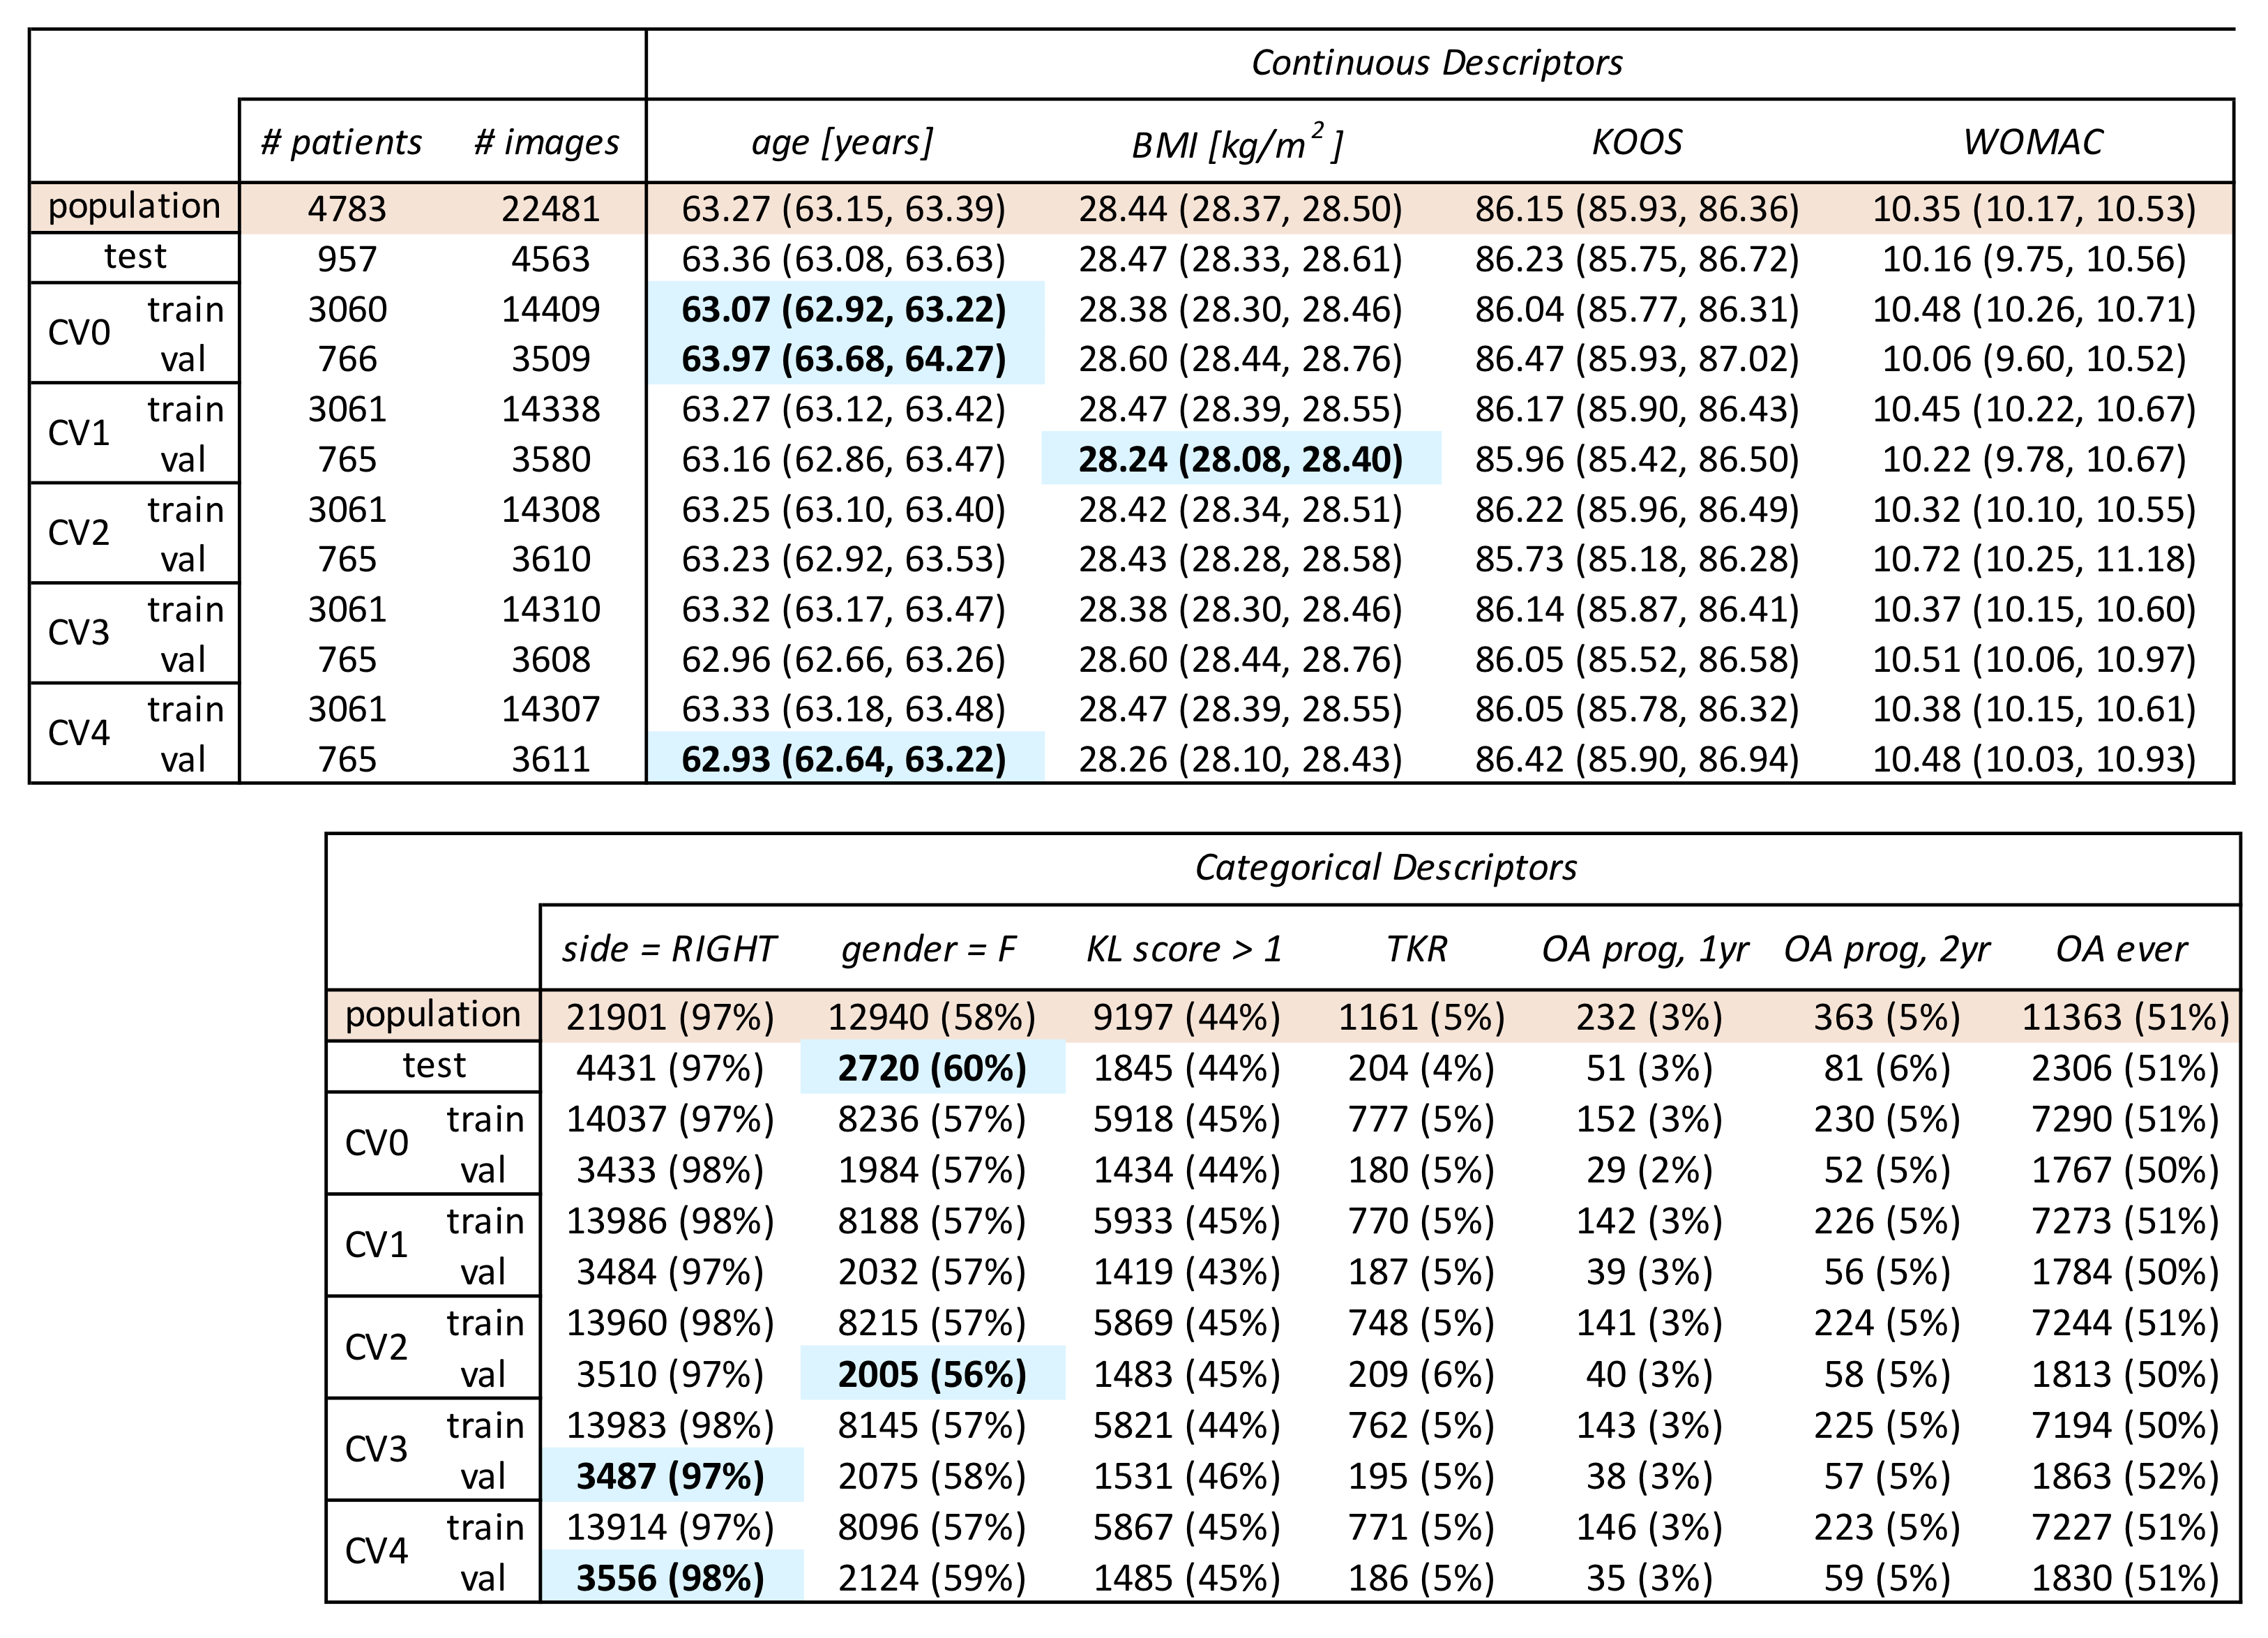
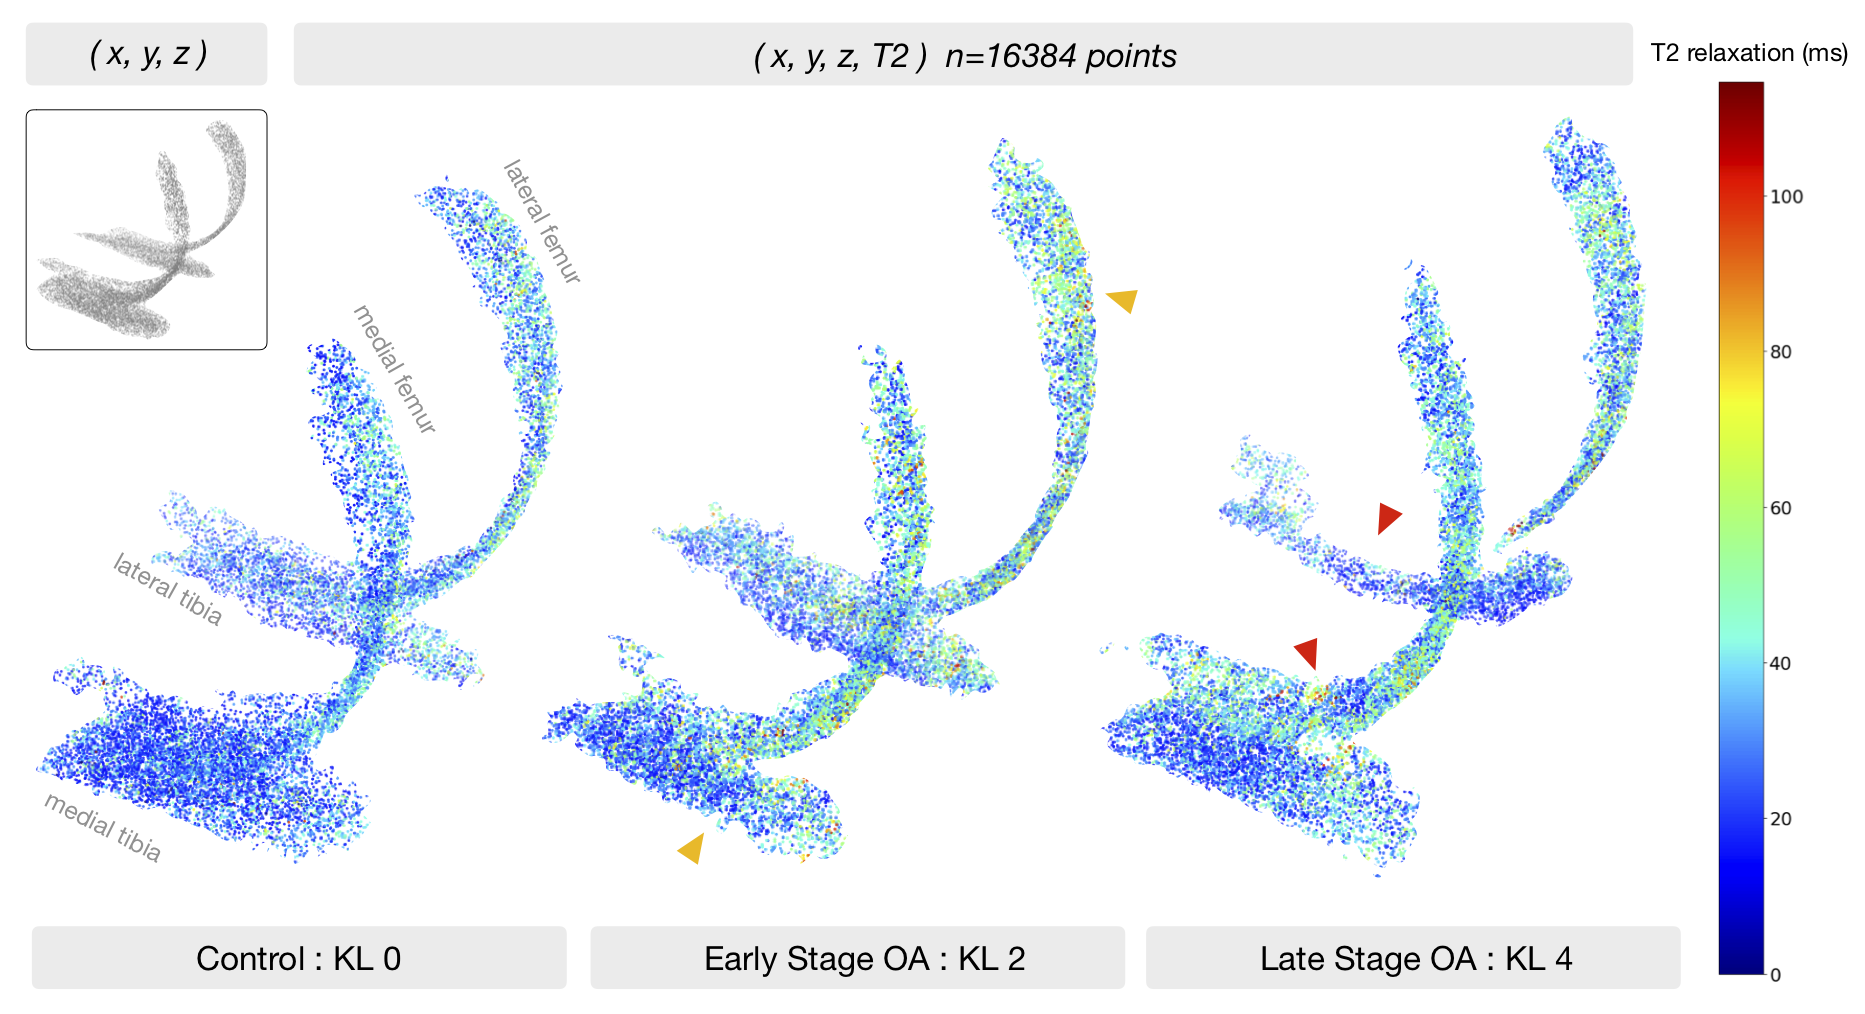
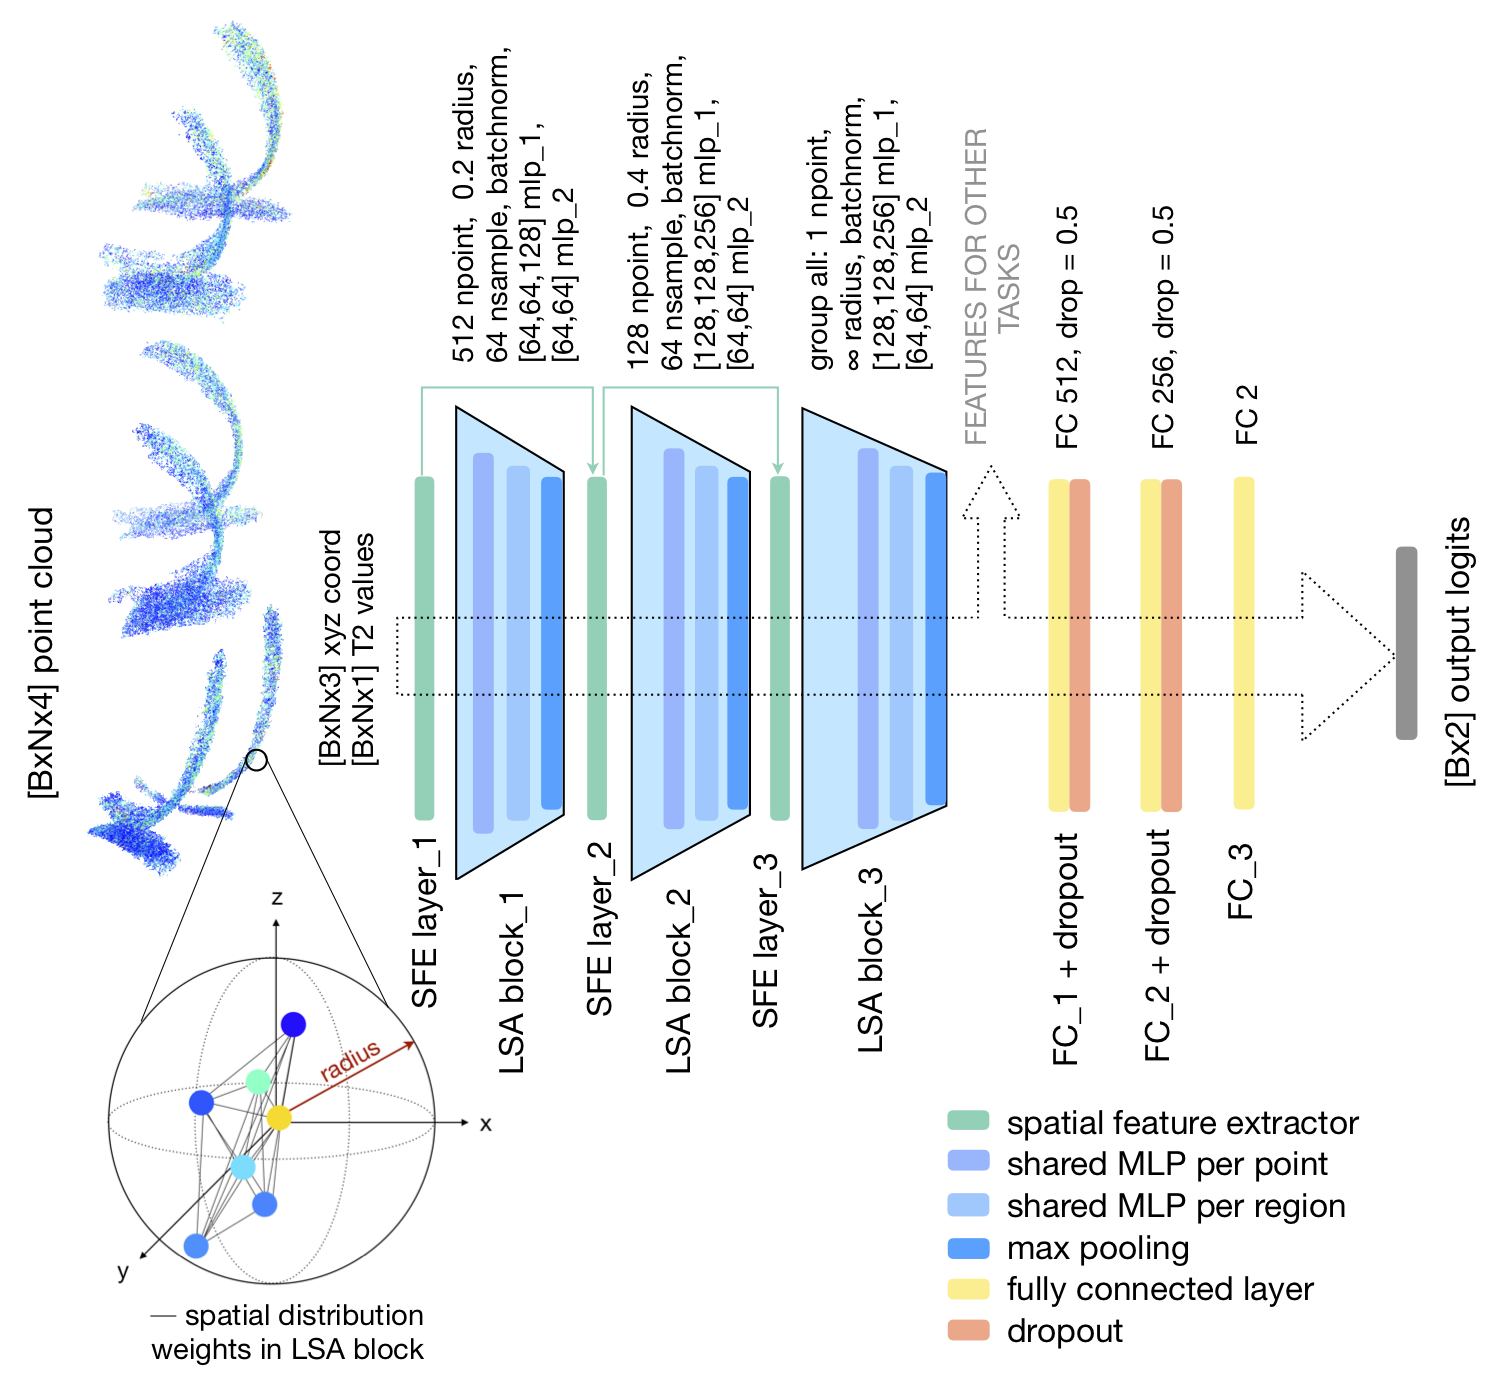
The Osteoarthritis Initiative (OAI) dataset includes 25729 T2 maps acquired on 3T Siemens Trio scanners using a 2D multi-slice multi-echo (MSME) sequence1 (0.313x0.446mm in-plane resolution, 3mm slice thickness, 10/20/30/40/50/60/70ms TE, 2700ms TR). For a recent study, a V-Net2 neural network was trained on 3921 knee MR images to segment 5 cartilage compartments (lateral femur, medial femur, lateral tibia, medial tibia, and patella). Segmentations were inferred for all the OAI T2 dataset, after which voxel-wise exponential fitting was performed to calculate T2 relaxation values3.The OAI T2 dataset is described in Figure1. Splits for point cloud experiments were performed by patient and stratified by demographics and outcomes. Positive OA diagnosis is defined as a radiographic Kellgren-Lawrence (KL) score of 2+, negative diagnosis <2. The femoral and tibial cartilage compartments are represented by a non-ordered collection of 16384 randomly sampled, non-integer points within the segmentation mask (point-to-voxel ratio roughly 1.6), where each point encodes its Cartesian coordinates (x,y,z) and T2 relaxation time (ms), as shown in Figure2. Each point cloud is zero centered and scaled to its 90th percentile distance, T2 values divided by 100. Creation of single point cloud takes less than 1.5s on IntelCore i7 6700K CPU, making it significantly faster than other parametrization methods. Processed points are fed into a PointNet++4-like architecture (neural network that performs point convolutions) with Local Spatial Aware layers which encode local geometric relationships between points, as described in 5 and shown in Figure3. The network was implemented in Tensorflow1.8, trained for 65 epochs (NVIDIA V100 32GB GPU) using cross entropy with label smoothing=0.3, random point dropout, batch size=20, learning rate=0.0015, and Adam optimizer. Logits averaging is used to ensemble the 5 model predictions.
Results
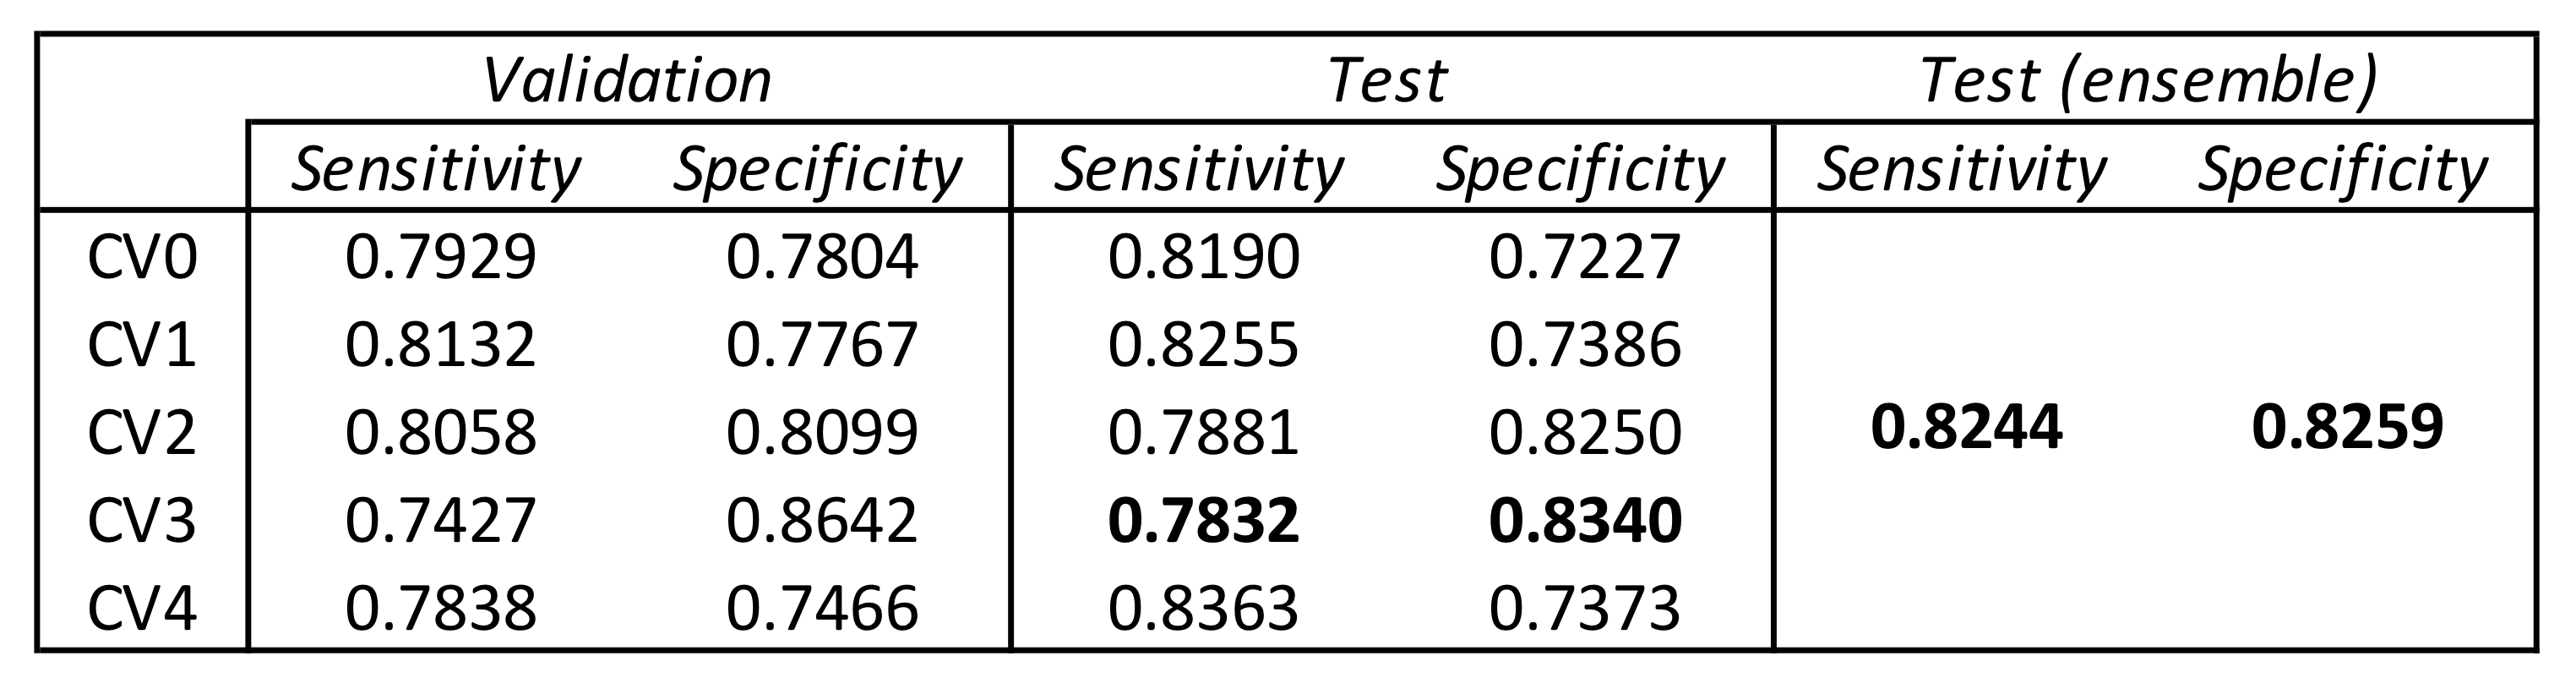
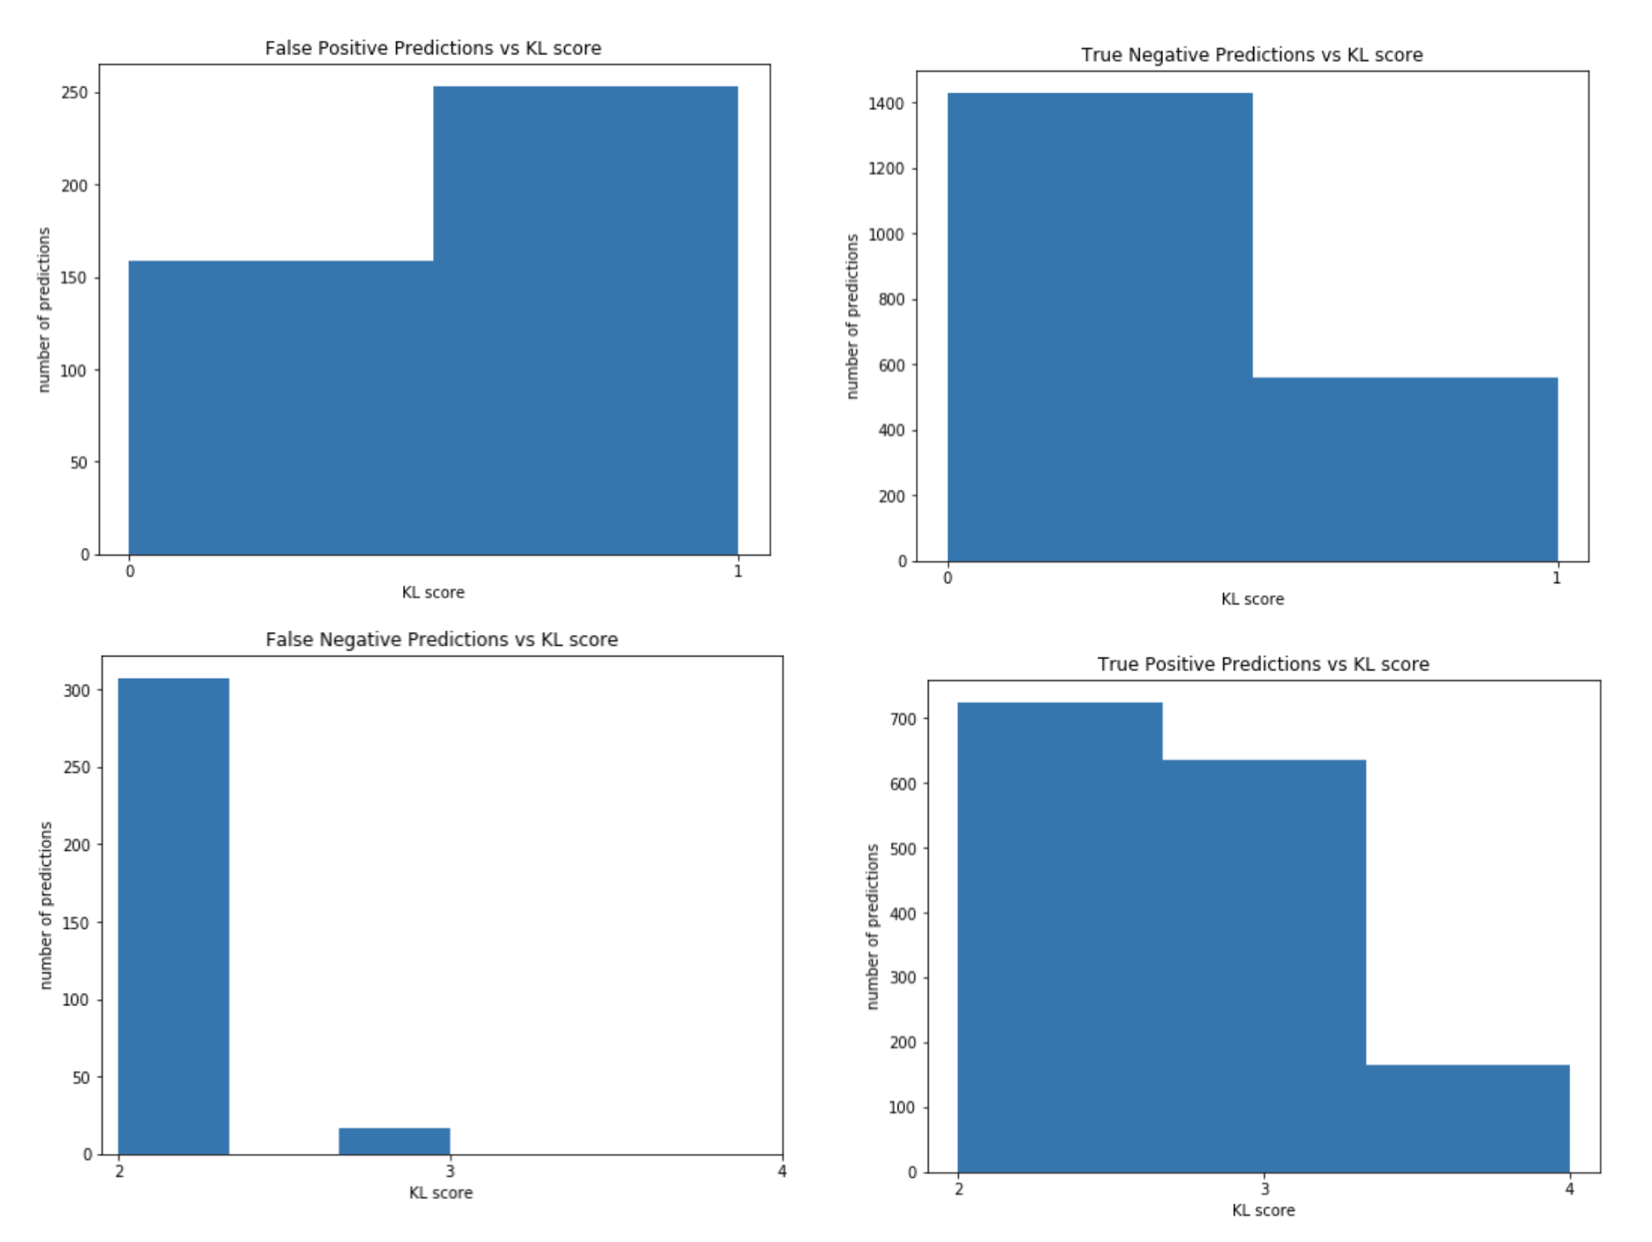
Performance on a binary OA diagnosis task reported in Figure4. Network sensitivity on the test set was consistently higher than validation sensitivity, and specificity vice versa across all models except CV2. The 5-model ensemble had the highest balanced performance. Errors from the ensemble model are shown by non-binarized KL score in Figure5. 94.7% of FN were KL 2, 5.3% KL3; FP were 1.5x more likely to be KL 1 than 0. Among the FP group, 9.3% would progress into OA within 1 year, 13.3% within 2 years, higher than the average control group (3.2% 1yr, 5.6% 2yr). This indicates that TTP might be learning T2 patterns characteristic of early OA, well before radiographic changes.Discussion
A recent study by Pedoia et al. [6] performed a similar OAI T2 diagnosis task (on the baseline OAI dataset) and achieved a sensitivity and specificity of 74.53%, 76.13% by using atlas-based registration, flattening tibial and femoral cartilage T2 maps, and training a DenseNet convolutional neural network using grid search for hyper-parameter tuning. TTP shows significant improvement of 7.91%, 6.46% in sensitivity, specificity over the previous deep-learning based study, while also benefitting from faster processing and a flexible framework that would easily extend to other tissues. There are several advantages to the proposed method. (1) TTP leverages the power of deep learning while overcoming the inefficient representations of such: avoiding the N3 complexity of working within a voxel grid, the N2 complexity of mesh methods which are limited to describing the surface of an object, and the artifacts introduced with 2D projection methods. (2) The dense point cloud is a raw representation of T2 values without requiring ROI placement, averaging or pooling operations. TTP can be sensitive to both global changes in T2, as well as patient specific hotspots. (3) Dense point clouds are permutation invariant and able to extract meaningful features without the need for registration, facilitating the clinical translation of these methods. As a potential limitation, it is possible that the dense point cloud is simultaneously encoding cartilage shape, thickness, and femorotibial alignment, which provides a more comprehensive examination of the joint yet makes it difficult to isolate the contribution of T2.Conclusion
Dense point clouds are a simple yet effective tissue parametrization for improved feature extraction through deep learning. Possible extensions to this work include examining point-wise importance of T2 values on OA diagnosis predictions using occlusion methods, particularly in the OA progression subpopulation. Nonetheless, this method could quickly scale to other tissues such as bones, menisci, ligaments using a combination of dense and hollow point clouds for a multi-structural whole-joint diagnosis.Acknowledgements
Funding sources:
R01AR069006 R00AR070902 R61AR073552
References
1. Peterfy CG, Schneider E, Nevitt M. The osteoarthritis initiative: report on the design rationale for the magnetic resonance imaging protocol for the knee. Osteoarthr Cartil OARS Osteoarthr Res Soc. 2008;16(12):1433-1441. doi:10.1016/j.joca.2008.06.016
2. Milletari F, Navab N, Ahmadi S-A. V-Net: Fully Convolutional Neural Networks for Volumetric Medical Image Segmentation. June 2016. https://arxiv.org/abs/1606.04797.
3. [Abstract submitted to ISMRM 2020] Razmjoo, A.‘T2 Analysis of Entire Osteoarthritis Dataset (N=25729)’
4. Qi, Charles Ruizhongtai, et al. "Pointnet++: Deep hierarchical feature learning on point sets in a metric space." Advances in neural information processing systems. 2017.
5. Chen, Lin-Zhuo, et al. "LSANet: Feature Learning on Point Sets by Local Spatial Attention." arXiv preprint arXiv:1905.05442 (2019).
6. Pedoia, V., et al. "Diagnosing osteoarthritis from T2 maps using deep learning: an analysis of the entire Osteoarthritis Initiative baseline cohort." Osteoarthritis and cartilage 27.7 (2019): 1002-1010.
Figures