1152
Linking multi-joint biomechanics with cartilage composition from qMRI
Koren Roach1, Valentina Pedoia1, Jinhee J Lee1, Tijana Popovic1, Sharmila Majumdar1, and Richard B Souza1
1UCSF, San Francisco, CA, United States
1UCSF, San Francisco, CA, United States
Synopsis
Hip osteoarthritis is likely caused by changes in gait biomechanics and cartilage biochemistry and composition. In this study, we employed multivariate functional principal component analysis to identify gait waveform characteristics that were related to T1ρ and T2 relaxation times in the femoral and acetabular cartilage. Our results indicated that transverse and sagittal plane waveform characteristics are significantly related to T1ρ and T2 relaxation times in the femoral and acetabular cartilage and may be key planes of motion on which to focus preventative therapies for hip osteoarthritis.
Introduction
Arthritis is the primary cause of disability in the US,1 with hip osteoarthritis (OA) reported to afflict up to 27% of US adults over the age of 45.2 It is clinically hypothesized that gait characteristics, cartilage biochemistry, and demographics have complex interactions that act as risk factors for hip OA.3, 4 Gait studies are often limited to evaluations of joint biomechanics at singular time points (i.e., peak hip flexion angle), thereby disregarding substantial amounts of data. Although biomechanics can be associated with radiographic or symptomatic signs of hip OA, these are often semi-quantitative evaluations of hip cartilage health. Magnetic resonance (MR) T1ρ and T2 relaxation times may provide the means to quantitatively detect degradation of cartilage earlier than traditional OA radiographic scoring systems.5 Studies have found that biochemical changes in articular cartilage coincide with or precede the development of OA.6 Specifically, higher T1ρ and T2 relaxation times correspond to decreased proteoglycan content and increased water content and matrix disorganization, respectively.7, 8 In this study, we used a data-driven approach to identify key waveform features of multi-joint lower limb kinematics that were associated with quantitative measures of cartilage degeneration.Methods
Seventy-two subjects (41 female; age: 51.4 ± 14.9 years; BMI: 24.3 ± 3.3 kg/m2) were selected from an on-going longitudinal study that will assess changes in cartilage biochemical composition and biomechanics in individuals with varying degrees of hip OA. Of the 144 hips used for this study, 32, 58, 31, and 23 hips had Kellgren-Lawrence (KL) grades 0, 1, 2, and 3, respectively. All subjects signed informed consent as approved by the Committee of Human Research at our institution. Bilateral hip images were acquired on a 3T MR scanner (GE Healthcare, Waukesha, WI) using a 32-channel coil (GE Healthcare). A combined T1ρ and T2 sequence (Table 1) was used to quantitatively assess the cartilage matrix. Acetabular and femoral cartilage were automatically segmented using a single atlas-based approach.9 Voxel-based relaxometry was used to evaluate T1ρ and T2 relaxation times in the femoral and acetabular cartilage.10 Skin-marker trajectory data was acquired at 250 Hz with a 10-camera near-infrared system (Vicon, Oxford Metrics LTD., Oxford, UK) as subjects walked overground at 1.35 m/s. Trajectory data was filtered with a fourth order, zero lag, low-pass Butterworth filter at 6 Hz and used to calculate hip, knee, and ankle angles in the sagittal, coronal, and transverse planes (Visual3D, C-Motion, Germantown, MD, US). Hip, knee and ankle joint angles were combined to create a multivariate functional data object in each plane. The multivariate functional data objects were used for three MFPCAs, one for each plane. Each MFPCA identified 10 MFPC modes of variation for a total of 30 MFPC modes (R Development Core Team, v3.3.3).11 A step-wise linear regression model related MFPC modes and demographic features to T1ρ and T2 relaxation times. A screeplot was used to determine the optimal number of MFPC modes to include in the regression model.11 Results were reported as (estimate; p value).Results
The first five sagittal and transverse and first four coronal MFPCs were used for regression modeling, which accounted for at least 89% of variance in each plane. Transverse plane MFPCs 3 (-0.02; p=0.02) and 5 (0.03; p<0.05) and BMI (0.40; p<0.001) were significantly related to T1ρ relaxation times in the femoral cartilage (Table 2A). Transverse MFPC 3 was primarily characterized by vertical shifts in hip and ankle internal/external rotation (Figure 1A). Transverse MFPC 5 was primarily characterized by differences in slope direction at midstance (Figure 1B). Transverse plane MFPC 2 (0.03; p=0.01) and BMI (0.50; p<0.001) were significantly related to T2 relaxation times in the femoral cartilage (Table 2B). Transverse MFPC 2 was primarily characterized by vertical shifts in knee internal/external rotation (Figure 2). Sagittal plane MFPC 1 (0.01; p=0.01) and BMI (0.51; p<0.001) were significantly related to T1ρ relaxation times in the acetabular cartilage (Table 2C). Sagittal plane MFPC 1 was primarily characterized by vertical shifts in hip flexion/extension, along with vertical shifts in knee and ankle flexion/extension during midstance (Figure 3). BMI (0.053; p<0.001) was significantly related to T2 relaxation times in the acetabular cartilage (Table 2D).Disscussion
This study established a data-driven framework to assess relationships between multi-joint biomechanics and quantitative assessments of cartilage biochemical composition and health. Increased T1ρ and T2 relaxation times in the femoral cartilage were related to increased hip and ankle rotation and increased knee rotation, respectively. Increased T1ρ relaxation times in the acetabular cartilage were related to increased hip, knee, and ankle extension. Increased hip and knee extension during stance may cause higher loading on the anterior region of the acetabulum, which could result in the depletion of proteoglycans in the acetabulum.Conclusion
This work emphasizes the usefulness of MFPCA to study gait in healthy and early-to-moderate hip OA participants and demonstrates how combined multi-joint biomechanics can be related to quantitative measures of cartilage health. The outcomes of this work also provide credit to the ability of MFPCA to reduce the dimensionality of continuous temporal data and could prove a useful feature extraction technique for machine learning and predictive models for hip OA.Acknowledgements
The authors gratefully acknowledge the assistance of Carla Kinnunen and funding from National Institutes of Health: K24 AR072133, R01 AR069006, R00AR070902.References
- C. f. D. Control and U. Prevention, MMWR: Morbidity and mortality weekly report, 2009, 58(16), 421-426.2.
- J. M. Jordan, C. G. Helmick, J. B. Renner, G. Luta, A. D. Dragomir, J. Woodard, F. Fang, T. A. Schwartz, A. E. Nelson, L. M. Abbate, L. F. Callahan, W. D. Kalsbeek, and M. C. Hochberg, J Rheumatol, 2009, 36(4), 809-815.3.
- E. L. Radin, D. B. Burr, B. Caterson, D. Fyhrie, T. D. Brown, and R. D. Boyd, Seminars in Arthritis and Rheumatism, 1991, 21(3 Suppl 2), 12-21.4.
- H. M. Frost, Anatomical Record, 1994, 240(1), 19-31.5.
- J. H. Kellgren and J. S. Lawrence, Annals of the Rheumatic Diseases, 1957, 16(4), 494-502.6.
- V. Pedoia, C. Russell, A. Randolph, X. Li, S. Majumdar, and A.-A. Consortium, Quant Imaging Med Surg, 2016, 6(6), 623-633.7.
- U. Duvvuri, R. Reddy, S. D. Patel, J. H. Kaufman, J. B. Kneeland, and J. S. Leigh, Magnetic Resonance in Medicine, 1997, 38(6), 863-867.8.
- M. T. Nieminen, J. Rieppo, J. Toyras, J. M. Hakumaki, J. Silvennoinen, M. M. Hyttinen, H. J. Helminen, and J. S. Jurvelin, Magn Reson Med, 2001, 46(3), 487-493.9.
- V. Pedoia, X. Li, F. Su, N. Calixto, and S. Majumdar, J Magn Reson Imaging, 2016, 43(4), 970-980.10.
- V. Pedoia, M. C. Gallo, R. B. Souza, and S. Majumdar, J Magn Reson Imaging, 2017, 45(5), 1523-1533.11.
- C. Happ and S. Greven, Journal of the American Statistical Association, 2018, 113(522), 649-659.
Figures

Figure 1: Mean angles plus or minus three standard deviations of transverse principal component (PC) 3 (A) and 5 (B) variation, which were significantly related to femoral cartilage T1ρ relaxation times. Representative participants with high (orange lines) and low (cyan lines) T1ρ relaxation times (top panels) and their corresponding T1ρ maps with arrows to indicate regions of high (left) and low (right) relaxation times in the femoral cartilage (bottom panels). Internal rotation was positive.
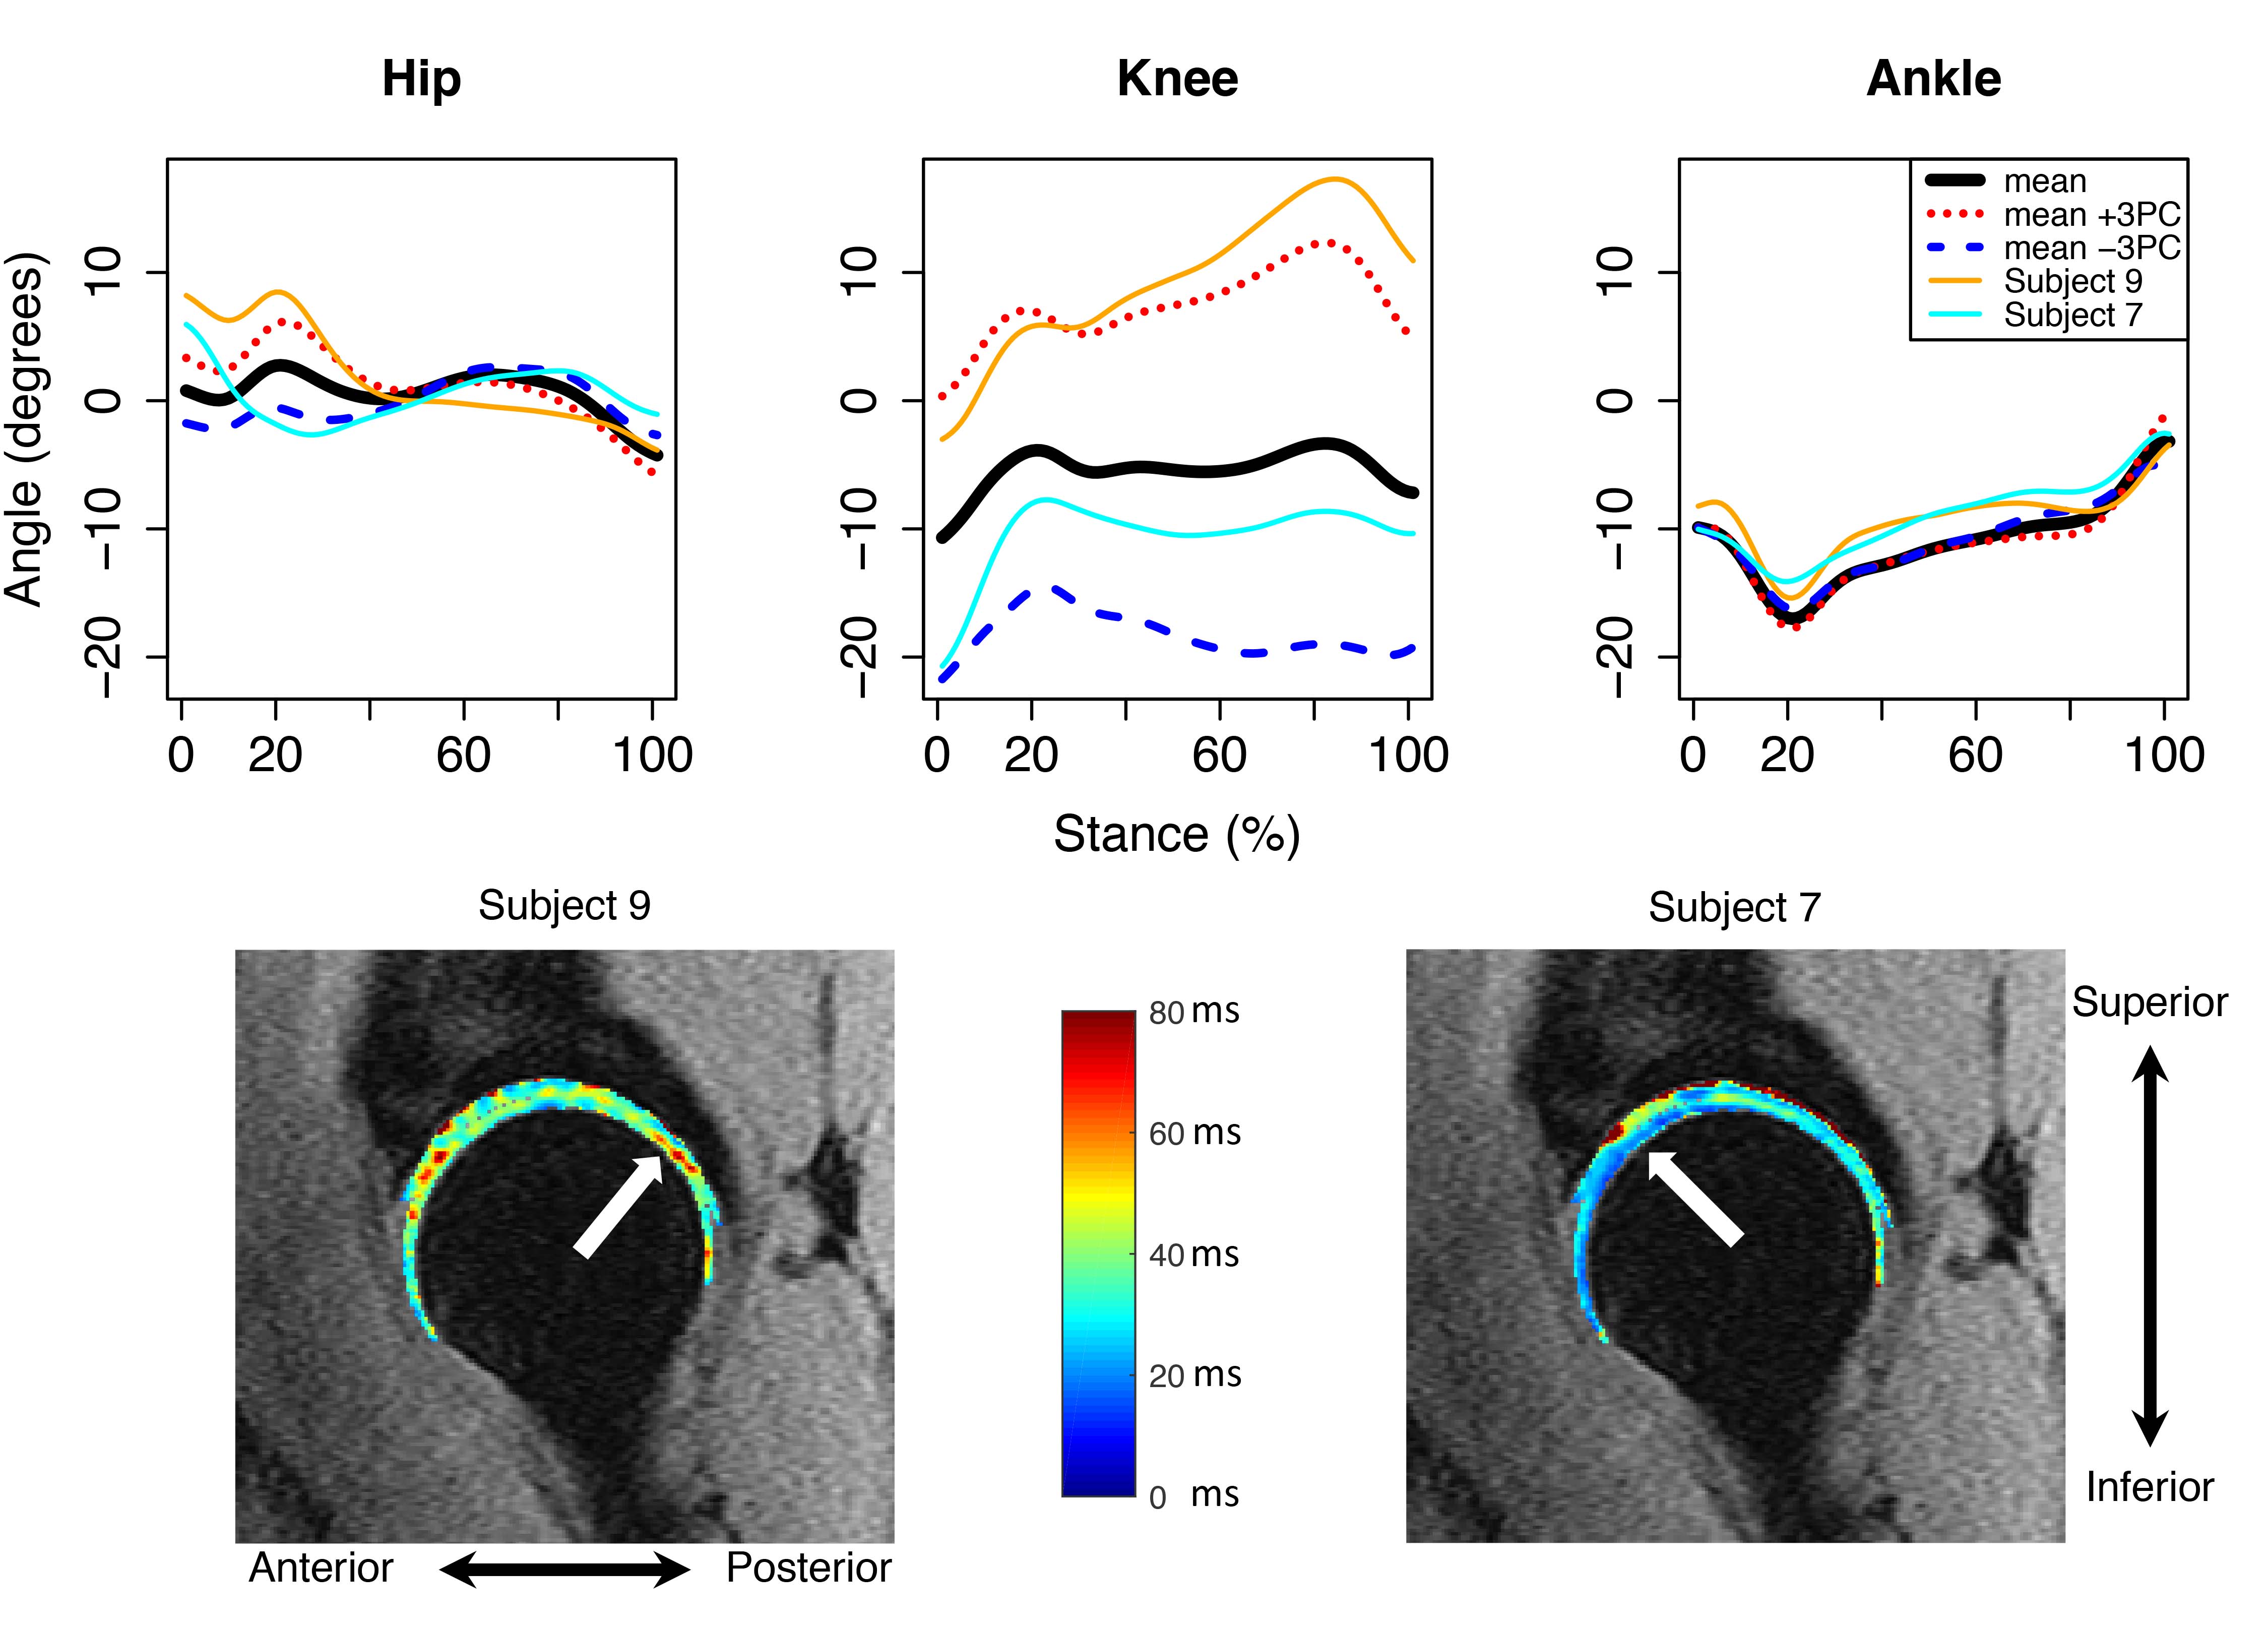
Figure 2: Mean angles plus or minus three standard deviations of transverse principal component (PC) 2 variation (top), which was significantly positively related to femoral cartilage T2 relaxation times. Representative participants with high (orange lines) and low (cyan lines) femoral T2 relaxation times (top) and their corresponding T2 maps (bottom) with arrows to indicate regions of high (left) and low (right) relaxation times. Internal rotation was positive.

Figure 3: Mean angles plus or minus three standard deviations of sagittal principal component (PC) 1 variation (top), which was significantly positively related to acetabular T1ρ relaxation times. Representative participants with high (orange lines) and low (cyan lines) acetabular T1ρ relaxation times (top) and their corresponding T1ρ maps (bottom) with arrows to indicate regions of high (left) and low (right) relaxation times. Flexion was positive.
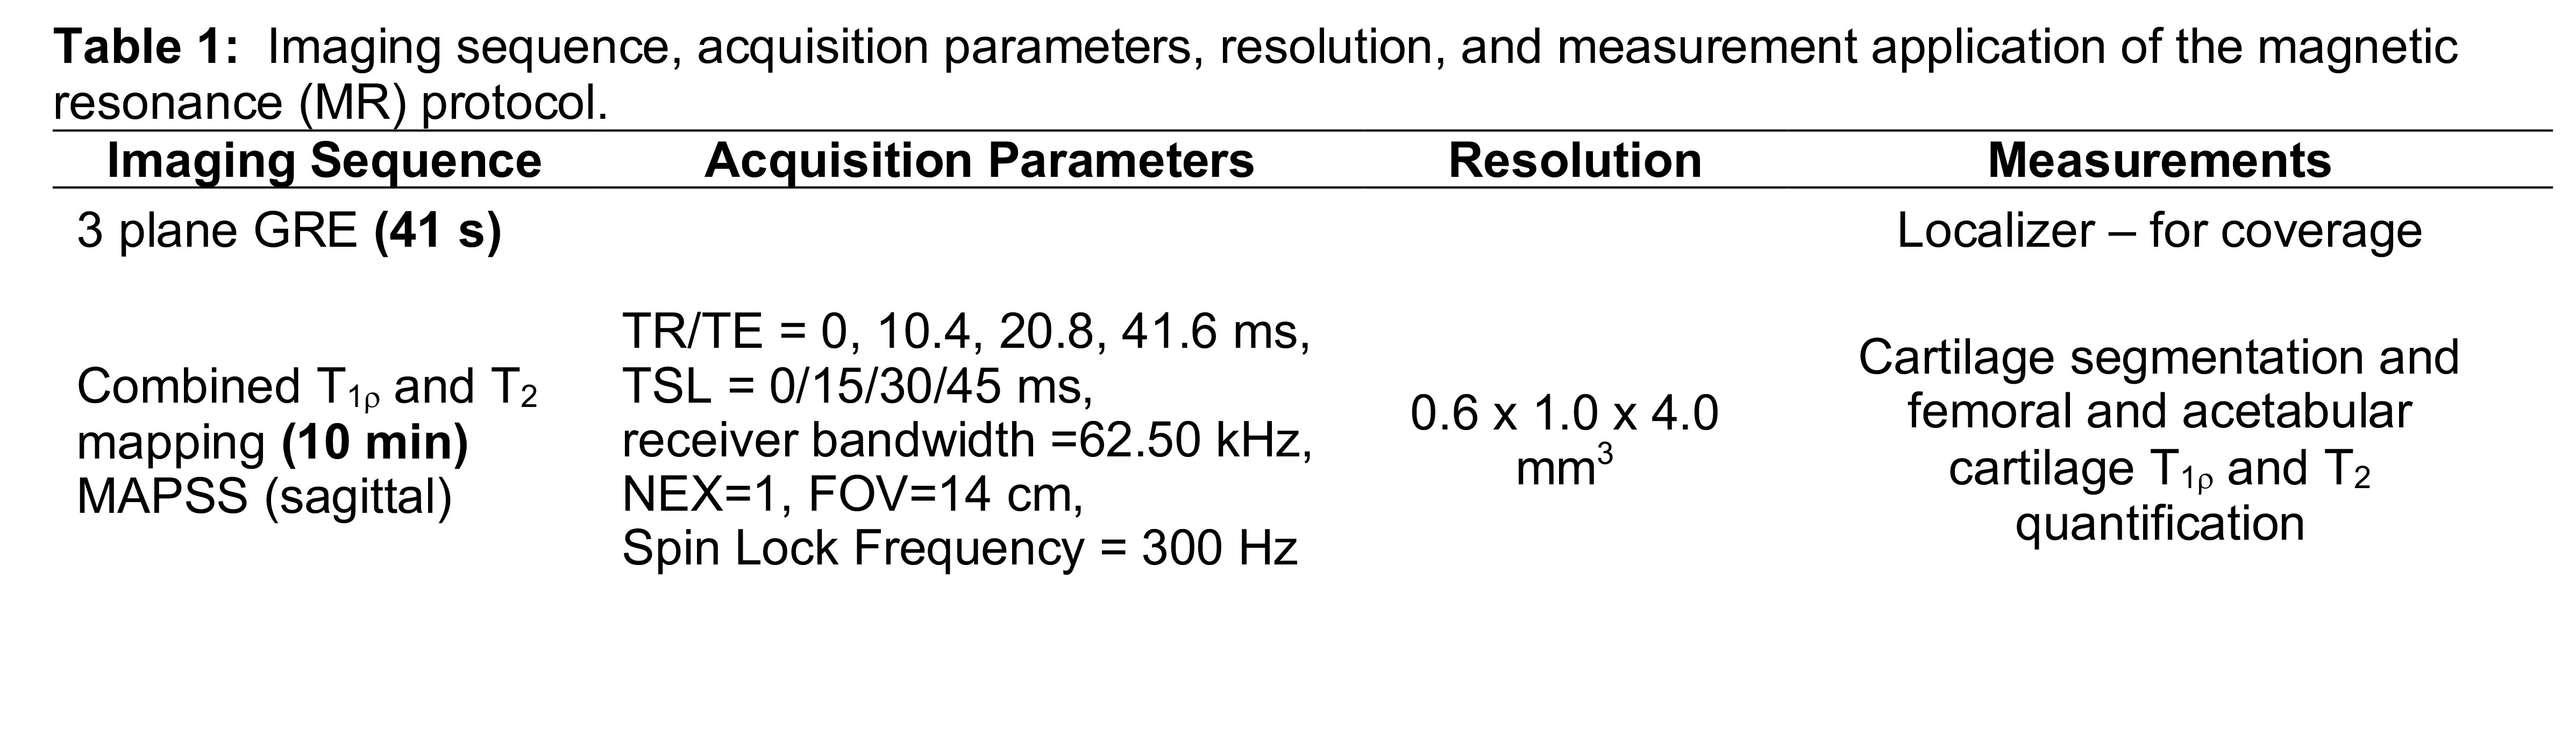
Table 1: Imaging sequence, acquisition parameters, resolution, and measurement application of the magnetic resonance (MR) protocol.

Table 2: Stepwise linear regression model results. Predictor variables: sagittal (sag), coronal (cor), and transverse (tran) multivariate functional principle component (PC) modes, age, gender, and BMI. Dependent variables: femoral cartilage T1r (A), femoral cartilage T2 (B), acetabular cartilage T1ρ (C), and acetabular cartilage T2 (D) relaxation times. SE = standard error; tStat = t statistic; RMSE = root mean squared error.