1151
Imaging of Bone-Synovium Interactions Using Dynamic Contrast Enhanced MRI and 18F-Sodium Fluoride PET1Radiology, University of East Anglia, Norwich, United Kingdom, 2Radiology, University of Cambridge, Cambridge, United Kingdom, 3Radiology, Stanford University, Stanford, CA, United States, 4Stanford University, Stanford, CA, United States
Synopsis
Synovial inflammation is hypothesised to play a role in the development and progression of osteophytes in osteoarthritis (OA).
Here we use hybrid 3T PET-MRI to perform simultaneous bilateral knee MR imaging of 11 participants (22 knees) with knee OA. We use 18F-NaF PET to quantify osteophyte metabolic activity and dynamic contrast enhanced MR imaging to quantify synovitis.
We demonstrate that synovitis adjacent to osteophytes is more intense (as quantified by the DCE parameter Ktrans) than the whole-joint average, and that there is a significant association between increased osteophyte metabolic activity (as quantified by PET SUVmax) and intensity of adjacent synovitis.
Introduction
In-vitro and animal studies of osteoarthritis (OA) suggest that synovitis plays a role in osteophyte development and progression via paracrine effects on the adjacent bone and periosteum1. Evidence of this phenomenon in humans would improve understanding of OA development and support the targeting of synovial inflammation to achieve disease modification. The objectives of this study were to use hybrid PET-MRI imaging to (1) determine whether synovitis adjacent to osteophytes is more intense than the whole-joint average and (2) assess the relationship between osteophyte metabolic activity and intensity of adjacent synovitis.Methods
Eleven participants/22 knees were included (age 54 ±12 years, body mass index 26.6 ±3.9 kg/m2, 7 female). Participants had a clinical diagnosis of OA in at least one knee. We performed simultaneous bilateral knee 3 Tesla PET-MR imaging (GE Signa PET-MR, GE Healthcare, Waukesha, WI) at a single timepoint using bilateral 16 channel flexible receive-only coils (Neocoil, Pewaukee, WI)2.PET imaging was performed following the administration of 2.5 mCi 18F-Sodium Fluoride (18F-NaF). Osteophyte metabolic activity was subsequently quantified using the maximum pixel standardised uptake value (SUVmax) value within a manually drawn osteophyte region of interest (ROI) defined by an experienced musculoskeletal radiologist. SUVmax values were obtained from PET images reconstructed from list-mode data following an uptake period of 45 minutes.
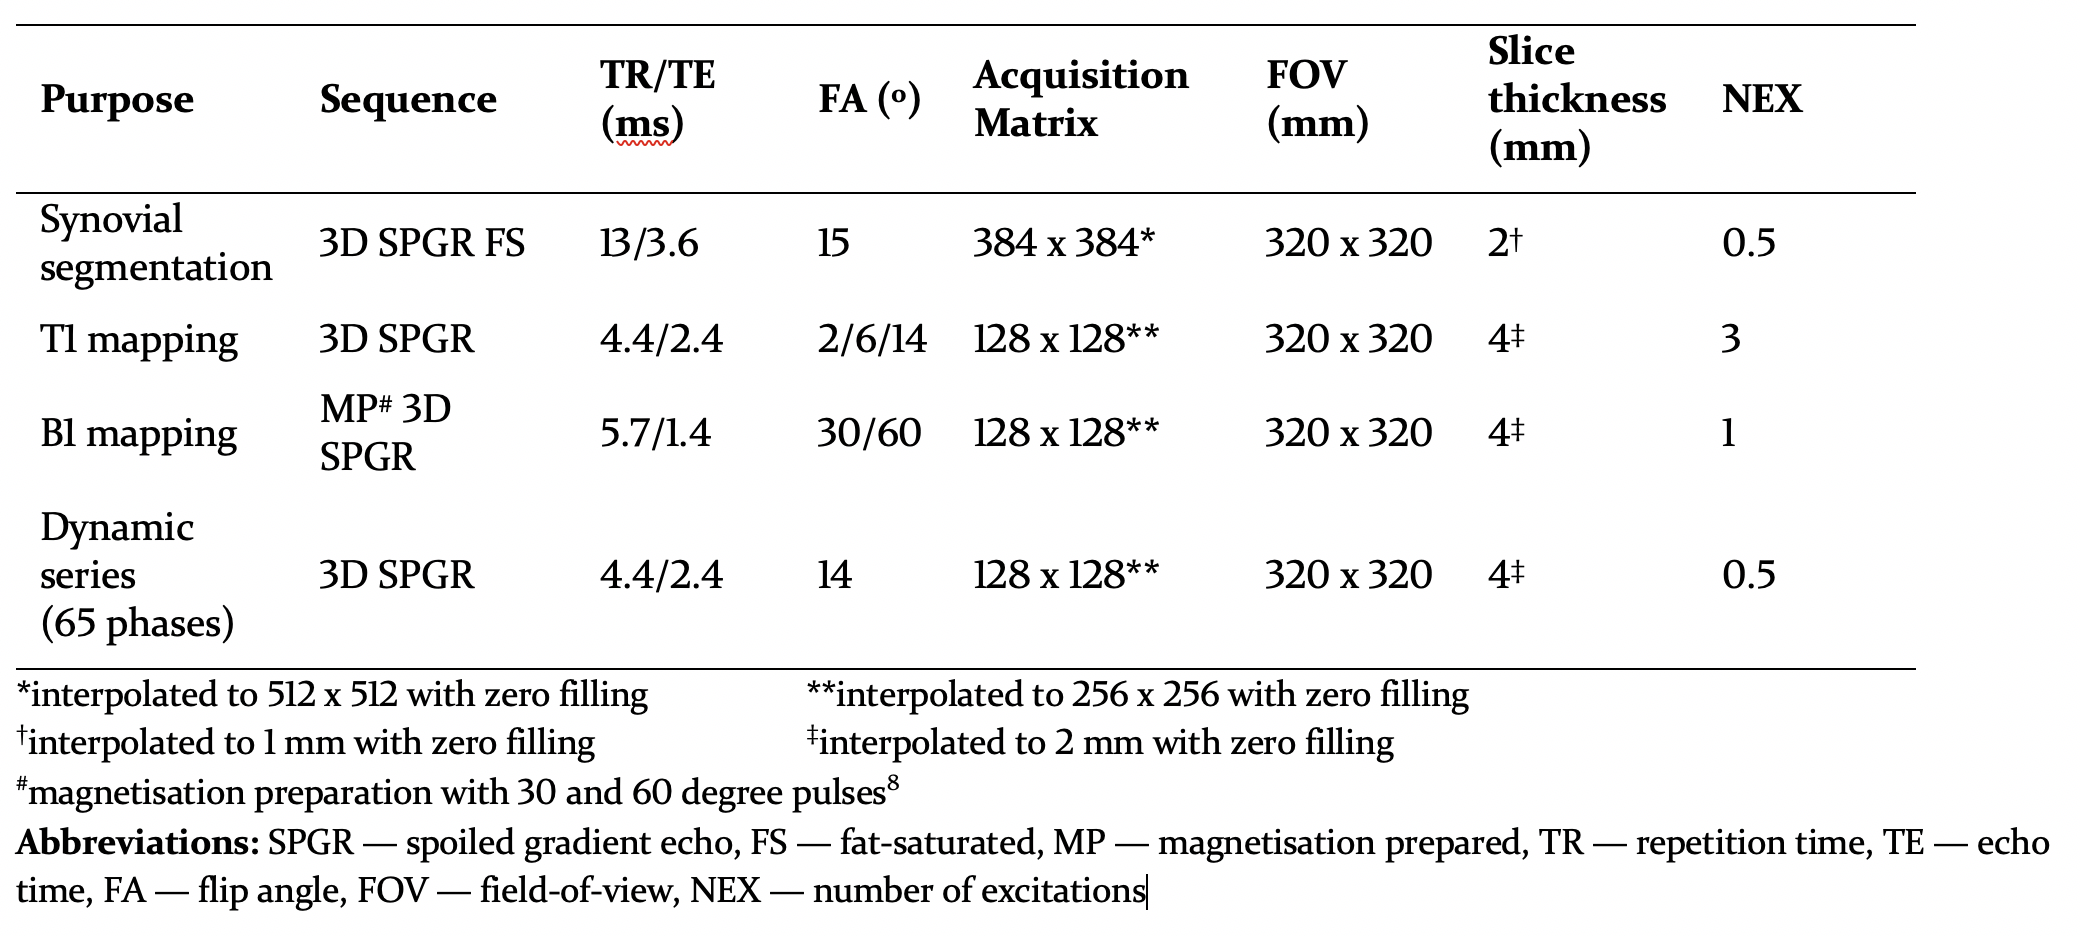
MR imaging included standard morphological sequences, pre-contrast T1 mapping and B1 mapping and dynamic contrast-enhanced (DCE) sequences. A total of 65 phases were used in the dynamic series with a temporal resolution of 11 seconds per phase. At the end of the 6th phase gadobutrol (Gadovist; Bayer, Leverkusen, Germany) was administered at a dose of 0.1 mmol/kg bodyweight and a rate of 3 mL/s followed by a saline chaser at the same rate. Pre and post contrast 3D fat-suppressed (FS) spoiled gradient echo (SPGR) sequences with identical acquisition parameters were performed for synovial segmentation. All relevant sequence parameters are provided in Table 1.
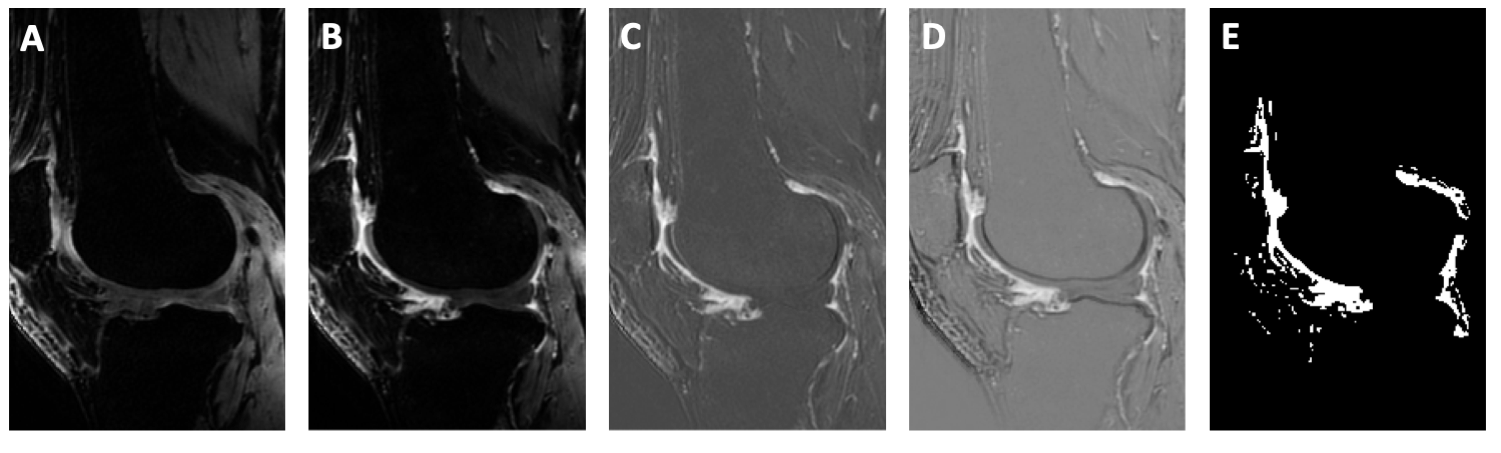
Osteophytes were identified by a musculoskeletal radiologist and graded according to the MRI Osteoarthritis Knee Score (MOAKS)3. Synovium was semi-automatically segmented via shuffle subtraction of the pre and post contrast 3D FS SPGR sequences (Figure 1)4. Regions of interest (ROIs) adjacent to each osteophyte were defined by the intersection of a manual ROI around the osteophyte drawn by a musculoskeletal radiologist and the semi-automatic synovial segmentation. Pharmacokinetic modelling of DCE data using the extended Tofts model yielded voxelwise maps of Ktrans, the volume transfer coefficient between the plasma and the extracellular extravascular space which quantifies intensity of inflammation5. A population arterial input function was used6.
For objective (1), we assessed whether the Ktrans ratio (KTR: ratio of median Ktrans adjacent to osteophyte: whole synovium median Ktrans) was significantly different to unity using a one-sample Wilcoxon rank-sum test. For objective (2), we assessed the association between osteophyte SUVmax and adjacent Ktrans using a linear mixed model adjusted for osteophyte MOAKS grade and within-participant clustering.
Results
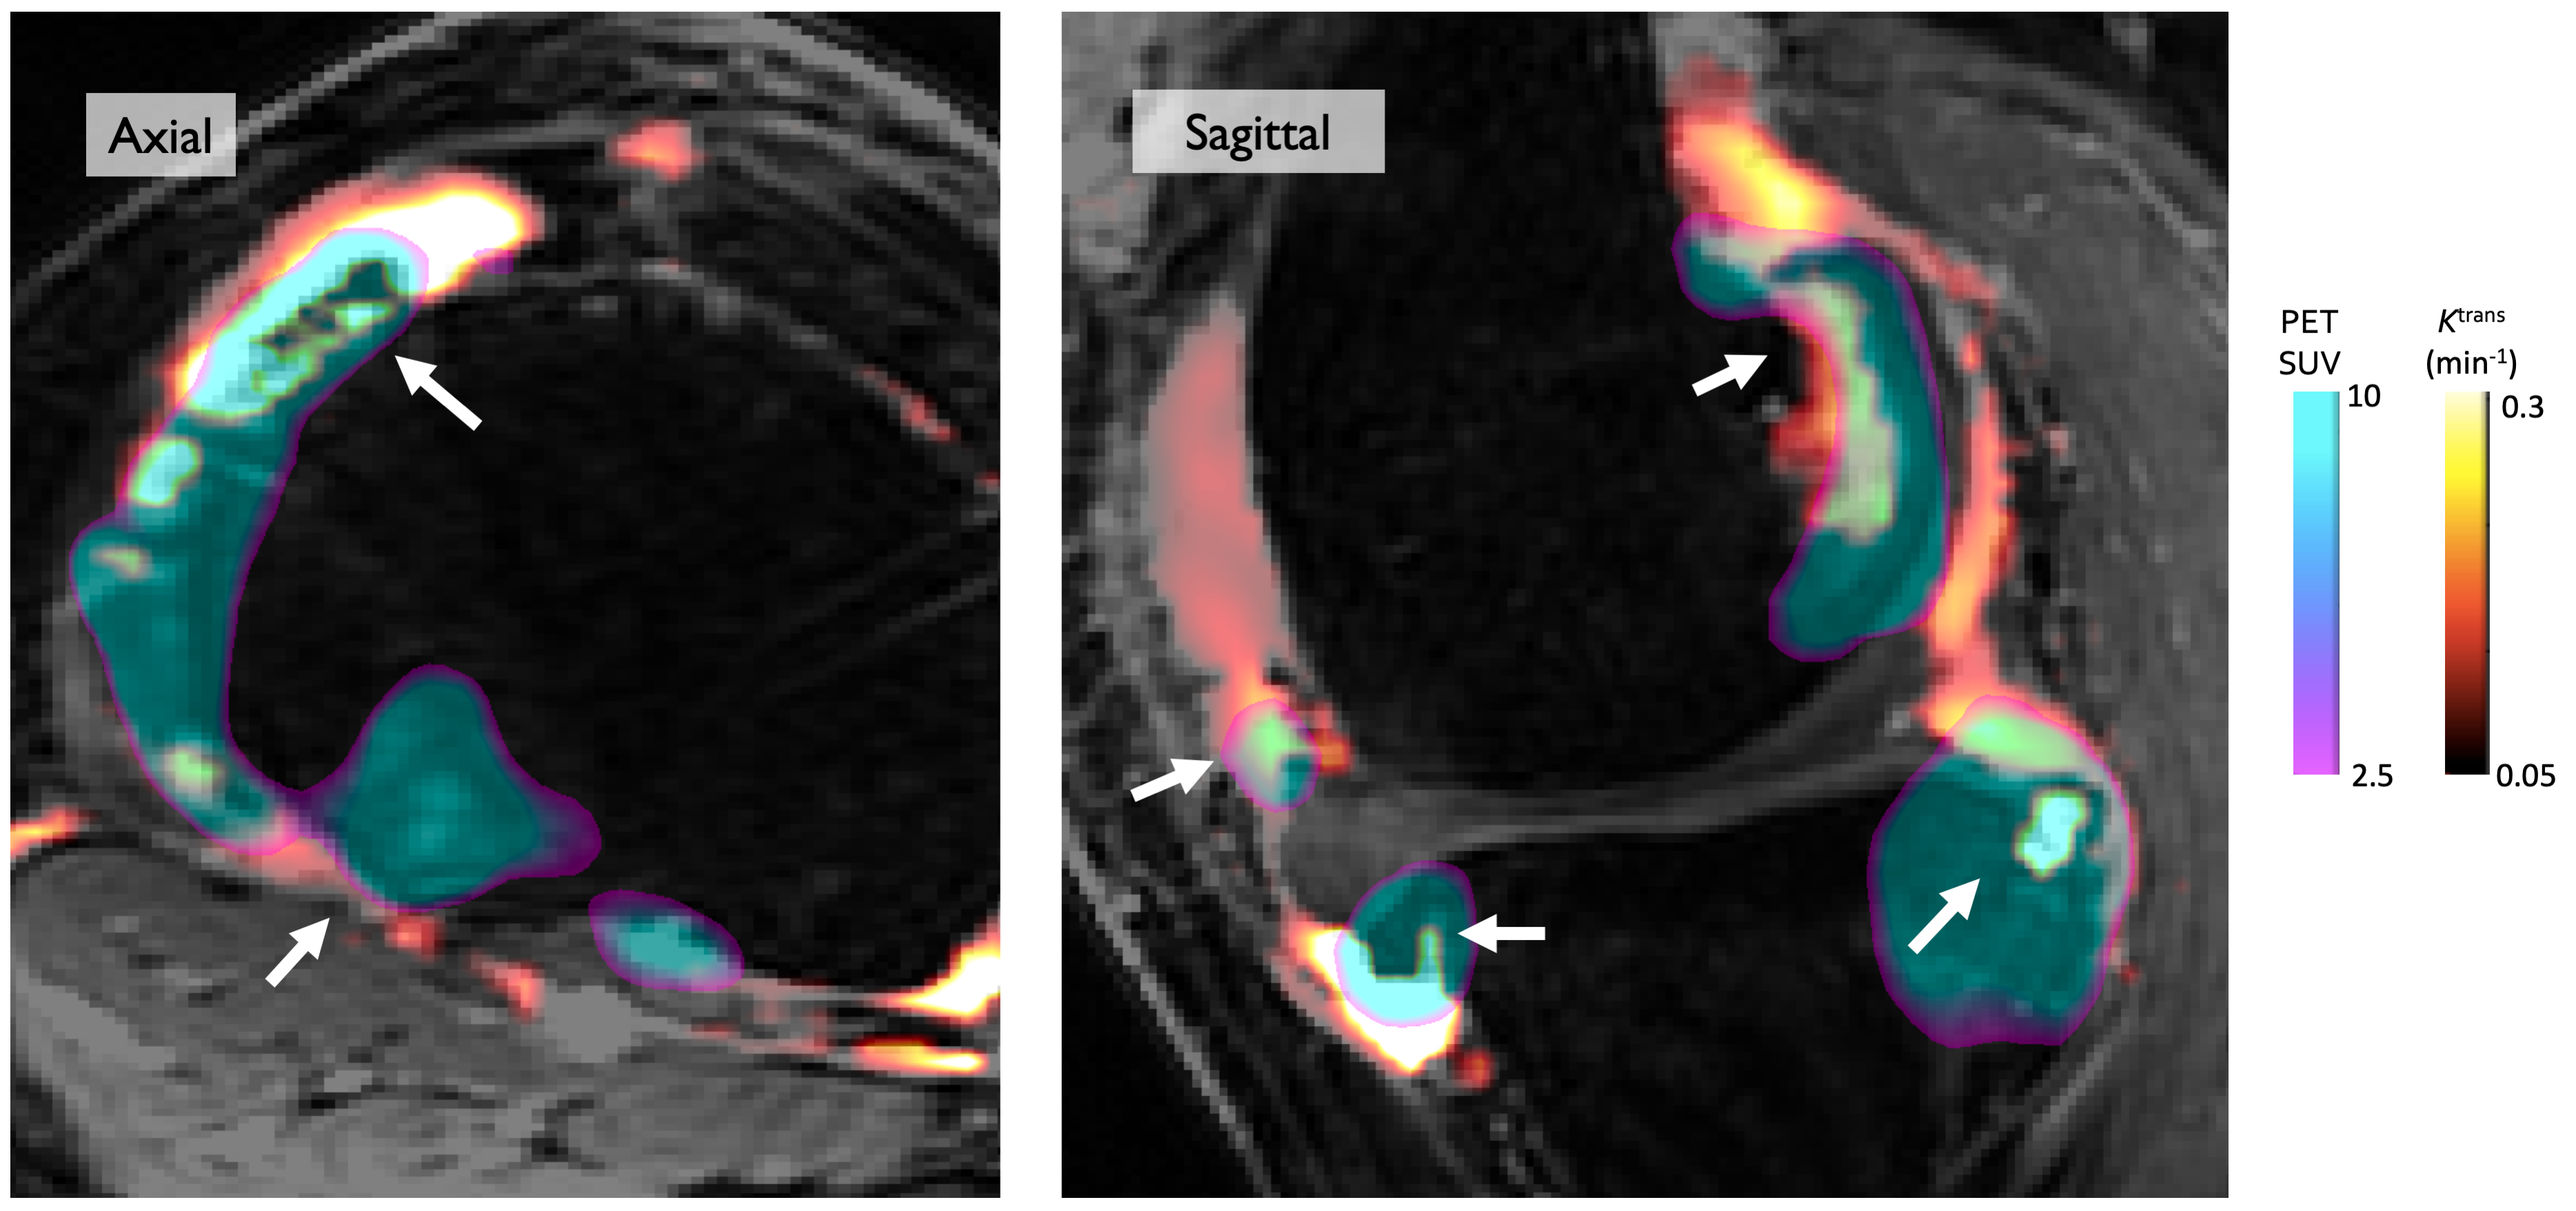
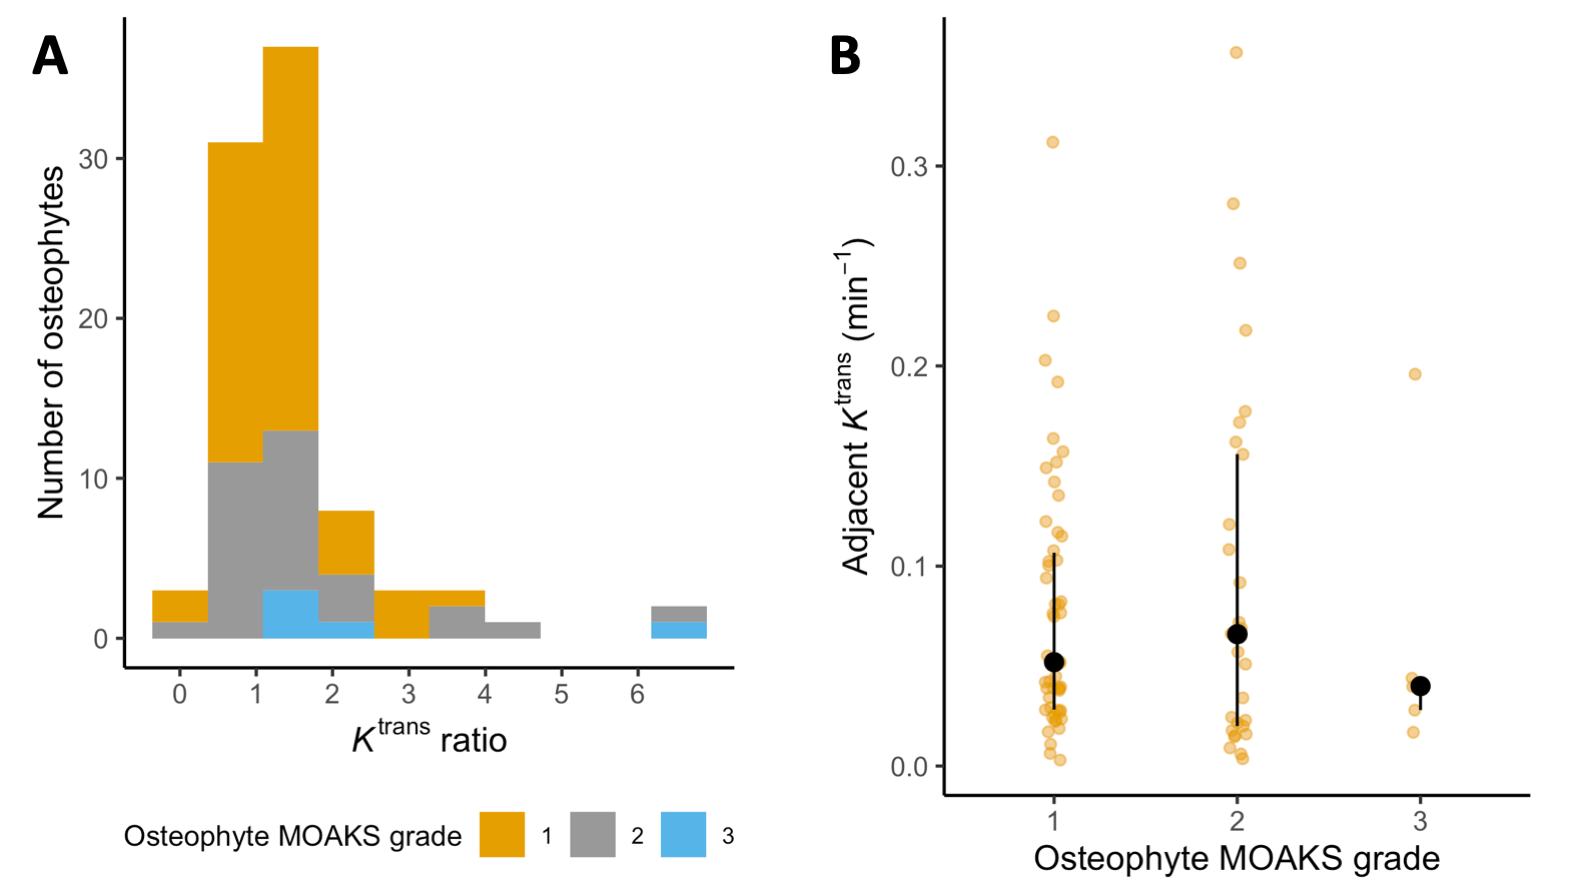
Representative MR images with overlaid SUV and Ktrans data are provided in Figure 2.A total of 88 osteophytes were detected in 22 knees (54 MOAKS grade 1 – small, 29 grade 2 – medium, 5 grade 3 – large). Fifty-seven (65%) of these demonstrated SUVmax values greater than 5x background metaphyseal bone SUVmax. Median KTR for all osteophytes was 1.26 (interquartile range 0.96 to 1.72, p < 0.001). The distribution of KTR values is provided in Figure 3A. Median Ktrans values and KTR adjacent to osteophytes were similar regardless of MOAKS grade (Figure 3B).
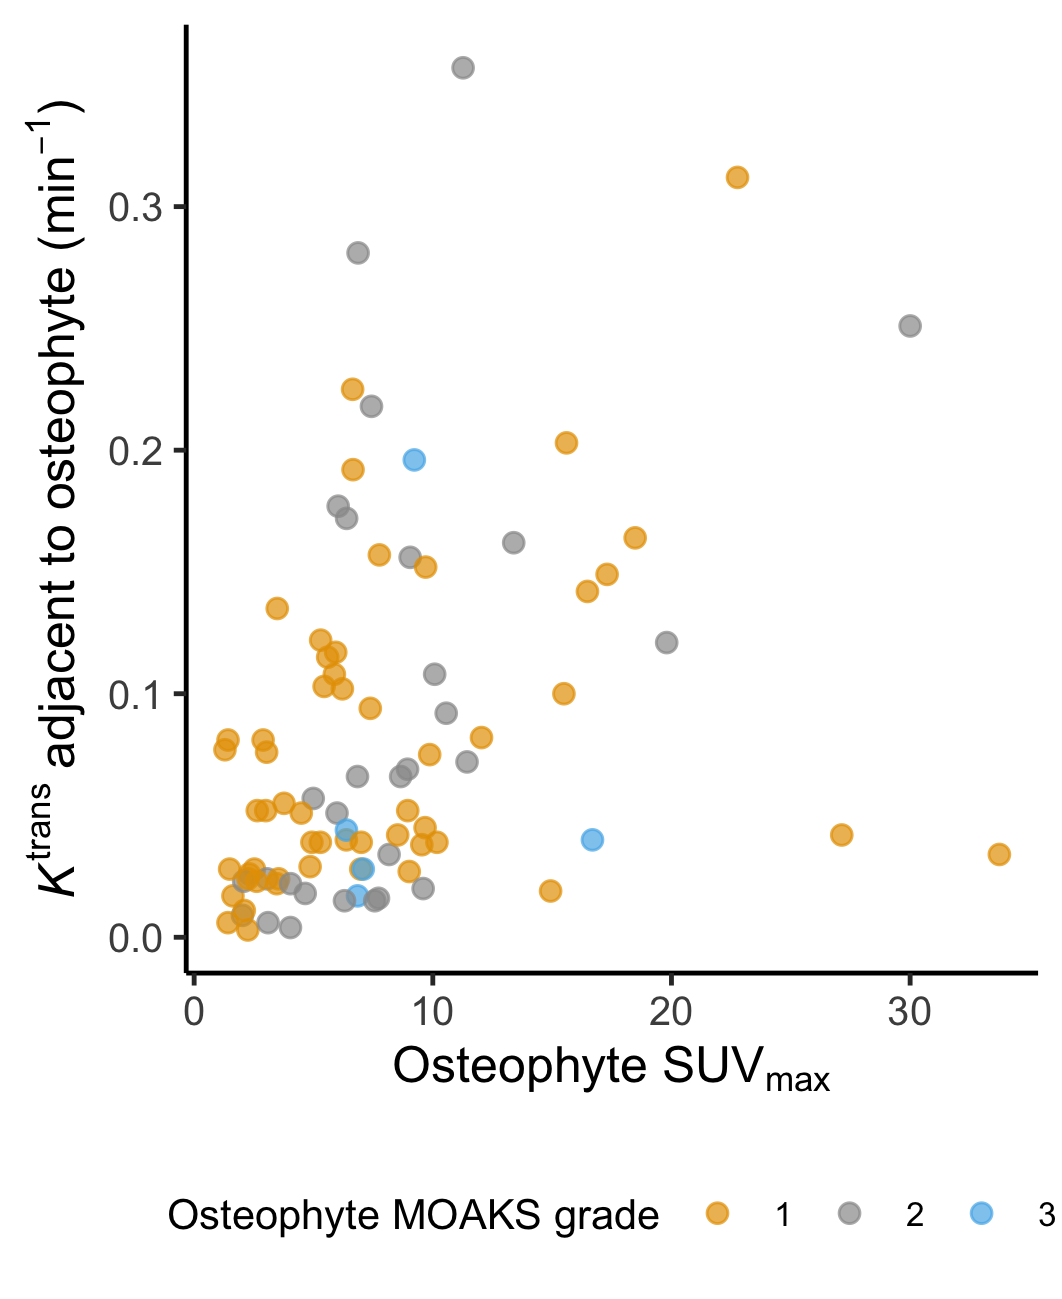
The unadjusted correlation between osteophyte SUVmax and adjacent Ktrans is demonstrated in Figure 4. There was a significant positive association between osteophyte SUVmax and adjacent Ktrans after adjusting for covariates (R2 = 0.49, p = 0.003). In the fitted linear model, for every standard deviation increase in osteophyte SUVmax (~6.2 units), Ktrans increases by ~0.02 min-1, approximately 40% of the median value in all participants.
A sensitivity analysis using a ‘normalised’ osteophyte SUVmax (ratio of osteophyte SUVmax to background metaphyseal bone SUVmax) demonstrated a similar strength of association (R2 = 0.50, p = 0.01).
Discussion
Our results provide initial in-vivo evidence of the relationship between osteophyte metabolic activity and intensity of adjacent synovitis.Interestingly there was little difference in median Ktrans adjacent to larger vs smaller osteophytes. This argues against the hypothesis that synovitis adjacent to osteophytes is purely related to mechanical irritation. Our results show a stronger relationship between synovitis and osteophyte physiology suggesting that the association may be mediated more by biological than mechanical factors.
The combination of quantitative PET and DCE-MR imaging provides a unique opportunity to evaluate the spatial and temporal relationship between synovitis and osteophyte development, and to examine whether interventions targeting synovitis also have effects on adjacent bone metabolic activity progression or vice versa. Moreover, combining information from quantitative metrics on multiple tissues as demonstrated here may offer new insights into OA pathophysiology given the increasing recognition of OA as a disease of the whole joint organ7.
Conclusion
Synovitis is more intense adjacent to osteophytes than the whole-joint average and is more intense adjacent to more metabolically active osteophytes.Acknowledgements
JWM would like to acknowledge the receipt of an Osteoarthritis Research Society International (OARSI) collaborative scholarship and a British Society of Skeletal Radiologists Travel Bursary.References
1. Blom, A. B. et al. Synovial lining macrophages mediate osteophyte formation during experimental osteoarthritis. Osteoarthritis Cartilage 12, 627–635 (2004).
2. Kogan, F. et al. Simultaneous bilateral-knee MR imaging. Magn. Reson. Med. 80, 529–537 (2018).
3. Hunter, D. J. et al. Evolution of semi-quantitative whole joint assessment of knee OA: MOAKS (MRI Osteoarthritis Knee Score). Osteoarthritis Cartilage 19, 990–1002 (2011).
4. Xanthopoulos, E. et al. Improved wrist pannus volume measurement from contrast-enhanced MRI in rheumatoid arthritis using shuffle transform. Magn. Reson. Imaging 25, 110–116 (2007).
5. Tofts, P. S. Modeling tracer kinetics in dynamic Gd-DTPA MR imaging. J. Magn. Reson. Imaging JMRI 7, 91–101 (1997).
6. Parker, G. J. M. et al. Experimentally-derived functional form for a population-averaged high-temporal-resolution arterial input function for dynamic contrast-enhanced MRI. Magn. Reson. Med. 56, 993–1000 (2006).
7. Loeser, R. F., Goldring, S. R., Scanzello, C. R. & Goldring, M. B. Osteoarthritis: A Disease of the Joint as an Organ. Arthritis Rheum. 64, 1697–1707 (2012).
8. Singh, A., Cai, K., Haris, M., Hariharan, H. & Reddy, R. On B1 inhomogeneity correction of in vivo human brain glutamate chemical exchange saturation transfer contrast at 7T. Magn. Reson. Med. 69, 818–824 (2013).
Figures