1150
Evaluation of the risk of osteoporosis by using IDEAL-IQ in diabetic patients1Department of Radiology, the First Affiliated Hospital of Dalian Medical University, Dalian, China, 2Department of Radiology, Peking University Third Hospital, Beijing, China, 3GE Healthcare, MR Research, Beijing, China
Synopsis
Diabetes is a metabolic disease that leads to a high risk of fracture related to osteoporosis. Noninvasive and reliable assessment of osteoporosis is essential for clinical practice. The aim of this study was to explore the agreement of the Proton Density Fat Fraction (PDFF) values of lumbar vertebra measured by Magnetic Resonance Imaging (MRI) IDEAL-IQ sequences at different field strengths and to investigate the value of IDEAL-IQ in the assessment of osteoporosis risk in diabetic.
Introduction
Osteoporosis is a progressive metabolic bone lesion characterized by a decrease in bone mass, which in turn leads to increased risk of bone fractures [1]. Numerous studies have reported that osteoporosis is closely related to diabetes, chronic liver disease, kidney disease and hyperthyroidism caused by long-term use of steroids and anti-epileptic drugs [2]. Therefore, the noninvasive and reliable assessment for the risk of osteoporosis is critical for clinical diagnosis and treatment. Over recent years, different studies have reported that precise measurement of fat content in bone marrow could be used as a biomarker for quantifying osteoporosis [3]. MR IDEAL-IQ technology can be used for quantitative measurement of PDFF and iron content related parameters by multi-echo acquisition [4]. In this study, we investigated the accuracy and reliability of quantitative assessment of lumbar vertebral fat fraction by IDEAL-IQ at 1.5T and 3.0T MR and its value in assessing the risk of osteoporosis in diabetic patientsMaterial and Methods
After providing informed consent, 36 diabetic patients were subjected to 1.5T and 3.0T MR lumbar vertebra and Dual energy X-ray absorptiometry(DXA) scan respectively , MR scan sequences included sagittal T2WI, T1WI, axial T1WI and IDEAL-IQ sequences. Patients were divided into normal bone mass, osteopenia and osteoporosis group. The IDEAL-IQ sequence parameters are as follows: 1.5T MR:TR = 17.6ms, TE = 6ms, NEX = 4, FOV = 32 × 32cm, layer thickness = 5 mm, Phase = 192, flip angle = 5 °, bandwidth = 125 kHz , scan time is 122s; 3.0T MR:TR=5.7ms, TE=2.8ms, NEX=4, FOV=32×32cm, layer thickness=6mm, Phase=192, flip angle=3°, bandwidth=125, The scan time is 78s. The IDEAL-IQ sequence automatically generates 6 images, including PDFF images, R2* relaxation rate images, water images, fat images, in-phase and out-phase images. The PDFF values of vertebral bone marrows were measured on GE ADW4.6 post processing workstation (Figure 1a-b) : the largest slice of the sagittal plane of the L1~L5 vertebral body (the image through the middle of the lumbar vertebra) was selected, and the rectangular region of interest(ROI) was manually placed to the center of the vertebral body, the ROI of each vertebral body is the same. Each ROI should include the vertebral cancellous bone to the maximum, but avoid the cortical bone, endplate and intervertebral disc. Each vertebral body was averaged after 3 measurements. Bland-Altman difference plots were used to assess bias and agreement among PDFF measurements across the two different field strengths. Pearson correlation coefficients were calculated to assess the linear relationship between PDFF and BMD.Results
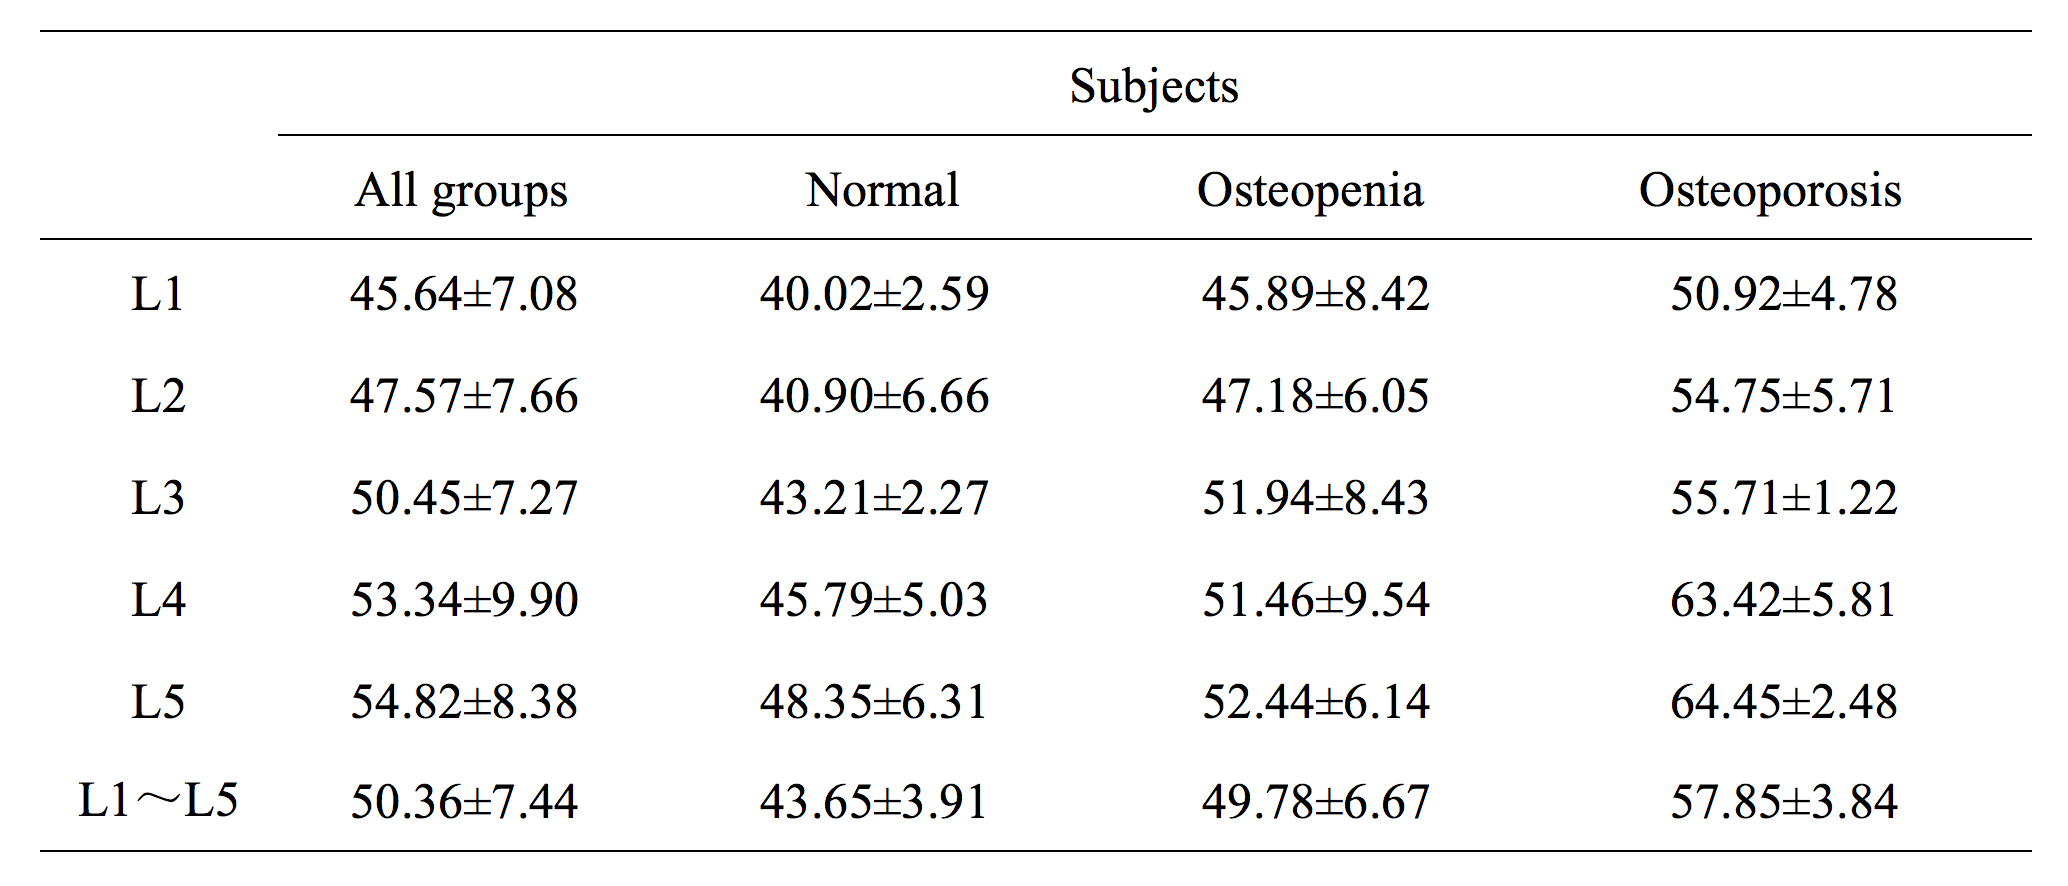
Excellent interrater agreement was shown between the PDFF of lumbar vertebra obtained with 1.5T and 3.0T MR (Figure 2, Table 1). Paired sample t-test analysis showed 1.5T & 3.0T L1 vertebral bodies(t=0.59,P=0.56),1.5T & 3.0T L2 vertebral bodies(t=-1.04,P=0.31),1.5T & 3.0T L3 vertebral bodies(t=-0.74,P=0.46),1.5T & 3.0T L4 vertebral bodies(t=-1.18,P=0.25),1.5T & 3.0T L5 vertebral bodies(t=-1.12,P=0.27). The average PDFF values among three groups were 43.65±3.91, 49.78±6.67 and 57.85±3.84, respectively (Table 2). One-way ANOVA revealed a statistically significant difference in PDFF between normal and osteoporosis group (Post-Hoc LSD, P=0.013), while no significant difference was found between normal and osteopenia group or osteopenia and osteoporosis group (Post- Hoc LSD, P=0.084; Post-Hoc, P=0.171). Pearson correlation analysis showed that BMD was negatively correlated with PDFF values (r=-0.88,P<0.01, Figure 3).Discussion and conclusion
Our results demonstrated that the lumbar vertebral PDFF quantitatively measured at different field strengths showed excellent interrater agreement and strong positive Pearson correlation. Our results showed good agreement and reproducibility of quantifying the lumbar vertebra bone marrow fat content by using MRI IDEAL-IQ sequence at 1.5T and 3.0T imaging. Furthermore, in this study, we investigated the value of IDEAL-IQ for assessing the risk of osteoporosis in diabetic patients. We found that the average PDFF values in normal, osteopenia and osteoporosis group were gradually increasing, and that the PDFF value of osteoporosis group was significantly higher compared to normal group (P <0.05). Our data also suggested that patients with osteopenia and osteoporosis had a higher PDFF value compared to those in normal group. With the decrease of bone mass, the PDFF value gradually increased; the PDFF value of lumbar vertebral measured by MR IDEAL-IQ technology had strong negative correlation with the BMD measured by the bone mineral density. Moreover, our data revealed that the PDFF measurement is not affected by different MR field strengths, which suggested that the quantitative assessment of lumbar vertebral fat content in diabetic patients by IDEAL-IQ can be performed with devices of different MR field strength. In conclusion, IDEAL-IQ can quantitatively evaluate the fat fraction of lumbar vertebral and evaluate the risk of osteoporosis in diabetic patients. PDFF measurements at MR are highly reproducible between different field strengths, which is of guiding value for clinical diagnosis and treatment.Acknowledgements
No acknowledgement found.References
[1]Tarantino U , Iolascon G , Cianferotti L , et al. Clinical guidelines for the prevention and treatment of osteoporosis: summary statements and recommendations from the Italian Society for Orthopaedics and Traumatology. J Orthop Traumatol, 2017. 18(Suppl 1): 3-36.
[2]Sellmeyer D E , Civitelli R , Hofbauer L C , et al. Skeletal Metabolism, Fracture Risk, and Fracture Outcomes in Type 1 and Type 2 Diabetes. Diabetes, 2016. 65(7): 1757-1766.
[3] Baum T, Lorenz C, Buerger C, et al. Automated assessment of paraspinal muscle fat composition based on the segmentation of chemical shift encoding-based water/fat-separated images. Eur Radiol Exp, 2018. 2(1): 32.
[4] Reeder S B , Pineda A R , Wen Z , et al. Iterative decomposition of water and fat with echo asymmetry and least-squares estimation (IDEAL): application with fast spin-echo imaging. Magn Reson Med, 2005. 54(3): 636-644.
Figures