1147
A Report on the International Workshop on Osteoarthritis Imaging Segmentation Challenge: A Multi-Institute Evaluation on a Standard Dataset1Electrical Engineering, Stanford University, Stanford, CA, United States, 2Radiology, Stanford University, Stanford, CA, United States, 3Radiology, University of California San Francisco, San Francisco, CA, United States, 4University of Central Florida, Orlando, FL, United States, 5Radiology, Columbia University Medical Center, New York, NY, United States, 6Radiology, University of Pennsylvania, Philadelphia, PA, United States, 7Radiology, University of Minnesota, Minneapolis, MN, United States, 8Electrical and Computer Engineering, University of Minnesota, Minneapolis, MN, United States, 9Computer Science, University of Copenhagen, Copenhagen, Sweden, 10Biomedical Engineering, Cleveland Clinic, Cleveland, OH, United States, 11Radiology, New York University Langone Health, New York, NY, United States, 12Biomedical Imaging and Image-Guided Therapy, Medical University of Vienna, Vienna, Austria
Synopsis
Cartilage thickness can be predictive of joint health. However, manual cartilage segmentation is tedious and prone to inter-reader variations. Automated segmentation using deep-learning is promising; yet, heterogeneity in network design and lack of dataset standardization has made it challenging to evaluate the efficacy of different methods. To address this issue, we organized a standardized, multi-institutional challenge for knee cartilage and meniscus segmentation. Results show that CNNs achieve similar performance independent of network architecture and training design and, given the high segmentation accuracy achieved by all models, only a weak correlation between segmentation accuracy metrics and cartilage thickness was observed.
Introduction
Cartilage degradation is one of the hallmarks of osteoarthritis (OA). Changes in cartilage thickness have shown to be predictive of radiographic joint-space loss and joint arthroplasty1. While manual segmentation is the gold-standard for evaluating cartilage morphology, it is time-consuming and has high inter-reader variability2. Recent advances in deep-learning and convolutional neural networks (CNNs) have simplified the development of automatic segmentation tools3–5. However, challenges in characterizing network training and the heterogeneity of datasets used for network evaluation have limited pervasive utilization of these techniques. To address these limitations, a segmentation challenge was organized at the International Workshop on Osteoarthritis Imaging (IWOAI) in June 2019. Here, we present a summary of the challenge submissions and discuss efficacy of diverse, multi-institutional deep-learning approaches for segmenting knee cartilage and meniscus.Methods
As part of the challenge, six teams trained CNNs to segment femoral cartilage, tibial cartilage, patellar cartilage, and menisci in 3D sagittal double-echo steady-state (DESS) scans from the Osteoarthritis Initiative6. The dataset consisted of 88 subjects with Kellgren-Lawrence grades (KLG) between 1 and 4 scanned at two timepoints, who were randomly split into cohorts of 60 for training, with baseline KLG 1/2/3/4 distribution (1,22,36,1), 14 for validation (1,4,8,1), and 14 for testing (0,5,8,1). Challenge participants were blinded to the all subject-identifying information.Approaches among all teams varied considerably in network architectures, training protocols, and data augmentation methods. Deniz, et al. trained a multi-class 3D U-Net with dilated convolutions using a joint weighted cross-entropy and soft-Dice loss7,8. Gaj, et al. modified the DeeplabV3+ architecture to use dense convolutional blocks and trained with a soft-Dice loss9. Iriondo, et al. designed a multi-stage segmentation network built with a cascaded ensemble of 3D and 2D V-Nets and used intensity and geometric transforms for data augmentation. Perslev, et al. sampled 2D slices from multiple planes in the volume to train a 2D U-Net with batch normalization and nearest-neighbor upsampling10. Khosravan, et al. implemented a generative adversarial framework where discriminators trained to differentiate between real and generated 2D slices and 2D volumetric projections of segmentations supervised the segmentation network11. Following the challenge, a sixth submission (Desai, et al.) utilized a simplified 2D, multi-class U-Net optimized on a soft-Dice objective5.
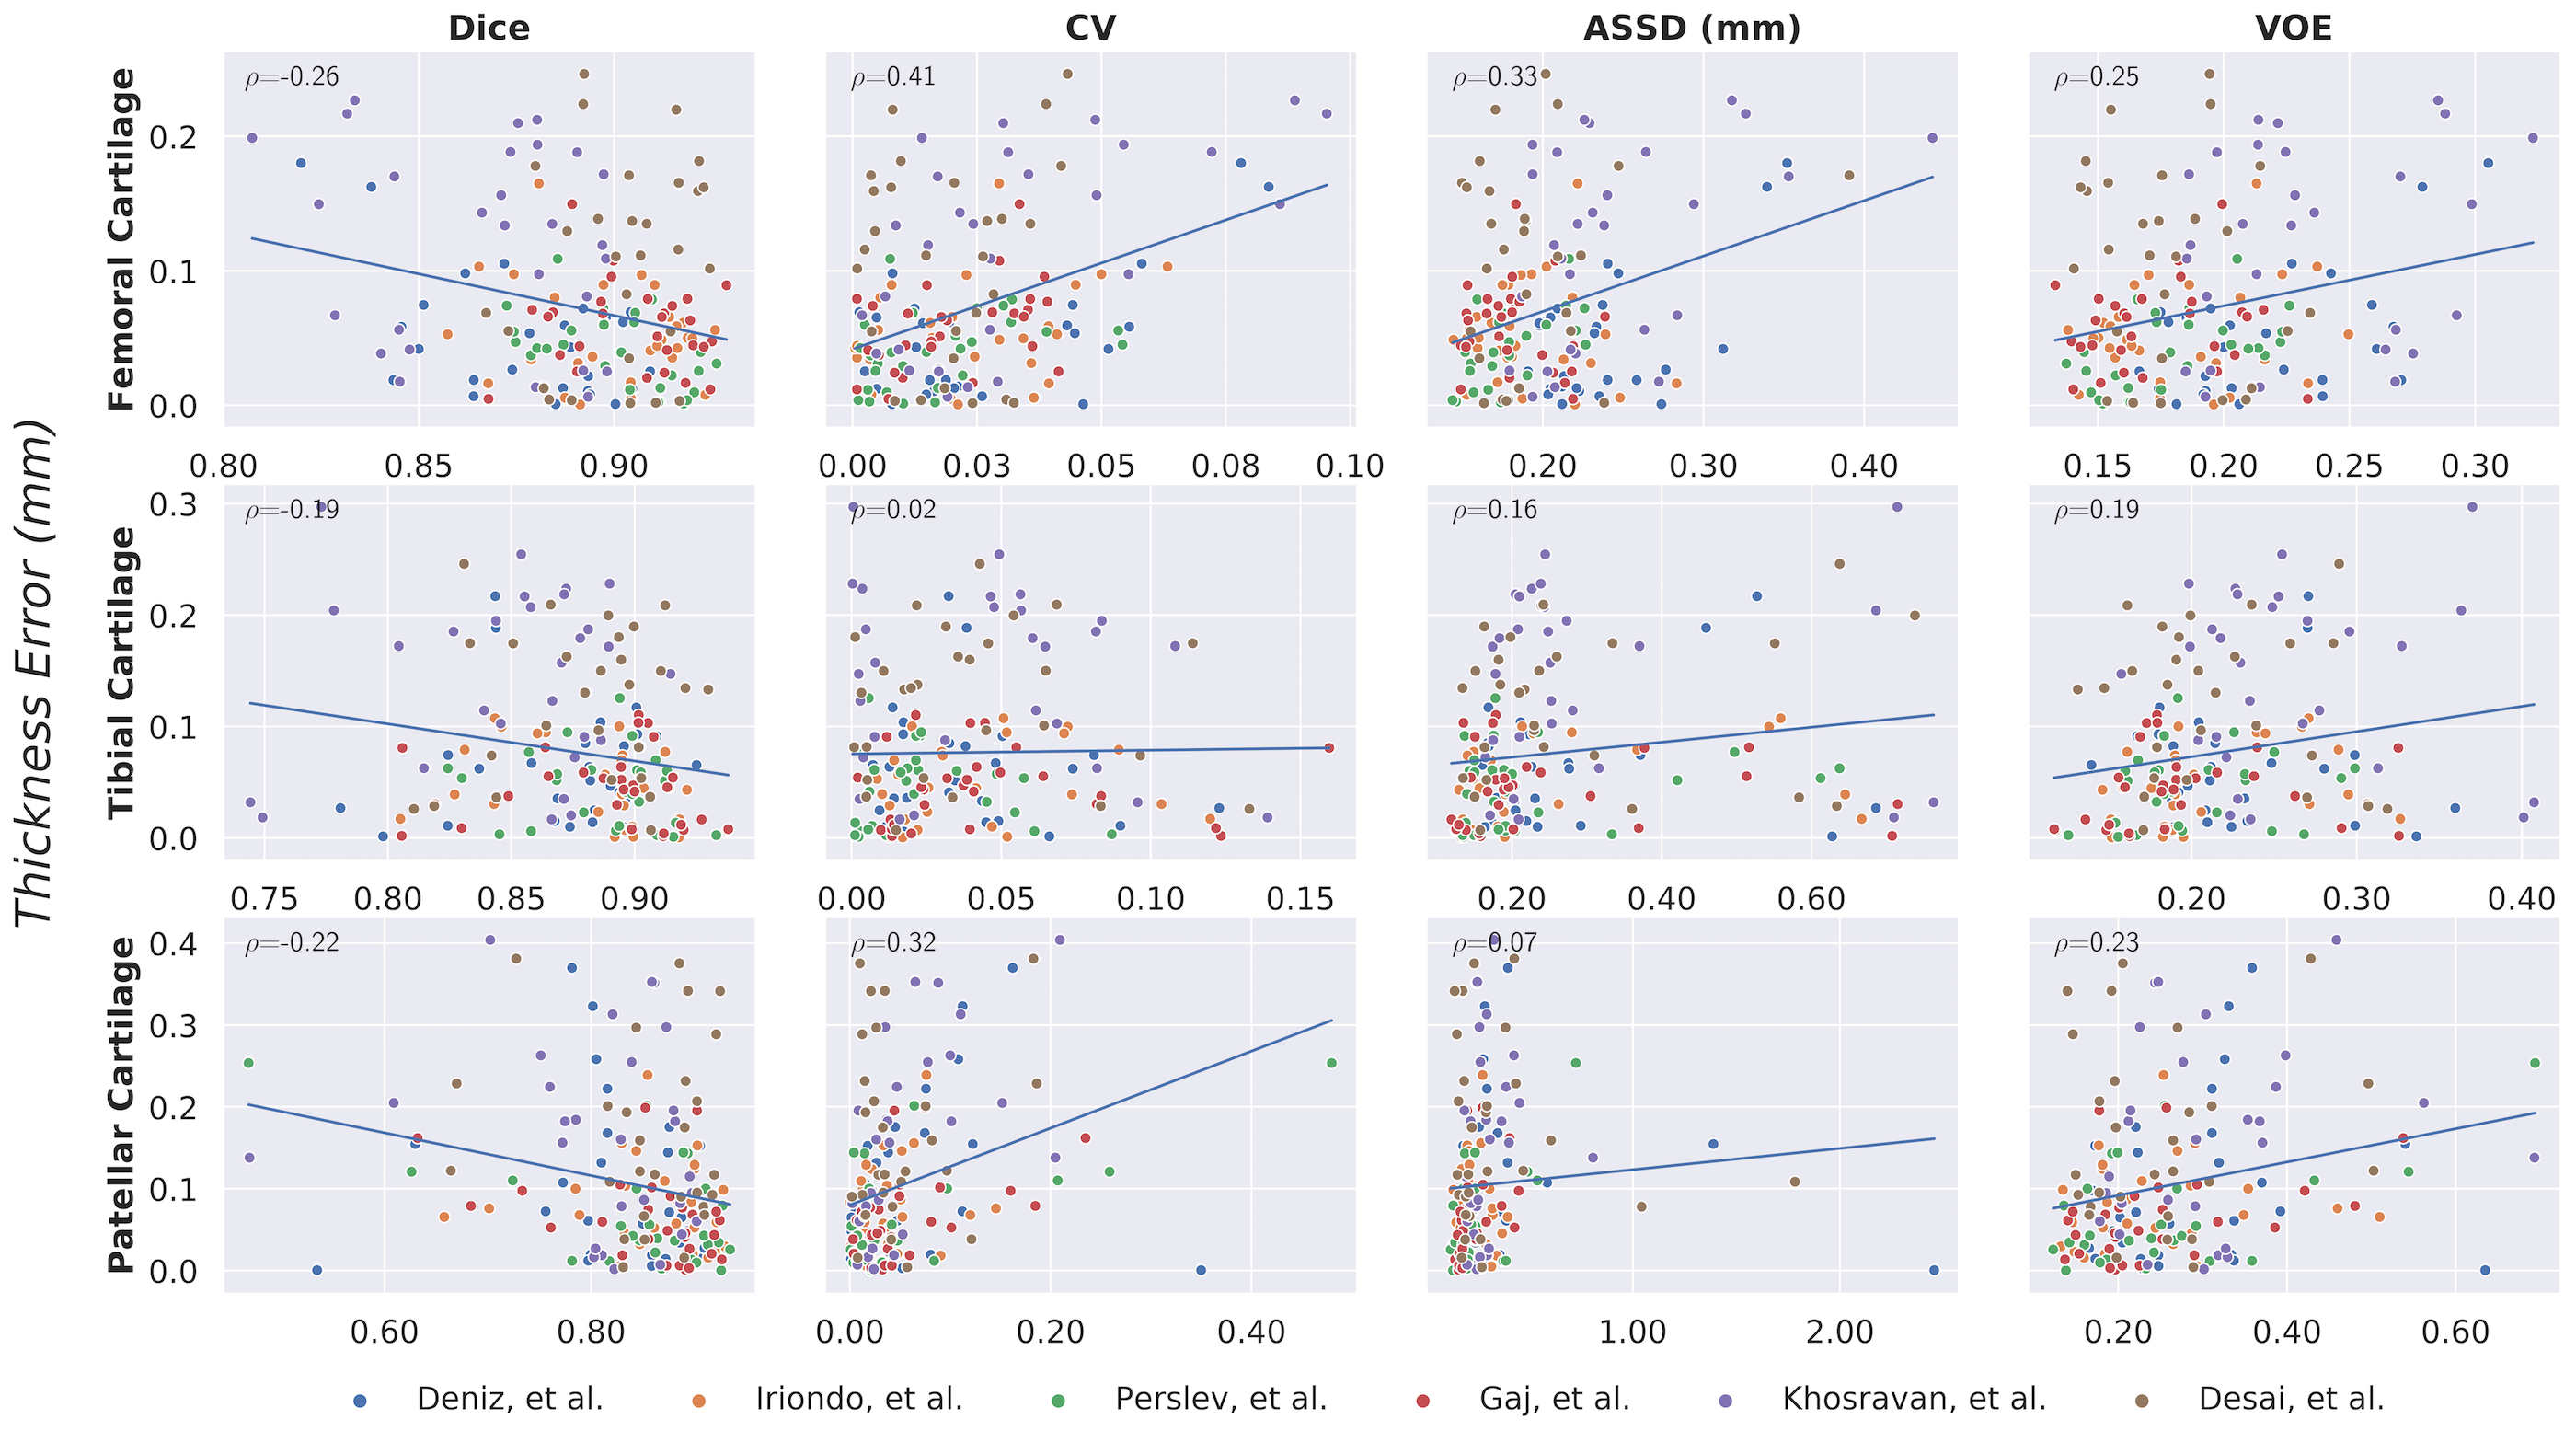
Dice overlap (Dice), volumetric overlap error (VOE), coefficient of variation (CV), and average symmetric surface distance (ASSD) assessed pixel-wise segmentation accuracy compared to expert-annotated ground truth. Differences in cartilage thickness were used to evaluate the efficacy of automatic versus ground-truth segmentations. Dice overlap between network segmentations (termed Dice correlation) was used to evaluate the segmentation similarity between different networks. Correlation between pixel-wise segmentation metrics (Dice, VOE, CV, and ASSD) and cartilage thickness error was measured using Pearson correlation coefficients. Statistical comparisons were performed using Kruskal-Wallis tests, and corresponding Dunn post-hoc tests with Bonferroni correction (α=0.05).
Results
Comparisons of segmentation accuracy among all networks showed similar segmentation performance (Fig. 1). No significant differences were observed in Dice, CV, VOE, ASSD for femoral cartilage (p=1.0), tibial cartilage (p=1.0), patellar cartilage (p=1.0), and menisci (p=1.0) among the four top-performing networks (Gaj, Iriondo, Perslev, Desai, respectively). Dice correlation between individual networks was >0.9 for femoral cartilage, >0.88 for tibial cartilage, >0.86 for menisci, and >0.85 for patellar cartilage (Fig. 2). Networks also displayed similar segmentation accuracy trends across DESS slices in the medial-lateral direction (Fig. 3). There was no systematic underestimation or overestimation of cartilage thickness (Fig. 4). Bland-Altman limits of agreement 95% confidence intervals were 0.36mm for femoral cartilage, 0.32mm for tibial cartilage, and 0.42mm for patellar cartilage. Comparisons of thickness errors showed no significant difference among a majority of the networks (p=0.99).Correlation between pixel-wise segmentation accuracy metrics and cartilage thickness ranged from very-weak to moderate (highest Pearson-R=0.41). Highest correlations were observed with femoral cartilage thickness (Pearson-R>0.25), while very-weak correlation was observed with tibial cartilage (Pearson-R<0.2). CV had the highest correlation with femoral and patellar cartilage thickness (Pearson-R=0.41,0.32).
Discussion
Despite the vast variety of network approaches, most methods achieved similar segmentation and thickness accuracy across all tissues. High Dice correlation between all networks suggested strong concordance in volumetric similarity of the segmentations. Near-identical slice-wise Dice accuracies and failure regions indicated that all networks systematically performed worse in the intercondylar notch and the medial compartment, which is more commonly affected in subjects with OA. The similarity in performance and limitations may suggest that independent networks, regardless of their design and training framework, learn to represent and segment the knee in similar ways.While networks performed similarly, there was higher variability in their thickness estimates. Median cartilage thickness errors were <0.2mm, roughly half the resolution of the DESS voxels. The correlation between standard segmentation metrics and cartilage thickness was weak and tissue-dependent, suggesting that using traditional evaluation metrics on high-performing models may not be predictive of differences in thickness accuracy outcomes.
Conclusion
Through the IWOAI segmentation challenge, we established a standardized and easy-to-use dataset to train and evaluate knee segmentation algorithms. Moreover, using deep-learning-based segmentation algorithms from multiple institutions, we showed that networks with varying training paradigms achieve similar performance and that amongst models achieving high segmentation performance, current segmentation accuracy metrics are weakly correlated with cartilage thickness endpoints.Acknowledgements
Research support provided by NIH AR0063643, NIH EB002524, NIH AR062068, NIH EB017739, NIH EB015891, NIH AR074453, NIH AR070902, NIH AR073552, NSF 1656518, GE Healthcare, and Philips.References
1. Eckstein F, Kwoh CK, Boudreau RM, et al. Quantitative MRI measures of cartilage predict knee replacement: A case-control study from the Osteoarthritis Initiative. Ann Rheum Dis. 2013;72(5):707-714. doi:10.1136/annrheumdis-2011-201164
2. Eckstein F, Kwoh CK, Link TM. Imaging research results from the Osteoarthritis Initiative (OAI): A review and lessons learned 10 years after start of enrolment. Ann Rheum Dis. 2014;73(7):1289-1300. doi:10.1136/annrheumdis-2014-205310
3. Norman B, Pedoia V, Majumdar S. Use of 2D U-net convolutional neural networks for automated cartilage and meniscus segmentation of knee MR imaging data to determine relaxometry and morphometry. Radiology. 2018;288(1):177-185. doi:10.1148/radiol.2018172322
4. Liu F. SUSAN: segment unannotated image structure using adversarial network. Magn Reson Med. 2019;81(5):3330-3345. doi:10.1002/mrm.27627
5. Desai AD, Gold GE, Hargreaves BA, Chaudhari AS. Technical Considerations for Semantic Segmentation in MRI using Convolutional Neural Networks. 2019. http://arxiv.org/abs/1902.01977.
6. Peterfy CGMD, Ph D, D ESP, D MNP. Review The osteoarthritis initiative : report on the design rationale for the magnetic resonance imaging protocol for the knee. Osteoarthr Cartil. 2008;16(12):1433-1441. doi:10.1016/j.joca.2008.06.016
7. Deniz CM, Xiang S, Hallyburton RS, et al. Segmentation of the Proximal Femur from MR Images using Deep Convolutional Neural Networks. Sci Rep. 2018;8(1). doi:10.1038/s41598-018-34817-6
8. Ronneberger O, Fischer P, Brox T. U-Net: Convolutional Networks for Biomedical Image Segmentation. :1-8.
9. Chen LC, Zhu Y, Papandreou G, Schroff F, Adam H. Encoder-decoder with atrous separable convolution for semantic image segmentation. In: Lecture Notes in Computer Science (Including Subseries Lecture Notes in Artificial Intelligence and Lecture Notes in Bioinformatics). Vol 11211 LNCS. Springer Verlag; 2018:833-851. doi:10.1007/978-3-030-01234-2_49
10. Perslev M, Dam EB, Pai A, Igel C. One Network to Segment Them All: A General, Lightweight System for Accurate 3D Medical Image Segmentation. In: ; 2019:30-38. doi:10.1007/978-3-030-32245-8_4
11. Khosravan N, Mortazi A, Wallace M, Bagci U. PAN: Projective Adversarial Network for Medical Image Segmentation. 2019. http://arxiv.org/abs/1906.04378. Accessed September 4, 2019.
Figures