1144
Visibility of artificial dental side root canals using MRI1Dept. of Radiology, Medical Physics, Medical Center - University of Freiburg, Freiburg, Germany, 2Dept. of Oral and Craniomaxillofacial Surgery, Center for Dental Medicine, Medical Center - University of Freiburg, Freiburg, Germany
Synopsis
Detection of root canals is vital for dental diagnosis, however it is difficult to locate these anatomies within sub-millimeter dimension. To determine the ability of MRI to display such structures, a bovine tooth with different sized artificial cavities was prepared. It was evaluated with a preclinical 7T system and a clinical 3T MR system against cone beam CT. 7T measurements with UTE offer precise distinction of cavities up to 200µm. 3T UTE allows only differentiation of 1000µm cavities due to blurring. Tooth immersed in contrast agent solution allows localization up to 200µm cavity with spin echo sequence and negative contrast.
Introduction
Dental root canals show large anatomical variabilities which stimulates the interest in non-invasive imaging methods1. Since the prognosis of periapical treatments depends on the preparation and disinfection of root canals, reliable imaging of the canals is mandatory2,3. Current standard methods for apical imaging are periapical radiography (PR) and cone beam computed tomography (CBCT)4 both of which only offer a very limited root canal contrast. To distinguish structures in dentin and enamel (e.g., hard substance fractures and gaps between restorations and healthy tooth substance), a spatial resolution of 200 μm is required. In MRI, dentin and enamel are thus difficult to visualize due to the extremely short T2* values5, and the required high spatial resolution leads to low Signal-to-Noise (SNR) which further limits root canal visualization in MRI. To overcome the rapid signal decay, special sequences such as ultra-short echo time (UTE)6 are required to minimize TE and maximize signal intensity7. In this work we test UTE MRI methods to visualize small structures in dental material at a preclinical high-field and a clinical MR system, and imaging results are compared to CBCT.Materials and Methods
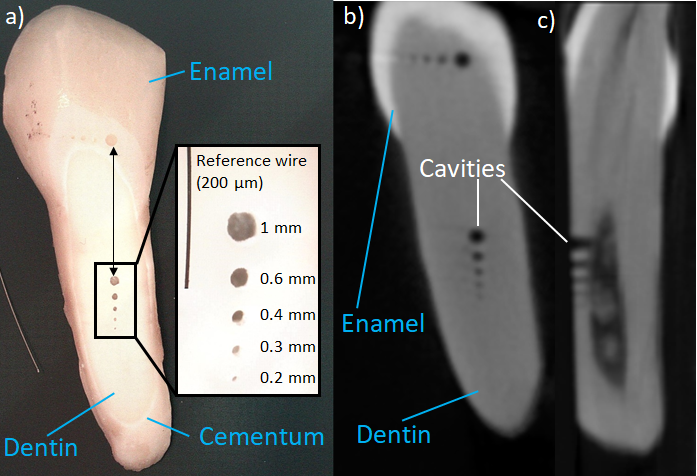
For all imaging experiments an extracted bovine tooth was used which was placed in 0.1 % thymolic solution. Five different reference cavities (1000µm, 600µm, 400µm, 300µm and 200µm) were milled into dentin and enamel to emulate side root canals of different sizes as visible in Figure 1. MRI was performed on a 7T Bruker Biospec System (Bruker bioSpin GmbH, Ettlingen, Germany) with a cryogenically cooled (77 K) Tx/Rx RF probe. A 3D UTE sequence was applied with TR of 8ms, TE=70µs, α=5°, BW=1875Hz/Pixel, 1 average, isotropic resolution=100µm, FoV=32mm and TA=19 min. As a reference, a CBCT (Orthophos SL, 943 mGycm2, TR=14.2 ms, tube voltage 85 kV, tube current 6 mA, Dentsply Sirona GmbH Germany) and PR (VistaScan Mini VI, TR=0.06 s, tube voltage 70 kV, tube current 7 mA, Dentsply Sirona GmbH Germany) was performed. Furthermore, MRI data were acquired at a 3T clinical MR system (PRISMAFit, Siemens Healthineers, Erlangen, Germany) with a Siemens loop coil (4cm diameter) and with a 3D UTE sequence: TR=5 ms, TE=70 µs, α=16 °, FoV=50 mm³, BW=2000Hz/Pixel, 2 averages, nominal isotropic resolution=361µm, FoV=50mm, TA=35 min and 260,000 radial spokes. Additional measurements were acquired with different TEs (70, 100, 200, 400, and 800µs). Afterwards, the tooth was immersed in a contrast agent solution (1% Multihance), and images were acquired with a 2D Turbo Spin Echo protocol: TR=500 ms, TE=50 ms, α=90 °, BW=279 Hz/Pixel, 5 averages, base resolution 0.2mm*0.2mm, FoV=50 mm³, BW=279 Hz/Pixel, TA=10 min and slice thickness of 0.5mm.Results
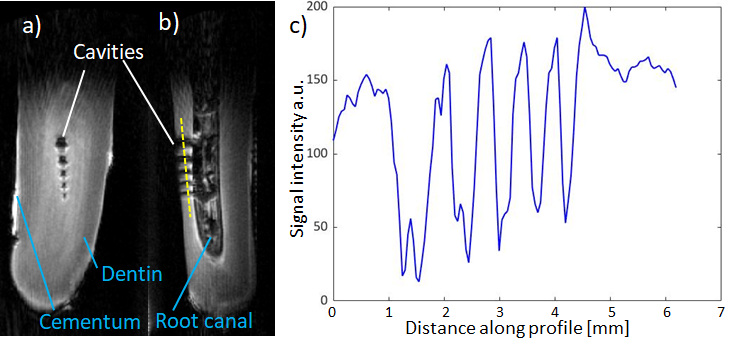
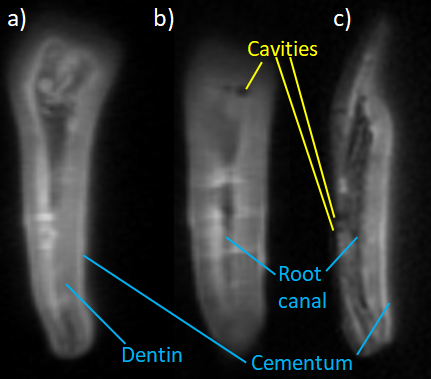
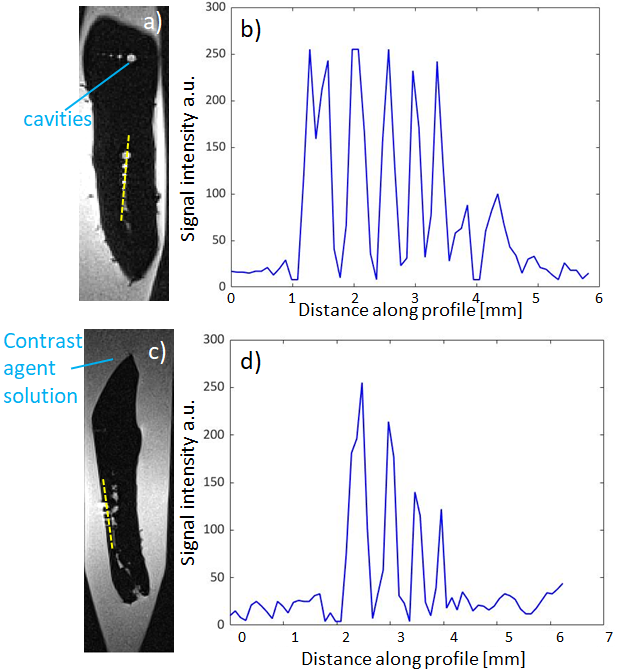
The 3D UTE sequence allows clear depiction of hard tissue at 7T (Figure 2). All cavities are clearly distinguishable at a resolution of 100 µm at transversal (2a) and sagittal (2b) orientation along with other tissues such as dentin, dental pulp, the root canal and cementum. Figure 2c) shows a line profile along sagittal orientation with clear differentiation of the cavities. With the UTE sequence at 3T, dental tissues like the root canal, dentin, cementum and dental pulp are also visible in Figure 3 and calculation from multiple TEs yield an average T2* relaxation time for dentin of 250µs. The biggest cavity (1000µm) is discernable despite blurring. Immersing bovine tooth in contrast solution allows visualization of all five cavities (in enamel and dentin respectively) as shown in Figure 4 along with corresponding signal intensity profile. CBCT measurement also shows all cavities on dentin and enamel tissue as reference.Discussion
At 7T all cavities are clearly visible with high base resolution (100 µm), because preclinical MRI systems offer higher slew rates and amplitudes, so that a higher spatial resolution is feasible with virtually no blurring artifacts and superior to CBCT images (Figure 1). At 3T, the nominal spatial resolution is only 0.361 µm³, and a further blurring is expected due to very fast T2* decay, which can be calculated from the readout bandwidth and the T2* to FWHM = 2.21 pixel (i.e., 800 µm)8. Filling the drilled holes with a contrast agent solution solves this problem, as now a conventional MRI sequence with higher spatial resolution can be used. This, however, might not always be possible with the root canals, even though in X-ray imaging also contrast agents are applied for visualization. The high spatial resolution requirements and the short T2* are currently challenging for clinical MRI systems with limited gradient amplitude (up to 80 mT/m) and slew rate (here: 200 T/m/s), which might be overcome with dedicated high-power gradients (Connectome project). Adding contrast agents offers new possibilities for dental MRI (Figure 4) as it allows imaging of hollow structures with conventional acquisition times (10 min) and higher in plane resolution.Conclusion
Preclinical 7T MRI systems can distinguish structures down to 0.2 mm size, whereas at clinical 3T MRI systems blurring limits the spatial resolution to about 1mm, which can be improved if contrast agents are used. Thus, MRI might be an alternative to X-Ray modalities (CBCT) in situations when ionizing radiation is to be avoided.Acknowledgements
Grant support from the Deutsche Forschungsgemeinschaft (DFG) under grant numbers BO 3025/8-1 and UL 1187/6-1 is gratefully acknowledged.References
[1] Martins J et al. Prevalence Studies on Root Canal Anatomy Using Cone-beam Computed Tomographic Imaging: A Systematic Review. J Endod 45, 372-386.e4 (2019).
[2] Timme M. et al. Imaging of root canal treatment using ultra high field 9.4T UTE-MRI - a preliminary study. Dentomaxillofac Radiol 20190183 (2019)
[3] Colakoglu G et al. Evaluation of the internal anatomy of paramolar tubercles using cone-beam computed tomography. Surg Radiol Anat (2019)
[4] De Paula-Silva, F. W. G., Wu, M.-K., Leonardo, M. R., da Silva, L. A. B. & Wesselink, P. R. Accuracy of periapical radiography and cone-beam computed tomography scans in diagnosing apical periodontitis using histopathological findings as a gold standard. J Endod 35, 1009–1012 (2009).
[5] Hövener JB et al. "Dental MRI: imaging of soft and solid components without ionizing radiation." Journal of Magnetic Resonance Imaging 36.4: 841-846. (2012)
[6] Gatehouse PD et al. Magnetic resonance imaging of short T 2 components in tissue. Clinical radiology, 58(1), 1-19. (2003)
[7] Robson et al. Clinical ultrashort echo time imaging of bone and other connective tissues. NMR in Biomedicine, 19(7), 765-780 (2006).
[8] Rahmer J et al. Three‐dimensional radial ultrashort echo‐time imaging with T2 adapted sampling. Magnetic Resonance in Medicine: An Official Journal of the International Society for Magnetic Resonance in Medicine 55.5: 1075-1082. (2006)
Figures