1143
Multi-modality in vivo imaging of cortical bone vasculature: Comparison of diabetes patients to healthy controls1Department of Radiology and Biomedical Imaging, University of California - San Francisco, San Francisco, CA, United States
Synopsis
Type 2 diabetes is known to increase fracture risk, possibly through the development of pathological cortical bone porosity. However, the mechanisms of pathological pore growth are not understood. We hypothesize that T2D patients will display altered vascularization within cortical pores due to microvascular disease. In this study, 15 T2D patients and 22 controls were imaged by HR-pQCT and DCE-MRI to analyze vessel and perfusion metrics (eg. vessel density, transition time). The study results suggest that T2D patients have altered vessel distribution and perfusion characteristics, and that microvascular disease may be a factor in diabetic bone disease.
Introduction
Type 2 diabetes is a growing worldwide health burden1. Recent studies indicate that T2D patients exhibit 40-70 % higher risk of fragility fractures than non-diabetics, especially at the lower extremity2. This increased fracture risk occurs despite normal or even elevated bone mineral density (BMD), and is therefore not predicted by traditional fracture risk assessment. Increased cortical bone porosity appears to be associated with fracture prevalence in T2D3 but the biological mechanisms driving pathological porosity are unknown. The purpose of this study is to investigate the biological mechanisms driving pathological cortical porosity. Because vascular health is compromised in T2D patients, we hypothesize that T2D patients will display altered vascularization within cortical bone pores. We developed a multi-modal, in vivo image acquisition and processing technique to visualize and identify vessels within cortical bone pores using high resolution peripheral quantitative computed tomography (HR-pQCT) and dynamic contrast-enhanced magnetic resonance (DCE-MRI) and applied this technique to T2D patients and healthy controls to evaluate vessel distribution.Methods
Distal tibias of 15 T2D patients (6 males and 9 females; mean age=61±5 years) and 22 controls (9 males and 13 females; mean age = 64±5 years) were recruited. All participants completed DXA scanning and medical history questionnaires. They were included in the study only if they were in the osteopenic range (T-score −1.1 > −2.5) and did not take bone-active medications. Each participant was imaged using HR-pQCT to identify cortical bone boundaries and pore space, and 3D DCE-MRI to visualize vessels within pore space. HR-pQCT scans were acquired at a nominal resolution of 82 µm isotropic (XtremeCT Scanco Medical AG). 3D DCE-MRI was acquired using spoiled gradient recalled (SPGR) pulse sequences on a 3T whole-body scanner (MR750, GE Healthcare) with the following parameters: TR/TE = 11.8-12.2 ms/4.1 ms; bandwidth = ±125 kHz/pixel; flip angle = 20°; matrix size = 512 x 384; FOV = 12 x 9 cm2; phase FOV=0.75; and slice thickness = 0.5 mm; in-plane spatial resolution 0.23 mm x 0.23 mm. Contrast agent (Gadavist, Bayer HealthCare) was injected at 0.1 mL/kg and 2 mL/sec with 1 min delay. The total scanning time was 9 min. The MRI data was reconstructed to 18 time points with acceleration method to improv temporal resolution5. To identify vessel-filled pores, each DCE-MRI image volume was first co-registered to HR-pQCT using maximal mutual information, and a Frangi vessel enhancement filter4 was applied. Features of the enhancement curves (1st PCA component projection, area under curve, temporal standard deviation and sum of absolute temporal intensity difference) were extracted from the vessel-enhanced image series for all voxels inside the cortical bone mask and used to voxels as either vessel-filled or not vessel-filled by k-means clustering5. Vessel and pore analysis metrics (mean vessel volume, vessel density, cortical porosity, and vessel-pore fraction) as well as perfusion metrics (transition time, area under curve, and maximal enhancement) were calculated for pores and vessels within the intracortical boundaries. A mixed model analysis accounting for multiple measurements per subject, adjusted for age, BMI, and gender, was used to compare metrics between T2D and control groups. The impact of hypertension on perfusion metric comparisons was also investigated.Results
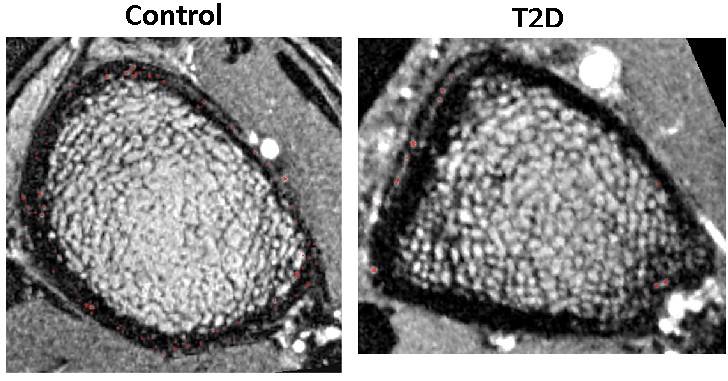
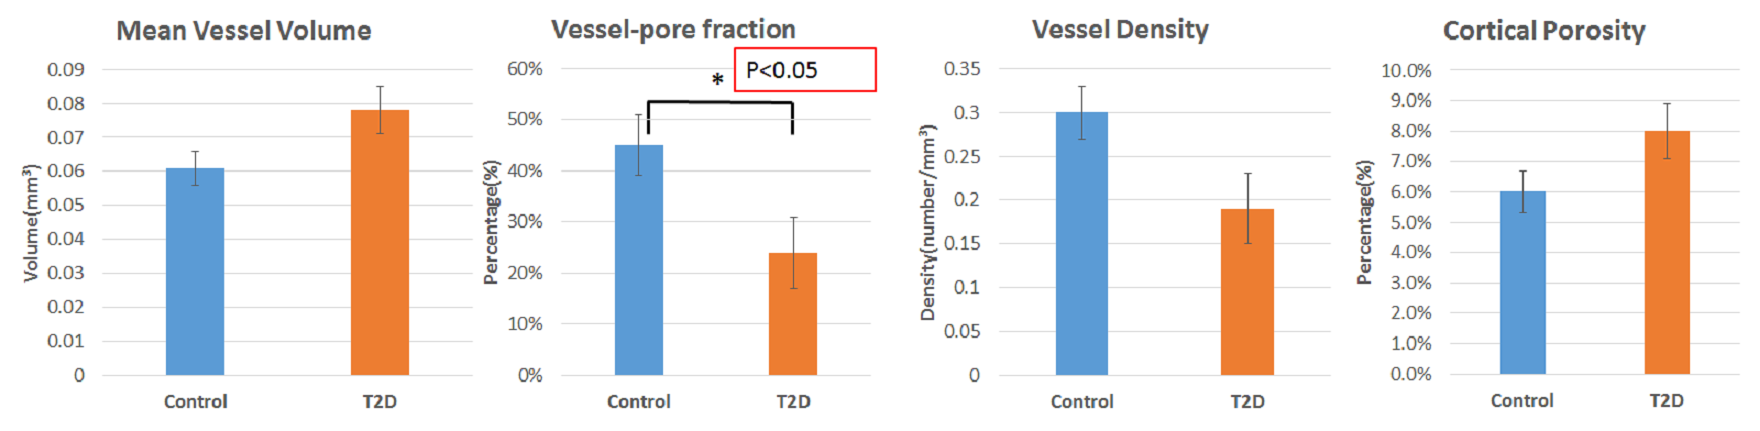
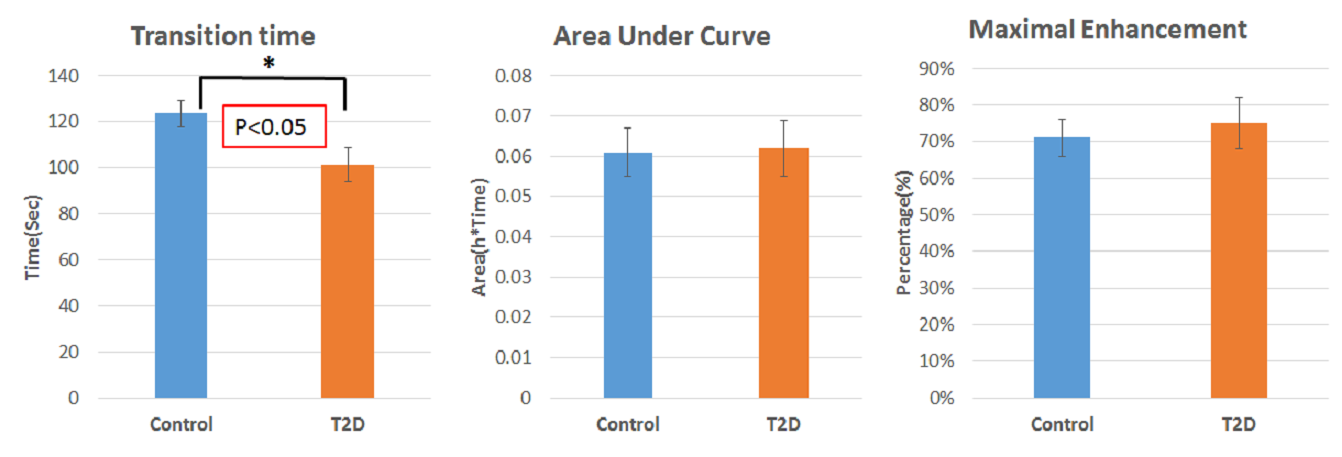
Vessel maps showed a consistent pattern of fewer, larger vessels within pores in the cortex in the T2D group compared to controls. (Figure 1). Quantitative analysis confirmed this observation (Figures 2 & 3). Vessel-pore fraction was significantly lower in T2D patients compared to controls (p=0.049). Mean vessel volume trended higher (p= 0.07), while vessel density trended lower (p= 0.09), in T2D patients compared to controls. Cortical porosity was similar between groups. Transition time was significantly lower in T2D patients compared to controls (p =0.04). Area under curve and maximal enhancement were similar between groups. Adjustment for hypertension did not impact the perfusion comparisons.Discussion and Conclusion
These results suggest that T2D is associated with 1) altered spatial distribution of vascularization within cortical bone, specifically fewer but larger vessels within cortical pore space and 2) altered perfusion characteristics within intracortical vessels, specifically shorter transition time to maximal intensity. This suggests that T2D-associated vascular disease may be a factor in the development of diabetic bone pathology. Ongoing research will focus on longitudinal analyses to confirm the role of microvasculature in the development of pathological porosity in T2D progression.Acknowledgements
This work is supported by NIH NIAMS R01AR069670 and NIH NIAMS R03AR064004.References
1. Vestergaard P. Discrepancies in bone mineral density and fracture risk in patients with type 1 and type 2 diabetes--a meta-analysis. Osteoporos Int. 2007 Apr;18(4):427-44
2. Schwartz AV, Sellmeyer DE, Ensrud KE et al. Older women with diabetes have an increased risk of fracture: a prospective study. J Clin Endocrinol Metab. 2001 Jan;86(1):32-8
3. Patsch JM, Burghardt AJ, Yap SP et al. Increased cortical porosity in type 2 diabetic postmenopausal women with fragility fractures. J Bone Miner Res 2013;28:313
4. Frangi AF, Niessen WJ, Vincken KL, et al. Multiscale vessel enhancement filtering. MICCAI 1998, 130-137
5. Wu PH, Gibbons M, Foreman SC, et al. Cortical bone vessel identification and quantification on contrast-enhanced MR images. Quant Imaging Med Surg. 2019 Jun;9(6):928-941
Figures